
 ?Mathematical formulae have been encoded as MathML and are displayed in this HTML version using MathJax in order to improve their display. Uncheck the box to turn MathJax off. This feature requires Javascript. Click on a formula to zoom.
Abstract
Objective
Current hearing aid prescription rules assume that spectral loudness summation decreases with hearing impairment and that binaural loudness summation is independent of hearing loss and signal bandwidth. Previous studies have shown that these assumptions might be incorrect. Spectral loudness summation was measured and compared for loudness scaling and loudness matching.
Design
In this study, the effect of bandwidth on binaural summation was investigated by comparing loudness perception of low-pass filtered, high-pass filtered, and broadband pink noise at 35 Categorical Units for both unilateral and bilateral presentation.
Study sample
Sixteen hearing-impaired listeners.
Results
The results show that loudness differences between the three signals are different for bilateral presentation than for unilateral presentation. In specific, binaural loudness summation is larger for the low-pass filtered pink noise than for the high-pass filtered pink noise. Finally, individual variability in loudness perception near loudness discomfort level was found to be very large.
Conclusions
Loudness matching is offered as a fast and reliable method to measure individual loudness perception. As discomfort with loud sounds is one of the major problems encountered by hearing aid users, measurement of individual loudness perception could improve hearing aid fitting substantially.
Introduction
In studies on the benefit of hearing aids aversiveness of loud sounds remains an important reason for dissatisfaction with hearing aids (Kochkin Citation2000; Jenstad, Van Tasell, and Ewert Citation2003; Boymans et al. Citation2008; Hickson, Clutterbuck, and Khan Citation2010; Franks and Beckmann Citation1985; EuroTrak Germany Citation2018). However, in most clinical settings individual frequency-specific loudness discomfort levels (LDLs) are not routinely measured (Mueller Citation2003), as loudness measurements are deemed time-consuming and tedious for patients to perform (Formby et al. Citation2017). In many hearing aid fittings, only hearing thresholds are included and the uncomfortable loudness level is estimated, for instance NAL-NL1 and NAL-NL2 do not allow to enter patient-specific LDLs (Keidser et al. Citation2011). And although most hearing aid users wear binaural hearing aids (Kochkin Citation2009; EuroTrak Germany Citation2018) and speech and environmental sounds are broadband signals, most of the current prescription rules such as NAL-NL2 (Dillon Citation2012) and DSL I/O (Cornelisse et al. Citation1995; Bagatto et al. Citation2005; Scollie et al. Citation2005) are based on monaural threshold measurements with narrow-band signals, e.g. pure tones.
To prescribe the right amount of gain for broadband binaural sounds several assumptions about loudness perception are made in the prescription rules. The first assumption is that spectral loudness summation for hearing-impaired listeners is equal to or lower than spectral loudness summation for normal-hearing listeners. Several studies have shown lower-than-normal spectral loudness summation for hearing-impaired listeners (e.g., Bonding and Elberling Citation1980; Brand and Hohmann, Citation2002; Florentine and Zwicker Citation1979; Garnier et al., Citation1999; Verhey et al. Citation2006). The most recent loudness model used in prescription rules is the model by Moore and Glasberg (Citation2004). This model assumes a lower compression for cochlear hearing loss leading to decreased spectral loudness summation. Prescription rules based on this model therefore assume decreased spectral loudness summation. However, some recent studies have shown that spectral loudness summation for individual hearing-impaired listeners can be clearly higher than spectral loudness summation for normal-hearing listeners, after an appropriate compensation of the hearing loss (Oetting et al. Citation2016; Van Beurden et al. Citation2018; Rasetshwane et al. Citation2018).
Rasetshwane et al. (Citation2018) measured the effect of monaural hearing aid amplification on spectral loudness summation. They compared unaided loudness summation to two aided conditions. In both aided conditions gain prescriptions were based on loudness growth curves measured for narrow-band signals at specific frequencies with categorical loudness scaling. In one of the aided conditions, they also accounted for the effects of suppression, the reduction in the cochlear response to a sound due to the simultaneous presence of other sounds. Rasetshwane et al. (Citation2018) found that spectral loudness summation was higher-than-normal for the aided conditions, although the differences between moderate hearing-impaired listeners and normal-hearing listeners decreased when suppression was taken into account.
Oetting et al. (Citation2016) investigated spectral and binaural loudness summation for 9 normal-hearing listeners and 10 hearing-impaired listeners. Loudness perception was quantified by categorical loudness scaling for six narrowband signals and four broadband signals. The hearing-impaired listeners had slight-to-moderate sensorineural hearing losses with pure-tone averages across 500, 1000, 2000, and 4000 Hz between 20 and 44 dB HL. For these listeners, frequency- and level-dependent amplification was used to match the narrowband monaural loudness functions of the normal-hearing listeners. The required gain levels were defined as the differences for each loudness category between the level of the average normal hearing loudness function and the level of the individual narrowband loudness functions. For the broadband signals, the gain prescriptions derived from narrowband sounds were used. The results indicated that spectral loudness summation was slightly higher for hearing-impaired listeners than for normal-hearing listeners for monaurally presented sounds and substantially larger for binaurally presented sounds. Van Beurden et al. (Citation2018) extended the experiments of Oetting et al. (Citation2016) with a larger group of hearing-impaired listeners. They measured spectral loudness summation for monaural and binaural broadband signals in twenty-nine hearing-impaired listeners using the same narrowband loudness compensation as used by Oetting et al. (Citation2016). The hearing losses were grouped according to the Bisgaard classification (Bisgaard, Vlaming, and Dahlquist Citation2010) N2, N3, N4, and a group with ski-sloping audiograms (i.e. Bisgaard category S2 or S3). Van Beurden et al. (Citation2018) showed that the degree of spectral loudness summation significantly increased for large bandwidths for categories N3, N4, and S.
The second assumption made in hearing aid prescription rules is that binaural loudness summation has the same effect for all hearing losses and for all signals. For bilateral fittings, the prescription rules apply fixed gain corrections that are the same for all hearing-impaired listeners. NAL-NL2 proposes bilateral compensation factors (reductions in gain) relative to a unilateral fitting ranging from 2 dB for input levels below 40 dB to 6 dB for input levels at 90 dB SPL and above, regardless of the signal bandwidth (Keidser et al. Citation2012). DSL m[i/o] prescribes a reduction of 3 dB for bilateral fitting re. unilateral fittings (Scollie et al. Citation2005) for speech. However, Van Beurden et al. (Citation2018) have shown that binaural loudness summation depends on the amount of hearing loss and on the level of presentation. Furthermore, Oetting et al. (Citation2016) and Van Beurden et al. (Citation2018) showed that spectral loudness summation was a few decibels larger in bilateral presentation than in unilateral presentation.
Ewert and Oetting (Citation2018) investigated if the differences in loudness perception between normal-hearing and hearing-impaired listeners in the studies by Oetting et al. (Citation2016) and Van Beurden et al. (Citation2018) could be attributed to narrowband loudness compensation or to differences in loudness summation in normal-hearing and hearing-impaired listeners. They used an equal categorical loudness noise (ECLN) that was composed of the six narrowband noises used in the narrowband loudness compensation applied in the study by Oetting et al. (Citation2016). The levels of the six narrowband noises were adjusted to produce an equal categorical loudness. Hearing-impaired listeners showed lower narrowband loudness values compared to normal-hearing listeners, indicating an increased spectral loudness summation. Also, in the case of bilateral presentation seven out of 10 hearing-impaired listeners showed higher spectral loudness summation compared to normal-hearing listeners.
The analysis of the effects of the different audiometric configurations on spectral loudness summation by Van Beurden et al. (Citation2018) suggested that for hearing-impaired listeners the low-frequency components were more important in spectral loudness summation than the high-frequency components. Such an unequal distribution of perceptual weights has been observed earlier in normal-hearing subjects, where the highest weight was given to the lowest noise band for a signal composed of three noise bands (Oberfeld et al. Citation2012) and to the highest and lowest frequencies for a ten-tone complex (Joshi et al. Citation2016).
Finally, current prescription rules implicitly assume that loudness growth is the same for subjects with the same hearing loss. However, Oetting et al. (Citation2016), Van Beurden et al. (Citation2018), and Rasetshwane et al. (Citation2018) all showed that individual differences in spectral loudness summation were substantial, even for subjects with similar degrees of hearing loss. Large inter-individual differences in the loudness domain have been found earlier in literature on the measurement of the LDL. In several large-scale studies (e.g. Kamm, Dirks, and Mickey Citation1978, Formby et al. Citation2017) LDLs were found to vary considerably for subjects with different hearing losses but were also found to vary significantly for subjects with the same degree of hearing loss. Formby et al. (Citation2017) reported loudness judgments within the same loudness category to vary across a group of 30 normal-hearing listeners by as much as 50 to 60 dB.
Nelson et al. (Citation2018) allowed a group of mild to moderate hearing-impaired listeners to self-adjust hearing aid gain for speech understanding in a variety of quiet and noisy listening conditions. They also found a large between-subject variability with the range of selected gains spanning about 40 dB. Perry, Nelson, and Van Tasell (Citation2019) analysed the individual variability of gain values chosen in several studies on self-adjustment and concluded that the range of selected gains depended on the range of gain values made available to the subjects. In audiologist-driven fittings, the range of available gain values may be unconsciously limited by the tendency of an audiologist not to deviate too far from the gain proposed by the prescription rule. This may explain why we usually do not observe this large ranges in routine hearing aid fitting.
The present study was designed to further investigate the interaction between spectral content and binaural loudness summation with a focus on the role of low and high frequencies in spectral and binaural loudness perception. For this purpose, the loudness of a broadband noise was compared to the loudness of its lower and higher frequency part. The loudness of these three signals was measured with loudness scaling for both unilateral and bilateral presentation for a group of hearing-impaired listeners. The results were analysed in terms of Level Difference at Equal Loudness (LDEL) for spectral effects in unilateral and bilateral presentation, binaural effects, and inter-individual differences.
Loudness scaling provides information on the entire loudness range but is a fairly time-consuming procedure. While information on individual loudness growth appears to be indispensable for a good hearing aid fitting, it may not be necessary to measure loudness growth for each separate presentation level, when the loudness differences between signals are known for a representative presentation level. As measurement time is an important limitation in the clinic, a second objective was to investigate if loudness matching could be suitable as a more time-efficient alternative to measure these loudness differences.
Methods
Subjects
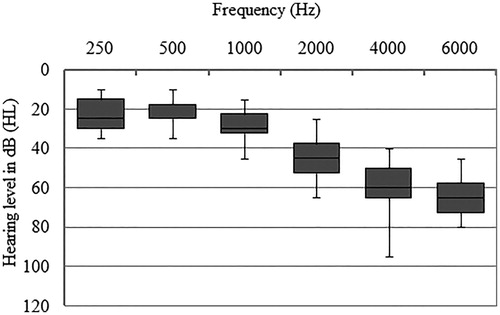
Sixteen adult hearing-impaired listeners participated in the study. Inclusion criteria for the hearing-impaired listeners were native Dutch speakers with mild to moderate symmetrical hearing losses (differences between both ears at 500, 1000, 2000, and 4000 Hz <10 dB) selected from clinical files. Seven men and nine women participated with an average age of 68 years. The distributions of the hearing thresholds for all listeners are given in . Whiskers mark minimum and maximum values.
Figure 1. The distribution of the audiograms for the sixteen subjects. Whiskers mark minimum and maximum values.
Equipment
All measurements were conducted in a sound-insulated booth in a session of about 2 h. Pure-tone audiograms with air and bone conduction were measured less than 4 weeks earlier with DECOS audiometers using TDH39 headphones. Sennheiser HDA 200 headphones were used for both the categorical loudness scaling procedure and for the loudness matching procedure using the experimental approach described by Ewert (Ewert Citation2013). Signals were presented using a RME Fireface UC DA convertor at 44100 Hz sampling frequency. Headphones were calibrated with a Brüel & Kjaer artificial ear type 4153, a 0.5-inch microphone type 4134, a microphone preamplifier type 2669, and a measuring amplifier type 2610. Headphones were free-field equalised according to ISO 389-8 (Citation2004) and levels are expressed as the equivalent free-field levels in dB SPL(FF).
Stimuli
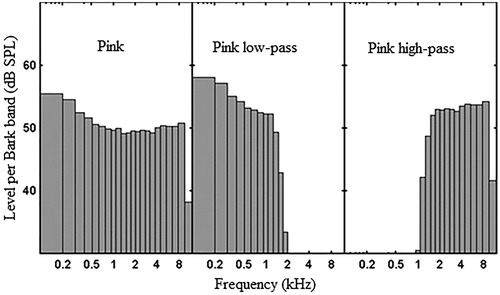
The stimuli were a broadband pink noise (BB) with a bandwidth between 100 Hz and 16000 Hz and low-pass and high pass filtered versions of this same pink noise (LP and HP, respectively), see . The unilaterally presented signals were always presented to the left ear. The LP noise and HP noise were obtained by filtering the original BB noise with an eight order Butterworth filter with a cut-off frequency of 1400 Hz. The perceptual centre of the BB noise would be approximately 1700 Hz. The cut-off frequency was chosen a few 100 Hz lower to put it more in line with the point where the hearing loss in the audiogram starts to drop. All stimuli were 1-s noises with 50-ms rise and fall ramps.
Figure 2. Bark spectrum of the three test signals at 65 dB SPL.
Procedures
Loudness scaling
Categorical loudness scaling was performed using the ACALOS procedure (Brand and Hohmann Citation2002) to measure the loudness perception over the whole dynamic range. During the loudness-scaling procedure listeners had to rate the perceived loudness on an 11-point scale from “not heard” to “too loud”. The scales were transformed into numerical values in “Categorical Units” (CU) from 0 to 50. Stimuli were presented in a pseudo-random order with levels between −10 to 105 dB SPL. A monotonically increasing loudness function was fitted to the responses for each of the ACALOS measurements using the BTUX fitting method (Oetting, Brand, and Ewert Citation2014). The model function consists of two linear parts with independent slopes mlow and mhigh with a smooth transition range (see Brand and Hohmann Citation2002).
Loudness matching
Loudness matching was performed to measure the loudness of 15 pairs of signals, see . In the loudness scaling procedure, the subjects always judged the loudness of a unilateral, or bilateral presented signal. In the loudness matching procedure subjects also compared unilateral signals with bilateral signals. Loudness matching was conducted using a two-alternative forced-choice procedure with a one-up one-down adaptive rule, converging to the 50% point on the psychometric function (Levitt Citation1971). In each trial, the subject heard two sounds, the reference signal and the test signal. The silent interval between the signals was 500 ms. The test and reference signals were presented in random order and with equal a priori probability. The subject indicated which signal was louder by selecting the first or the second signal on a touchscreen. If the subject indicated that the test signal was louder, its level was reduced in the next trial and vice versa. The initial step size was 10 dB. This was decreased to 5 dB after the first upper reversal and to 3 dB after the second upper reversal. The maximal presentation level was set to 105 dB SPL. All comparisons were interleaved to reduce biases that occur when stimuli from only one stimulus pair are matched in loudness in a series of trials (Florentine, Buus, and Poulsen Citation1996, Verhey and Kollmeier Citation2002).
Table 1. Overview of the fifteen pairs of low-pass filtered (LP), high-pass filtered (HP) and broadband (BB) pink noise signals that were matched in this study. The columns show the reference signals and the rows the test signals.
The reference level in the loudness matching procedure was chosen as the level where the loudness function of the loudness scaling procedure corresponded to 35 CU (“loud”). Setting the reference level in the matching procedure equal to the level at CU 35 in the scaling procedure ensured that the results of both procedures could be analysed at equal loudness for all subjects. Previous studies showed large individual differences in loudness curves. The choice of a common reference level (i.e. 90 dB SPL) would have led to a different point on the loudness curve for each subject, making comparisons between subjects and procedures very complex. In this study, the main interest was on the loudness at the high end of the loudness curve, where complaints of discomfort about loud sounds can occur. The 35 CU level was chosen for being the highest point on the loudness curve that provided enough room for the matching procedure to move around the point of equal loudness without reaching levels that could be perceived as too loud. As the loudness scaling results show that loudness measurements at 35 CU are closely related to loudness measurements at 50 CU, we assume that the measurements at 35 CU provide a first approximation for the loudness perception of discomfortable loud sounds. Ideally the start level of the test signal lies equally often above and beneath the estimated level of equal loudness to avoid range effects. For safety reasons the test level always started beneath the estimated level of equal loudness at a level corresponding to 25 CU of the loudness function. This might cause a bias towards lower loudness levels. No level-roving was applied. The safety limit of 105 dB SPL also caused a few missing data points, as in some cases the level at 35 CU was above our safety limit of 105 dB SPL. In these cases, no starting point could be determined for the matching procedure. In other cases, the matching procedure led to matches with levels above this same limit. In that case, the result was also undetermined.
Measurement protocol
There was a fixed order starting with loudness scaling followed by loudness matching, because the results from the loudness scaling procedure were used as input for the reference levels in the loudness matching procedure. The whole measurement set was repeated once in the same session to obtain a retest. In the retest, the reference levels for the loudness matching procedure were based on the retest results of the loudness scaling procedure rather than on the test results. The reference levels in the retest could therefore deviate from the reference levels in the test.
To complete the loudness scaling procedure for one stimulus approximately two minutes were needed. Measurement time for all six conditions (three signals, both unilateral, and bilateral) mounted up to twelve minutes. The loudness matching procedure was faster: fifteen conditions could be matched in twelve minutes.
Results
Effect of frequency spectrum
The main interest of this study was on loudness differences because of different frequency spectra (low-pass, high-pass, broadband) and different presentation modes (unilateral vs. bilateral) in hearing-impaired listeners. These differences have been defined as LDEL at 35 CU. shows the loudness differences between the three stimuli for unilateral and bilateral presentation. The loudness differences were first calculated for test and retest separately and then averaged. Positive values were expected when the reference signal was the broadband signal and the test signal was a filtered signal (LP-BB, HP-BB).
Figure 3. LDEL at a loudness level of 35 CU for unilateral and bilateral presentation. Diamonds represent loudness scaling data, and triangles represent loudness matching data. The first signal is the test signal, and the second signal the reference signal. Positive values indicate that the test signal reaches equal loudness at a higher level than the reference signal. The error bars indicate the standard error of the average spectral loudness effect across all sixteen hearing-impaired subjects.
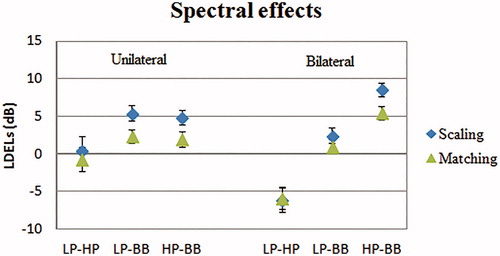
The error bars indicate the standard error of the average spectral loudness effect across all sixteen hearing-impaired subjects. Both procedures showed the same trends. For unilateral presentation, the LDEL for LP-HP was approximately zero. As expected, the LDELs for LP-BB and HP-BB were both positive, indicating that the loudness of 35 CU was reached at a lower level for BB noise than for HP or LP filtered pink noise.
For bilateral presentation the results were different. The LP-HP showed LDEL levels of around −6 dB, signifying that the LP noise levels were 6 dB lower compared to the HP noise levels at equal loudness. The LDEL for LP-BB was around 2 dB whereas the LDEL for HP-BB was around 7 dB. The difference of 5 dB is in the same range of the LDEL for the direct comparison of LP-HP. As will be shown below the differences in spectral effects between unilateral and bilateral presentation appear to be associated with a higher binaural loudness summation for LP noise than for HP noise.
A three-way repeated measures ANOVA with spectral loudness differences (LP-HP, LP-BB, and HP-BB), procedure (loudness scaling, loudness matching), and presentation mode (unilateral, bilateral) as within-subjects variables was conducted. In case sphericity could not be assumed, Huynh-Feldt correction was applied. All main effects were significant (F(1,15.4)=14.9, p = 0.001, F(1,15) = 10.6, p = 0.005, F(1.15) = 6.7, p = 0.021 for spectral loudness differences, procedure and presentation mode, resp.). The interaction effect between presentation mode and spectral loudness differences was also significant (F(1.4,20.8) = 26.0, p ≤ 0.001). Bonferroni corrected post hoc analysis showed a significant difference of 1.9 dB between loudness scaling and loudness matching (p < 0.001), a significant effect between unilateral and bilateral presentation (p = 0.018), and highly significant differences between LP-HP and LP-BB (p < 0.001), LP-HP and HP-BB (p < 0.001), and LP-BB and HP-BB (p = 0.031). Because of the significant interaction effect between presentation mode and spectral loudness differences, separate two-way repeated measures ANOVAs were calculated for both unilateral and bilateral presentation to investigate the spectral differences in more detail. Bonferroni corrected post hoc analysis showed for unilateral presentation only a highly significant difference of 4.0 dB between LP-HP and LP-BB. For bilateral presentation highly significant differences were found between all conditions with a mean difference between LP-HP and LP-BB of 7.7 dB, a mean difference between LP-HP and HP-BB of 13.0 dB, and a mean difference between LP-BB and HP-BB of 5.2 dB. For bilateral presentation, the mean differences have to be interpreted with caution as there was a highly significant interaction effect between procedure and spectral loudness differences (F(2.30) = 8.2, p < 0.001).
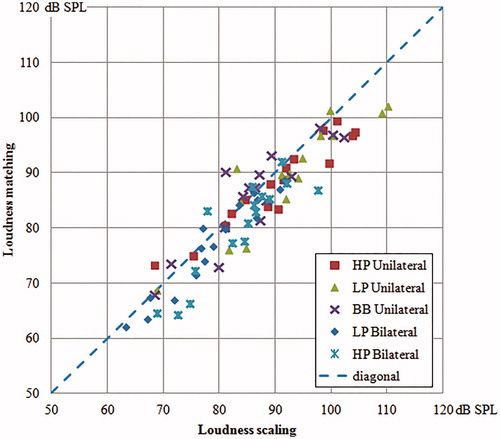
Calculating mean differences with standard errors, as in , obscures the view on the individual variability. In , the levels of the test signal in the matching procedure are plotted as a function of the levels of the categorical loudness scaling procedure at 35 CU. As a result of the cross-over design in the loudness matching procedure, the loudness of a signal in the loudness matching procedure was measured with respect to several different reference signals. For instance, the monaurally presented low-pass filtered noise was the test signal in five different comparisons. This means that these five conditions should lead to the same loudness estimate. The points shown for the loudness matching procedure in are averages of all the conditions in which the signal was the test signal. Note that the number of conditions is different for the five conditions, decreasing from five to two (see ). As binaural BB noise was never the test signal in the loudness matching procedure no data points are available for this stimulus. shows that the individual variability is large. The lowest and highest level of the monaural LP noise at which subjects rated the loudness as “loud” (35 CU) varied from below 70 dB to above 100 dB in both procedures. Comparable ranges of 30 dB between lowest and highest level for a loudness of 35 CU are found for the other signals. Be aware that the signals were presented unaided.
Figure 4. Absolute values for the level at which the signal is perceived to have a loudness equal to 35 CU. The levels for loudness matching are plotted as a function of the levels for loudness scaling with each marker representing one subject.
Binaural effects
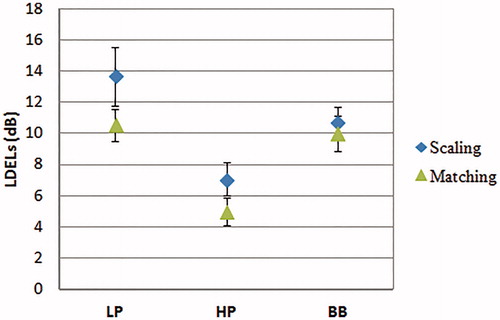
shows binaural summation at a loudness level of 35 CU for all three stimuli. Binaural summation expressed as LDEL was first calculated for test and retest separately and then averaged. Error bars indicate the standard error. clearly shows differences in LDEL. Binaural summation was the largest for the LP noise and lowest for the HP noise. A two-way repeated measures ANOVA with signal (LP, HP, and BB) and procedure (loudness scaling, loudness matching) as within-subjects variables was conducted. All main effects were significant (F(1,15) = 8.28, p = 0.012, F(2,30) = 25.34, p < 0.001), but the interaction effect was not (F(2,30) = 2.4, p = 0.108). Bonferroni corrected post-hoc analysis showed a highly significant difference of 2.0 dB between loudness scaling and loudness matching (p = 0.001), and highly significant differences between LP noise and HP noise and between HP noise and BB noise (p < 0.001). The difference between LP noise and BB noise was at the significance level (p = 0.050).
Figure 5. LDEL between unilateral and bilateral presentation for the three signals.
Intra-test reproducibility
To assess the intra-test reproducibility of both procedures correlations between test and retest were calculated for both procedures. For the loudness scaling procedure, the levels at 35 CU were used for these correlations, as this was the loudness used as the reference level in the loudness matching procedure. For all six conditions (three signals, unilateral and bilateral presentation) test-retest correlations for loudness scaling were high with correlation coefficients above 0.80.
The correlation coefficients for the loudness matching procedure were slightly lower than for the loudness scaling procedure. The average correlation coefficient across all fifteen conditions was 0.81, with a range from 0.70 for HP(B)-LP(B) to 0.89 for HP(B)-Pink(M). The lower correlation coefficients in the matching procedure partly originate from the choice to base the reference levels in the retest conditions of the matching procedure on the outcome of the retest conditions of the scaling procedure. Because of this choice the reference levels differ for test and retest, introducing an extra source of variance.
The pooled standard deviation across subjects (with σi the standard deviation of each subject) calculated for each condition showed a range of 2.9–4.3 dB for loudness scaling and a range of 3.2–6.3 dB for loudness matching. The highest pooled standard deviation was for the conditions with the low-pass filtered pink noise. Calculations of pooled standard variations across conditions for each subject showed a range of 1.7–5.4 dB for loudness scaling and 1.8–8.0 dB for loudness matching. Pearson’s R correlation coefficient between the pooled standard deviations of the loudness scaling procedure and the loudness matching per subject was 0.7, showing that on average subjects with larger standard variations in loudness scaling also showed larger standard variations in loudness matching. The pooled standard deviation across all subjects and conditions amounted to 3.7 dB for loudness scaling and 4.5 dB for loudness matching. Note however that in the loudness matching procedure almost three times as many conditions were measured as in the loudness scaling procedure.
Correspondence between loudness scaling and loudness matching
One of the main goals of this study was to compare loudness matching with loudness scaling. The previous sections showed that both procedures produced significantly different results in spectral and binaural effects. However, this appears to be mainly caused by a static offset between the two procedures. The offset is probably a result of the choice to set the starting level of the test signal always below the level of the reference signal. Verhey (Citation1999) showed that the starting level of a matching procedure influenced the amount of spectral loudness summation. shows that both procedures are well correlated. Correlations were calculated for the data shown in . The results show that correlations for all signals were excellent (0.89 and higher).
Discussion
Spectral effects
Spectral loudness summation is investigated generally by varying the bandwidth of a noise or tone complex geometrically centred around a certain frequency, where the centre frequency is usually in the range between 1000 and 3200 Hz (e.g., Zwicker, Flottorp, and Stevens Citation1957; Verhey and Kollmeier Citation2002; Anweiler and Verhey Citation2006; Bonding and Elberling Citation1980; Rasetshwane et al. Citation2018). As a consequence of varying the centre frequency of the signals in our experiments, the results of the current study cannot be compared directly with other studies on spectral loudness summation. However, it is at least expected that in accordance with the literature the broadband pink noise will show the largest spectral loudness summation effect. Zwicker, Flottorp, and Stevens (Citation1957) found that loudness was less strong for a four-tone complex with equal sound pressure level for each tone centred around 500 Hz than for a four-tone complex centred around 2000 Hz when the spacing in Hz between the tones was identical. However, in this study in unilateral presentation no difference in loudness was found for the two signals. This may be caused by the impact of hearing loss. Hearing loss has been shown to decrease spectral loudness summation (e.g. Scharf and Hellman Citation1966; Florentine and Zwicker Citation1979; Garnier et al. Citation1999, Rasetshwane et al. Citation2018). As the subjects had more hearing loss in the higher frequencies, this may have decreased loudness for the high-pass filtered pink noise. Following this argumentation, the results for unilaterally presented signals are reasonably in line with existing knowledge.
However, the most striking result of this study is the large difference in spectral effects between unilateral and bilateral presentation. While the broadband pink noise still has the lowest level at equal loudness in bilateral presentation (in accordance with the current knowledge on spectral loudness summation), the balance between the low-pass filtered pink noise and the high-pass filtered pink noise is shifted dramatically when unilateral presentation is changed to bilateral presentation. This has not been described in other studies so far, as to our knowledge spectral loudness summation has only been studied monaurally. The main reason only monaural summation has been studied is probably the assumption that binaural loudness summation has no interaction with spectral loudness summation (i.e. Moore et al. Citation2014). However, there are studies that point to higher binaural loudness summation for broadband signals compared to narrowband signals (e.g. Zwicker and Zwicker Citation1991; Oetting et al. Citation2016, 2018; Algom, Rubin, and Cohen-Raz Citation1989; Scharf Citation1968). Oetting et al. (Citation2016) presented an effective extension of Zwicker’s loudness model to consider the increased binaural summation for broadband signals. In our data the large differences in spectral loudness effects between the low-pass and the high-pass filtered pink noises indicate large differences in binaural loudness summation for the two signals.
Hawkins et al. (Citation1987) measured binaural loudness summation with three different paradigms for both normal hearing and hearing-impaired listeners. The amount of binaural loudness summation strongly depended on measurement paradigm. With a loudness balance paradigm similar to the loudness matching procedure in this study Hawkins et al. (Citation1987) found binaural loudness summation for hearing-impaired listeners to be slightly lower for the 4000 Hz pure tone, than for the 500 Hz pure tone (8.1 dB vs. 10.3 dB, resp.), which is in qualitative agreement with our data.
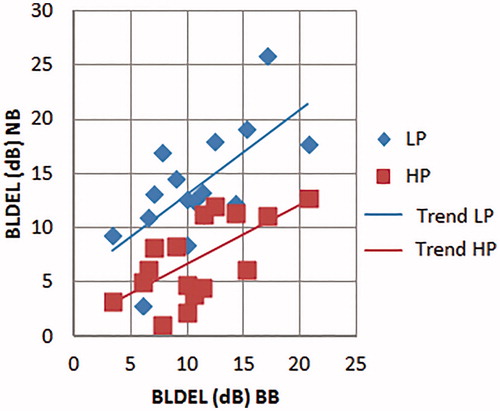
The unexpected large differences in LDEL between LP noise and HP noise when comparing the unilateral and bilateral condition (binaural level difference for equal loudness; BLDEL) was further investigated by plotting the individual BLDEL measured with the loudness scaling procedure for the filtered signals against the BLDEL of the BB, see . Individual values were between 1 and 25 dB. On average a larger BLDEL for BB noise is associated with a larger binaural loudness summation for LP noise and HP noise. This trend is stronger for LP noise than for HP noise. The slope of the linear regression line for LP noise is 0.78, the slope for HP noise is 0.54.
Figure 6. BLDEL are shown for LP noise and HP noise as a function of the BLDEL for BB noise. Trend lines are added for clarity. Each marker represents a single subject.
The individual results substantiate that the mechanism responsible for the increased binaural summation has its major effect at the frequencies below 1400 Hz. A speculative hypothesis could be that hearing loss does not only lead to tonotopic reorganisation in the cochlea, but also leads to perceptual reorganisation at more central levels of the hearing system. Indications of tonotopic map changes in human auditory cortex following hearing loss have been shown (for a review see Eggermont Citation2017), and increases in central gain have also been postulated as a possible explanation for tinnitus and hyperacusis (i.e. Auerbach, Rodrigues, and Salvi Citation2014).
Reproducibility
Loudness matching yielded lower correlation coefficients for test–retest than loudness scaling. However, part of the differences can be explained by a shift in reference level in the loudness matching procedure between test and retest, as in the loudness matching procedure the reference levels were always based on the outcome of the corresponding loudness scaling measurement. The reference levels in the retest of the loudness matching procedure were therefore based on the levels of retest of the loudness scaling procedure. As the correlation between test and retest was not perfect in loudness scaling this introduced extra variability in the loudness matching procedure. Analysis of the correlation coefficients for conditions of loudness matching within the same test showed higher correlations that are well in agreement with the values found in loudness scaling. The intra-test correlation coefficients for the loudness matching procedure were better for the retest results than for the test results. This may indicate a learning effect for some subjects. The inter-test correlations between loudness scaling and loudness matching were excellent with an average correlation coefficient over the five conditions of 0.92 in both the test as well as the retest results. Taken together, the loudness matching procedure seems to provide reliable and reproducible results, that are well in agreement with the results of the loudness scaling procedure.
Clinical implications
This study clearly shows that hearing-impaired listeners can already perceive bilaterally presented broadband signals as loud at relatively low sound pressure levels (see ). If we want to ensure that hearing-impaired listeners aided with two hearing aids do not experience discomfort from loud sounds, we need to pay special attention to the effects of spectral and binaural loudness summation. Oetting et al. (Citation2018)presented a dynamic compressor considering the bandwidth of the input signal for the gain calculation. After narrow-band loudness compensation, they measured aided loudness functions for signals with different bandwidths. The deviations of these loudness functions from average normal-hearing loudness functions were used for gain corrections in the bandwidth-adaptive dynamic compressor. Normal loudness for natural signals with different bandwidths could be restored if these gain corrections were applied. The calculated gain corrections after narrowband loudness compensation showed large interindividual differences for binaural broadband signals
The current prescription rules ignore the variability in loudness perception between individual subjects. In the current data at a loudness level of 35 CU the level difference between the subject with the highest and lowest sensitivity was more than 25 dB. And this range increased further for loudness levels above 35 CU. This is in agreement with the findings from Formby et al. (Citation2017) who found loudness judgments within the same loudness category to vary across listeners by as much as 50–60 dB. Van Beurden et al. (Citation2018) found comparable ranges between lowest and highest levels judged to have equal loudness for international female noise and uniformly exciting noise of 17 Bark Bandwidth, presented unilaterally and bilaterally after narrowband loudness compensation. These data therefore show that loudness compensation based on narrowband measurements, does not guarantee that loudness for broadband signals will be well compensated as well.
As individual loudness functions for broadband signals cannot be predicted from narrowband measurements and differ for unilateral and bilateral presentation additional measurements are needed to assess spectral loudness summation and binaural loudness summation. Our results suggest that only adding a unilateral and bilateral measurement of a broadband signal, will not suffice to predict summation effects for all signals. Measurements of band pass filtered signals appear to be needed to provide detailed information. To determine an appropriate minimal set additional research is needed. As loudness scaling is fairly time consuming, a faster measurement procedure may be needed to make hearing aid fitting based on individual loudness perception clinically feasible. Loudness matching is shown to provide reliable results in approximately one-third of the time needed for the ACALOS-procedure.
The huge differences in loudness perception between hearing-impaired subjects for especially bilaterally presented broadband stimuli make it highly unlikely that one generic prescription rule will be able to predict an acceptable amplification for loud sounds for all hearing-impaired listeners. Hearing aid fitting should be based on individual loudness growth measures. Furthermore, the individual differences in spectral and binaural loudness summation and the interactions between these two make it highly unlikely that the current options to control the Maximum Power Output (MPO) of a hearing aid will provide enough flexibility to properly reduce the amplification at the upper part of the loudness scale. An adaptive compressor as proposed by Oetting et al. (2018) will be required to cope with the large individual differences.
Conclusions
The current study challenges some of the common assumptions on how loudness perception is altered by hearing loss. Bilateral presentation of a signal is usually assumed to increase loudness perception with a fixed amount regardless of the bandwidth of the signal. However, loudness perception measurements in this experiment clearly showed a different bandwidth dependency in bilateral presentation than in unilateral presentation. The results from a group of hearing-impaired listeners included in this study suggest that the low frequency part of the signal has a stronger contribution to the total loudness sensation than the high frequency part in bilateral presentation compared to unilateral presentation. This appears to be a consequence of more binaural loudness summation for the low frequency part of the spectrum than for the high frequency part.
Secondly, individual differences in loudness perception usually are not taken into account in hearing aid prescriptions. The current study however confirms that individual variability in loudness perception near LDLs is too large to ignore in hearing aid amplification. Measuring individual loudness perception for broadband and binaural signals should be considered in hearing aid fitting procedures. Which set of signals would be the best choice, needs to be investigated further. This study shows that loudness matching appears to be a reliable and time-efficient procedure to quickly measure loudness differences between signals with larger bandwidths and presentation modes (unilateral vs. bilateral).
Acknowledgements
The authors thank Addy Mols for her participation in the data collection and Stephan Ewert for providing the loudness matching procedure.
Disclosure statement
No potential conflict of interest was reported by the author(s).
Additional information
Funding
References
- Algom, D., A. Rubin, and L. Cohen-Raz. 1989. “Binaural and Temporal Integration of the Loudness of Tones and Noises.” Perception & Psychophysics 46 (2): 155–166. doi:10.3758/bf03204975..
- Anweiler, A. K., and J. L. Verhey. 2006. “Spectral Loudness Summation for Short and Long Signals as a Function of Level.” Journal of the Acoustical Society of America 119 (5): 2919–2928. doi:10.1121/1.2184224.
- Auerbach, B. D., P. V. Rodrigues, and R. J. Salvi. 2014. “Central Gain Control in Tinnitus and Hyperacusis.” Frontiers in Neurology 5 (5): 1–21. doi:10.3389/fneur.2014.00206.
- Bagatto, M., S. Moodie, S. Scollie, R. Seewald, S. Moodie, J. Pumford, and K. P. Liu. 2005. “Clinical Protocols for Hearing Instrument Fitting in the Desired Sensation Level Method.” Trends in Amplification 9 (4): 199–226. doi:10.1177/108471380500900404.
- Bisgaard, N., M. S. Vlaming, and M. Dahlquist. 2010. “Standard Audiograms for the IEC 60118-15 Measurement Procedure.” Trends in Amplification 14 (2): 113–120. doi:10.1177/1084713810379609.
- Bonding, P., and C. Elberling. 1980. “Loudness Summation across Frequency under Masking and in Sensorineural Hearing Loss.” International Journal of Audiology 19 (1): 57–74. doi:10.3109/00206098009072649..
- Boymans, M., S. T. Goverts, S. E. Kramer, J. M. Festen, and W. A. Dreschler. 2008. “A Prospective Multi-Centre Study of the Benefits of Bilateral Hearing Aids.” Ear and Hearing 29 (6): 930–941. doi:10.1097/AUD.0b013e31818713a8.
- Brand, T., and V. Hohmann. 2002. “An Adaptive Procedure for Categorical Loudness Scaling.” The Journal of the Acoustical Society of America 112 (4): 1597–1604. doi:10.1121/1.1502902.
- Cornelisse, L. E., R. C. Seewald, and D. G. Jamieson. 1995. “The Input/Output Formula: A Theoretical Approach to the Fitting of Personal Amplification Devices.” The Journal of the Acoustical Society of America 97 (3): 1854–1864. doi:10.1121/1.412980.
- Dillon, H. 2012. Hearing Aids Second Edition. Sydney, Australia: Boomerang Press. p. 226.
- Eggermont, J. 2017. “Acquired Hearing Loss and Brain Plasticity.” Hearing Research 343: 176–190. doi:10.1016/j.heares.2016.05.008.
- EuroTrak Germany 2018. Trends EuroTrak 2009-2015 & MT9 (USA). Accessed 9 September 2019. www.ehima.com.
- Ewert, S. D. 2013. AFC - a modular framework for running psychoacoustic experiments and computational perception models. 39 Tagung der Deutschen Arbeitsgemeinschaft für Akustik (DAGA).
- Ewert, S. D., and D. Oetting. 2018. “Loudness Summation of Equal Loud Narrowband Signals in Normal-Hearing and Hearing-Impaired Listeners.” International Journal of Audiology 57 (sup3): S71–S80. doi:10.1080/14992027.1380848.
- Florentine, M., and E. Zwicker. 1979. “A Model of Loudness Summation Applied to Noise-Induced Hearing Loss.” Hearing Research 1 (2): 121–132. doi:10.1016/0378-5955(79)90023-6.
- Florentine, M., S. Buus, and T. Poulsen. 1996. “Temporal Integration of Loudness as a Function of Level.” Journal of the Acoustical Society of America 99 (3): 1633–1644. doi:10.1121/1.415236.
- Formby, C., J. Payne, W. Yang, D. Wu, and J. M. Parton. 2017. “Repeated Measurement of Absolute and Relative Judgments of Loudness: clinical Relevance for Prescriptive Fitting od Aided Target Gains for “Soft”, “Comfortable”, and “Loud, but OK” Sound Levels.” Semin. Hear 38 (1): 26–52. doi:10.1055/s-0037-1598064.
- Franks, J. R., and N. J. Beckmann. 1985. “Rejection of Hearing Aids: Attitudes of a Geriatric Sample.” Ear and Hearing 6 (3): 161–166. doi:10.1097/00003446-198505000-00007.
- Garnier, S., C. Micheyl, P. Arthaud, C. Berger-Vachon, and L. Collet. 1999. “Temporal Loudness Integration and Spectral Loudness Summation in Normal-Hearing and Hearing-Impaired Listeners.” Acta Oto-Laryngologica 119 (2): 154–157. doi:10.1080/00016489950181567.
- Hawkins, D. B., R. A. Prosek, B. E. Walden, and A. A. Montgomery. 1987. “Binaural Loudness Summation in the Hearing Impaired.” Journal of Speech, Language, and Hearing Research 30 (1): 37–43. doi:10.1044/jshr.3001.37.
- Hickson, L., S. Clutterbuck, and A. Khan. 2010. “Factors Associated with Hearing Aid Fitting Outcomes on the IOI-HA.” International Journal of Audiology 49 (8): 586–595. doi:10.3109/14992021003777259.
- ISO 389-8 2004. Acoustics - Reference zero for the calibration of audiometric equipment.
- Jenstad, L. M., D. J. Van Tasell, and C. Ewert. 2003. “Hearing Aid Troubleshooting Based on Patients’ Descriptions.” Journal of the American Academy of Audiology 14 (7): 347–360. doi:10.1055/s-0040-1715754.
- Joshi, S. N., M. Wróblewski, K. K. SChmid, and W. Jesteadt. 2016. “Effects of Relative and Absolute Frequency in the Spectral Weighting of Loudness.” Journal of the Acoustical Society of America 139 (1): 373–383. doi:10.1121/1.4939893.
- Kamm, C., D. D. Dirks, and M. R. Mickey. 1978. “Effects of Sensorineural Hearing Loss on Loudness Discomfort Level and Most Comfortable Loudness Judgments.” Journal of Speech and Hearing Research 21 (4): 668–681. doi:10.1044/jshr.2104.668.
- Keidser, G., H. Dillon, M. Flax, T. Ching, and S. Brewer. 2011. “The NAL-NL2 Prescription Procedure.” Hearing Research 1 (1): 88–90. doi:10.4081/audiores.2011.e24.
- Keidser, Gitte, Harvey Dillon, Lyndal Carter, and Anna O'Brien. 2012. “NAL-NL2 Empirical Adjustments.” Trends in Amplification 16 (4): 211–223. doi:10.1177/1084713812468511.
- Kochkin, S. 2000. “MarkeTrak V: “Why My Hearing Aids Are in the Drawer”: the Consumers’ Perspective.” Hearing Journal 53 (2): 34–41. doi:10.1097/00025572-200002000-00004.
- Kochkin, S. 2009. “MarkeTrak VIII: 25-Year Trends in the Hearing Health Market.” Hearing Review 16: 12–31.
- Levitt, H. 1971. “Transformed UP-DOWN MEthods in Psychoacoustics.” The Journal of the Acoustical Society of America 49 (2B): 467–477. doi:10.1121/1.1912375.
- Moore, B. C. J., A. Gibbs, G. Onions, and B. R. Glasberg. 2014. “Measurement and Modeling of Binaural Loudness Summation for Hearing-Impaired Listeners.” Journal of the Acoustical Society of America. 136 (2): 736–747. doi:10.1121/1.4889868.
- Moore, B. C. J., and B. R. Glasberg. 2004. “A Revised Model of Loudness Perception Applied to Cochlear Loss.” Hearing Research 188 (1-2): 70–88. doi:10.1016/S0378-5955(03)00347-2.
- Mueller, H. G. 2003. “Fitting Test Protocols Are More Honored in the Breach than in the Observance.” The Hearing Journal 56 (10): 19–26. doi:10.1097/01.HJ.0000292915.14697.f3.
- Nelson, P. B., T. T. Perry, M. Gregan, and D. J. Van Tasell. 2018. “Self-Adjusted Amplification Parameters Produce Large between-Subject Variability and Preserve Speech Intelligibility.” Trends Hear 22: 1–13. doi:10.1177/2331216518798264.
- Oberfeld, D., W. Heeren, J. Rennies, and J. Verhey. 2012. “Spectro-Temporal Weighting of Loudness.” PLoS One 7 (11): e50184. doi:10.1371/journal.pone.0050184.
- Oetting, D., V. Hohmann, J. E. Appell, B. Kollmeier, and S. D. Ewert. 2018. “Restoring Perceived Loudness for Listeners with Hearing Loss.” Ear and Hearing 39 (4): 664–678. doi:10.1097/AUD.0000000000000521.
- Oetting, D., T. Brand, and S. D. Ewert. 2014. “Optimized Loudness-Function Estimation for Categorical Loudness Scaling Data.” Hearing Research 316: 16–27. doi:10.1016/j.heares.2014.07.003.
- Oetting, D., V. Hohmann, J.-E. Appell, B. Kollmeier, and S. D. Ewert. 2016. “Spectral and Binaural Loudness Summation for Hearing-Impaired Listeners.” Hearing Research 335: 179–192. doi:10.1016/j.heares.2016.03.010.
- Perry, T. T., P. B. Nelson, and D. J. Van Tasell. 2019. “Listener Factors Explain Little Variability in Self-Adjusted Hearing Aid Gain.” Trends Hear 23: 1–17. doi:10.1177/2331216519837124.
- Rasetshwane, D. M., R. R. High, J. G. Kopun, S. T. Neely, M. P. Gorga, and W. Jesteadt. 2018. “Influence of Suppression on Restoration of Spectral Loudness Summation in Listeners with Hearing Loss.” Journal of the Acoustical Society of America 143 (5): 2994–3008. doi:10.1121/1.5038274.
- Scharf, B. 1968. “Binaural Loudness Summation as a Function of Bandwidth.” In Y. Kohasi (Ed.), Reports of the 6th International Congress on Acoustics (Vol. I, 25–28). Tokyo: Marazen A-3-5.
- Scharf, B., and R. P. Hellman. 1966. “Model of Loudness Summation Applied to Impaired Ears.” The Journal of the Acoustical Society of America 40 (1): 71–78. doi:10.1121/1.1910066.
- Scollie, S., R. Seewald, L. Cornelisse, S. Moodie, M. Bagatto, D. Laurnagaray, S. Beaulac, and J. Pumford. 2005. “The Desired Sensation Level Multistage Input/Output Algorithm.” Trends in Amplification 9 (4): 159–197. doi:10.1177/1380500900403.
- Van Beurden, M. F. B., M. Boymans, M. van Geleuken, D. Oetting, B. Kollmeier, and W. A. Dreschler. 2018. “Potential Consequences of Spectral and Binaural Summation for Bilateral Hearing Aid Fitting.” Trends Hear 22: 1–15. doi:10.1177/2331216518805690.
- Verhey, J. L., A. K. Anweiler, and V. Hohmann. 2006. “Spectral Loudness Summation as a Function of Duration for Hearing-Impaired Listeners.” International Journal of Audiology 45 (5): 287–294. doi:10.1080/14992020500485692.
- Verhey, J. L. 1999. Psychoacoustics of spectro-temporal effects in masking and loudness perception. BIS-Verlag, Oldenburg, ISBN 3-8141-0662-2, http://docserver.bis.uni-oldenburg.de/publikationen/bisverlag/verpsy99/verspy99.html.
- Verhey, J. L., and B. Kollmeier. 2002. “Spectral Loudness Summation as a Function of Duration.” Journal of the Acoustical Society of America 111 (3): 1349–1358. doi:10.1121/1.1451065.
- Zwicker, E., and, U. T. Zwicker. 1991. “Dependence of Binaural Loudness Summation on Interaural Level Differences, Spectral Distribution, and Temporal Distribution.” Journal of the Acoustical Society of America 89 (2): 756–764. doi:10.1121/1.1894635.
- Zwicker, E., G. Flottorp, and S. S. Stevens. 1957. “Critical Bandwidth in Loudness Summation.” Journal of the Acoustical Society of America. 29 (5): 548–557. doi:10.1121/1.1908963.