
Abstract
Objective
Despite the positive effect of a cochlear implant (CI) on tinnitus in many patients, tinnitus remains a problem for a significant proportion of CI users. We investigated the acceptability and effect of sound therapy (a combination of natural background sounds and one concise tinnitus counselling session) on tinnitus and speech perception in CI users who still experienced tinnitus during CI use.
Design and study sample
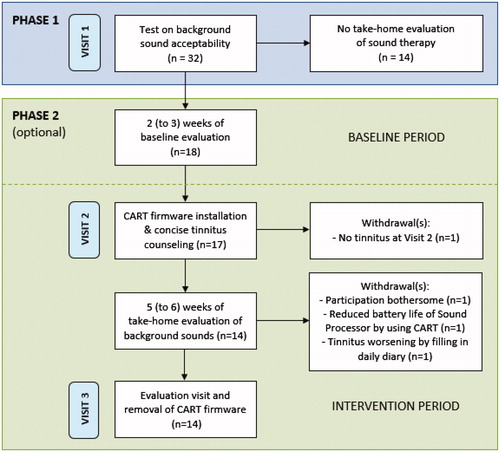
Thirty-two CI users (32–78 years) participated in phase 1: a test at the clinic to evaluate six background sounds provided by the sound processor. Eighteen out of the 32 CI users participated in phase 2: an optional take-home evaluation of 2 weeks without sound therapy, followed by 5 weeks with sound therapy, ending with an evaluation visit.
Results
Thirty subjects (93.8%) found at least one background sound acceptable. In phase 2, a small improvement with sound therapy was found for tinnitus loudness, annoyance, and intrusiveness. 50% of the subjects subjectively reported benefit of sound therapy. Especially the sense of control on their tinnitus was highly appreciated. No detrimental effect on speech perception was observed.
Conclusion
The background sounds were acceptable and provided tinnitus relief in some CI users with tinnitus during CI use.
Introduction
Subjective tinnitus is the perception of a sound without an acoustic stimulus, generally perceived as a ringing or buzzing sound (Baguley, McFerran, and Hall Citation2013). Prevalence estimates in studies vary widely due to the use of different tinnitus definitions and populations (McCormack et al. Citation2016). Most studies report a prevalence of 10–15% in adults (Baguley, McFerran, and Hall Citation2013; Henry, Dennis, and Schechter Citation2005). In about 1–3% the experienced tinnitus is severe, which can lead to a significant decrease in quality of life (Chari and Limb Citation2018; Davis and El Refaie Citation2000).
Treatment options for tinnitus
So far, no evidence based curative treatment has been found for tinnitus. Tinnitus relief and improvement of quality of life is the highest achievable goal for most tinnitus patients with current treatment modalities (Chari and Limb Citation2018; Hoare et al. Citation2011). Many treatments options are based on a psychological approach, such as counselling, psychoeducation, and cognitive behavioural therapy (CBT) (Chari and Limb Citation2018; Cima et al. Citation2012; Hoare et al. Citation2011; Martinez-Devesa et al. Citation2010).
Another treatment option is auditory stimulation with hearing aids or sound therapy (Hoare et al. Citation2014; Sherlock and Eisenman Citation2020; Tunkel et al., 2014). Sound therapy is well established in tinnitus patients with any (aided or unaided) degree of hearing loss. Used strategies and stimuli vary widely, from background noises and relaxation sounds, to broadband or narrowband stimuli for total or partial masking of the tinnitus (Hobson, Chisholm, and El Refaie Citation2012; Sereda, Davies, and Hall Citation2017; Sherlock and Eisenman Citation2020). Also more tailored forms such as notched sound therapy (with the frequency of tinnitus removed from the sound stimulus) or sound therapy in combination with extensive long-term counselling in tinnitus retraining therapy have been used (Chari and Limb Citation2018; Jastreboff and Hazell Citation2004; Phillips and McFerran Citation2010).
Auditory stimulation can also be electrically provided by a cochlear implant (CI). So far, the benefit of a CI on tinnitus is mainly studied in patients receiving their implant because of severe to profound hearing loss (Ketterer et al. Citation2020; Peter et al. Citation2019; Ramakers et al. Citation2015, Citation2017). In these studies, a decrease in tinnitus burden or even complete suppression of tinnitus has been demonstrated, with only a minimal risk of inducing tinnitus (Peter et al. Citation2019; Ramakers et al. Citation2015). Nevertheless, over 50% of CI users are still aware of their tinnitus (Arts et al. Citation2015; Gomersall, Baguley, and Carlyon Citation2019; Pierzycki et al. Citation2016), and about 25% of CI users experience troublesome tinnitus (Baguley Citation2010). Interestingly, it is reported that a substantial amount of unilaterally implanted patients with bilateral hearing loss reported their tinnitus to be their primary concern after implantation (Gomersall, Baguley, and Carlyon Citation2019). Besides this, the presence of tinnitus during CI use can complicate the CI programming: patients can confuse their tinnitus with CI stimulation or are afraid of tinnitus worsening by “loud” CI stimulation. (Pierzycki et al. Citation2019).
Sound therapy for CI users with tinnitus
Those CI recipients who still experience tinnitus during CI use may benefit from sound therapy. Vernon (Citation2000) was the first to describe the use of background stimuli in a CI user with persistent tinnitus. Seven different noise bands, developed for tinnitus masking, were acoustically presented to the microphone of the sound processor. One background noise completely masked the tinnitus of the patient in the CI ear (Vernon Citation2000).
More recently, Tyler et al. (Citation2015) performed a trial in seven CI users with mixed background stimuli installed on a sound device (MP3 player), connected to the CI via a cable. Accordingly, in a study with 16 CI users, various tinnitus therapy sounds were streamed to the CI with the ReSound Relief application (version 3.0, GN ReSound, Bloomington, MN, USA), developed for individuals with acoustic hearing (Tyler et al. Citation2018). In both studies, the results showed that the use of tinnitus therapy sounds was acceptable for CI users and provided relief for some tinnitus sufferers (Tyler et al. Citation2015, Citation2018). No subject reported a decrement in speech perception, but the authors mentioned this should be tested in future research (Tyler et al. Citation2015). Potentially, the background stimuli could mask the environmental sounds and speech, leading to decreased hearing benefits of the CI. Therefore, new sound therapy strategies specifically for CI users have to be developed, without interfering with hearing capabilities as primary goal.
In this study we applied a sound therapy strategy with natural background sounds produced directly within the sound processor of the CI, using the ‘Cochlear™ Active Relief from Tinnitus’ (CART) algorithm, and one concise tinnitus counselling session. Our aim was to investigate the acceptability and the effect of this sound therapy on tinnitus and speech perception in adult CI users who still experience tinnitus during CI use.
Materials and methods
Two Dutch CI centres, the Maastricht University Medical Centre+ (MUMC+) and the University Medical Centre Utrecht (UMCU), participated in the study. This two-centre clinical trial was approved by the Ethics Committee of the academic hospital Maastricht/Maastricht University (approval No. NL58657.068.17) and was performed in accordance with the Declaration of Helsinki (version 2013, Fortaleza) and the Medical Research Involving Human Subjects Act (WMO). The study was registered on ClinicalTrials.gov with registration number NCT03026829 and is reported according to the STROBE statement for cohort studies (von Elm et al. Citation2007). All subjects gave written informed consent before participation.
Study population
The aim was to explore the use of sound therapy in daily life in 20 subjects. We anticipated that about 40% of the enrolled subjects would choose to participate in the take-home evaluation and therefore we aimed to include a total of 50 subjects. Subjects who previously reported tinnitus during CI use at a visit to one of the participating centres were recruited between 3 October 2017 and 24 January 2019.
Subjects could participate in the study if they were (1) adults (≥18 years old) with (2) self-reported tinnitus for at least one month during CI use and (3) at least three months of use of a CochlearTM implant driven by a Nucleus® 6 sound processor at the time of participation. In the case of bilateral use, the most recently activated CI had to be used for at least three months. Exclusion criteria were (1) pulsatile or diagnosed objective tinnitus, (2) comorbidities that would prevent participation in evaluations, (3) a history of psychiatric disorders or depression, and (4) unrealistic expectations as identified by the clinician on the part of the subject regarding the possible benefits, risks, and limitations that are inherent to the study.
Study design
The study was conducted as a prospective, single-arm clinical trial including within-subject repeated measures in which each subject served as his/her own control. Blinding towards the sound therapy was not feasible as it included counselling and fitting of the experimental sounds. These background sounds were perceived by the participants. The study consisted of two phases (with a maximum of three visits) with a total duration of seven to eight weeks (). The scope of phase 1 was to identify acceptability and short-term tinnitus reduction for six natural background sounds: ‘Shoreline’, ‘Beach Surf’, ‘Breaking Waves’, ‘Calming Waves’, ‘Ocean’, and ‘Water Creek’. These sounds were derived from real recordings of water-based scenes. They were selected based on typical background sounds commonly used for tinnitus relief via acoustic stimulation, and patient feedback, as reported in literature (e.g., Tyler et al. Citation2015, Citation2018). The scope of phase 2 (which was optional for participants) was to investigate the efficacy of sound therapy in providing tinnitus relief in daily life. The tinnitus relieving effects were tested against a baseline period without sound therapy to control for potential fluctuations over time. Subjects participating in phase 2 were asked to stop any other tinnitus intervention at least one week prior to and during the trial to avoid potential confounding.
Figure 1. Flowchart of the study. Phase 2 was optional and included a baseline period (without sound therapy) of at least 2 weeks with a maximum duration of 3 weeks, followed by a take-home evaluation (with sound therapy) of at least 5 weeks with a maximum duration of 6 weeks. CART: Cochlear™ Active Relief from Tinnitus.
Sound therapy
The sound therapy provided in phase 2 was a combination of the natural background sounds and one concise tinnitus counselling session. Tinnitus counselling was provided by the clinician in approximately 10 min at the first visit in phase 2. It included an explanation on the pathophysiology of tinnitus, tinnitus coping strategies, and the provided sound therapy. Subsequently, experimental firmware with the CART algorithm was installed on the commercially available Nucleus® 6 sound processor and CR230 remote control of the participants, which allowed for background stimulation simultaneous with standard CI use, without the need for any streaming device. The background sounds were introduced into the sound processing path, subsequent to a group of pre-processing steps including noise reduction, signal enhancement, and gain adjustment. This CART algorithm assured accurate and undistorted sound processing of the background sound and kept the electrical stimuli within the electrode map levels set by the audiologist during fitting of the CI system, when the participant adjusted the volume of the background sound.
Study procedures
Phase 1: At visit 1, subject demographics and tinnitus characteristics (including the effect of wearing the CI on tinnitus loudness and annoyance) were collected using a custom tinnitus questionnaire. Detection thresholds, minimum tinnitus masking levels, comfortable levels for continuous daily use, and maximum comfortable levels were identified for the six background sounds. Subjects were asked to describe the nature of the background sounds, which was not disclosed during the test. After this test, subjects were asked whether they were willing to continue participation in an evaluation of sound therapy in daily life (phase 2). If they decided not to participate in phase 2, their participation in the study ended.
Phase 2: For subjects that decided to continue their participation, a control condition of two weeks without sound therapy followed. During these two weeks, baseline measurements were collected on tinnitus loudness and annoyance, and the effect of tinnitus on daily life, using a paper diary. A Visual Analogue Scale (VAS, CitationFigueiredo, De Azevedo, and Oliveira 2009) on tinnitus loudness and annoyance (scored from 0 (‘not at all’) to 10 (‘extremely’)) was completed once a day before going to sleep. Secondly, the Tinnitus Functional Index (TFI) questionnaire was completed after the first and second week. The TFI questionnaire contains 25 questions for eight domains: intrusiveness, reduced sense of control, cognitive interference, sleep disturbance, auditory difficulties attributed to tinnitus, interference with relaxation, reduced quality of life, and emotional distress (Meikle et al., Citation2012; Rabau, Wouters, and Van de Heyning Citation2014). An overall TFI score of 0 to 100 can be calculated, where a total score higher than 53 indicates severe tinnitus burden. A clinically relevant reduction is characterised by a decrease of 13 points or more (Meikle et al., Citation2012).
The baseline period (without sound therapy for two to three weeks) was followed by the intervention period (with sound therapy for five to six weeks), starting with visit 2. During this visit, tinnitus characteristics were scored with a custom tinnitus questionnaire including tinnitus pitch, duration, and intrusiveness in different sound environments. Subsequently, the participant received the concise, one-session tinnitus counselling. Next, the clinician installed the experimental CART firmware on the participant’s sound processor and remote control. One to four background sounds were installed for take-home evaluation, based on the outcomes of the test at visit 1 and in agreement with participant's preference. Training on the use of the CART application was provided by the clinician at the end of the visit.
The participant tested each installed background sound for three days, keeping that specific sound active for the whole day. If multiple background sounds were chosen, the participant was asked to alternate on a daily basis the chosen sounds. The subject was free to adjust the volume of the sound to a comfortable level, from 0 (minimal audible level) to 20 (maximum level), with a linear distribution of the sound level amongst the CI user’s electrical Dynamic Range. No instructions were provided regarding partial or total masking of the tinnitus. When each selected background sound had been evaluated for three days, the participant could choose freely whether to use the installed background sounds or not until the third visit. Participants received a paper diary and were asked to complete the VAS on tinnitus annoyance and tinnitus loudness on a daily basis (before going to sleep) and the TFI questionnaire on a weekly basis.
After five weeks, the final (i.e. evaluation) visit took place. The electronic datalogs were extracted from the sound processor and remote control, containing information on the participant’s general CI and sound therapy use. Tinnitus characteristics were scored again with the custom tinnitus questionnaire, including participant’s subjective benefit of sound therapy. The usability of the CART user interface was assessed with a usability questionnaire. Speech perception in quiet at 65 and 50 dB SPL was tested with the background sound off and on at the participant’s preferred volume level (). For this, an open-set Dutch consonant-vowel-consonant (CVC) monosyllabic words (Bosman and Smoorenburg Citation1995) in a free-field-condition was used in a sound-treated booth. At the end of this visit, the experimental CART firmware was removed from the sound processor and remote control, which subsequently were reset to the conventional mode of the participant. If participants liked the sound therapy, we advised them to use an app on their smartphone for streaming background sounds to their CI.
Table 2. Background sound use in phase 2.
During the study and at all visits, adverse event interrogation was performed.
Outcome measures
Main outcome measures were (1) VAS on tinnitus loudness and annoyance without sound therapy (i.e. baseline period in phase 2) and with sound therapy (i.e. intervention period in phase 2), (2) the TFI overall score without sound therapy and with sound therapy, (3) duration of CI and background sound use, extracted from the electronic datalogs, and (4) demographic data.
Secondary outcome measures were (1) subjects’ ratings on the acceptability of the background sounds (preferred volume setting and VAS score on acceptability), (2) speech perception scores (% correctly repeated phonemes) in quiet at 65 and 50 dB SPL with the most preferred background sound off and on, (3) reported (serious) adverse events during the study, and (4) subjects’ feedback on usability of the CART user interface including a 5-point Likert-scale ranging from ‘strongly disagree’ to ‘strongly agree’ (Likert Citation1932).
Statistical analysis
Data was checked on normal distribution with the Shapiro-Wilk test and Q-Q plots. Since none of the outcome variables were normally distributed, non-parametric tests were used. Subjects that withdrew from the study were considered as failure of the sound therapy and were excluded from the analysis if no data was recorded for the baseline period (without sound therapy) and/or the intervention period (with sound therapy) in phase 2. Subjects with incomplete data sets for either daily VAS scores or weekly TFI scores were included, with the mean score taken of the available data (missing data in the analysis of the baseline period: VAS 0.5%, TFI 0.7%; in the intervention period: VAS 3.5%, TFI 3.2%).
For the VAS on tinnitus annoyance and loudness, individual scores were averaged across days for the baseline and intervention period separately. Individual TFI scores were averaged across weeks in a similar way. Individual benefit of sound therapy was defined as an improvement in the VAS and/or TFI score between the baseline and intervention period. Averaged VAS and TFI scores of the baseline period (without sound therapy) and intervention period (with sound therapy) in phase 2 were compared using the Wilcoxon signed-rank test. A Spearman’s correlation coefficient was computed for correlations between TFI and VAS scores without and with sound therapy. Demographic factors including tinnitus characteristics, the effect of wearing the CI on tinnitus loudness and annoyance, and CI performance (CVC scores in quiet at 65 dB SPL) were collected to investigate subpopulations, for which we used logistic regression analysis and a chi-square test.
Descriptive statistics were used for the secondary outcome measures. For speech perception, scores with the background sound off and on were compared with the Wilcoxon signed-rank test. A statistically significant result was defined as a p-value < 0.05. The Bonferroni correction was applied for multiple testing. Statistical analyses were performed using SPSS software (version 25, IBM Corp., Armonk, NY, USA).
Results
Subject demographics
A total of 32 subjects (16 at each study site) consented to take part in phase 1 of the study (). See for subject demographics. Nineteen men and 13 women participated with a mean age of 62 years (SD = 13, range 32–78 years). Mean onset of hearing loss was 24 years (SD = 20, range 0–64 years) and mean duration of CI experience was 8 years (SD = 6, range 1–21 years).
Table 1. Subject demographics.
29 out of 32 subjects (90.6%) reported having tinnitus prior to receiving a CI. In agreement with the inclusion criteria, all subjects reported to have tinnitus when wearing the CI in the month prior to participation. Though, the effect of wearing the CI on tinnitus could fluctuate in participants over time. Regarding the subjective overall effect, ten subjects (31.3%) reported that tinnitus became less loud when wearing the CI, and disappeared most of the time in two subjects (6.3%). In 16 subjects (50.0%) there was no change in tinnitus loudness, and in four subjects (12.5%) tinnitus was louder while wearing the CI. Regarding tinnitus annoyance, five subjects (15.6%) reported no annoyance at all when wearing the CI. Twelve subjects (37.5%) were more comfortable when wearing the CI, and ten subjects (31.3%) experienced no effect on tinnitus annoyance. Five subjects (15.6%) reported more tinnitus annoyance when wearing the CI.
Main outcome measures
Acceptability of background sounds and take-home evaluation
In phase 1 of the study, 30 out of the 32 subjects (93.8%) found at least one background sound acceptable at their preferred volume (VAS ≥5.0 on a scale of 0 to 10). Nineteen (58.4%) subjects found all six background sounds acceptable. Eighteen out of the 32 subjects (56.3%) proceeded to phase 2. Most subjects who chose not to proceed with phase 2 expected that sound therapy would not have an effect on their tinnitus in daily life or that further participation would be too burdensome.
In phase 2, four out of 18 subjects withdrew from the study or did not complete the required measures with sound therapy in the take-home evaluation (for reasons see ). So, 14 subjects fully completed phase 2 and were included in the analysis. The background sound ‘Water Creek’ was most frequently used (). Median duration of CI use per day was 15.1 h (range 5.5–17.0 h) with a median duration of background sound use of 6.9 h (range 1.3–12.8 h). Seven subjects out of 14 used sound therapy for more than 50% of the time when wearing the CI. Preferred volume levels were highly variable amongst the subjects (). Individual electronic datalogs showed no large deviations from the preferred volume level during the take-home evaluation (sometimes one or two volume levels above or below the preferred one).
VAS on tinnitus annoyance and loudness
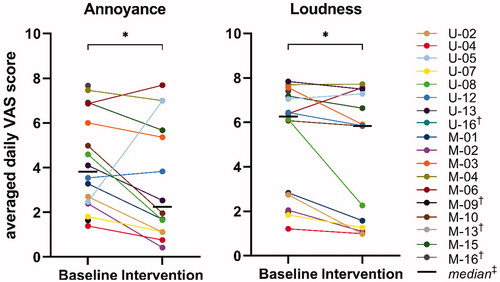
We found a statistically significant improvement in the VAS scores for tinnitus annoyance between the baseline period without sound therapy (Mdn = 3.8) and intervention period with sound therapy (Mdn = 2.2) (Wilcoxon signed-rank test, Z = −1.98, p = 0.049). There was also a small but significant improvement in the VAS scores for tinnitus loudness between baseline (Mdn = 6.3) and intervention (Mdn = 5.8) (Wilcoxon signed-rank test, Z = −2.42, p = 0.013).
Individual data showed that VAS scores for annoyance and loudness were reduced for 11 out of 14 subjects (78.6%, ). Three subjects showed an increase in annoyance (U-05, U-12 and M-06), which was very large for subject U-05 (from 2.5 to 7.3). Two of these subjects also showed an increase in VAS scores for loudness (U-05 and M-06). Noteworthy, the electronic datalogs revealed that subject U-05 did not use the background sounds at all in the intervention period. Subject M-04 experienced no change in tinnitus loudness, and subject U-08 had a large reduction in loudness (from 6.1 to 2.3).
Figure 2. VAS on tinnitus annoyance and loudness. Baseline = individual scores averaged across 2 weeks without use of sound therapy; Intervention = individual scores averaged across five weeks with use of sound therapy. *p < 0.05, †Participant withdrew from the study and did not complete phase 2 (no data of baseline and/or intervention period), ‡Calculated for the 14 participants that completed phase 2. VAS: Visual Analogue Scale.
Tinnitus functional index (TFI)
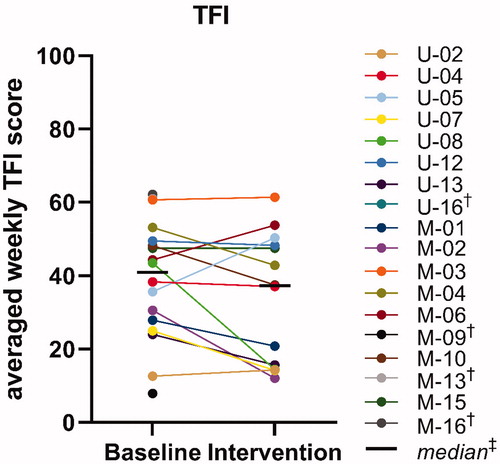
We found no statistically significant improvement in the total TFI scores between the baseline period without sound therapy (Mdn = 41) and intervention period with sound therapy (Mdn = 37) (Wilcoxon signed-rank test, Z = −1.92, p = 0.058). shows for each individual the averaged TFI scores in the baseline and intervention period. Ten out of 14 subjects (71.4%) had reduced TFI scores in the intervention period with sound therapy compared to baseline. For two subjects this reduction was clinically meaningful (≥13 points; U-08: 29 points and M-02: 19 points). One subject (M-15) reported the same total TFI scores for baseline and intervention. The other three subjects showed increased total TFI scores, including the two subjects that reported increased VAS scores for loudness and annoyance in the intervention period with sound therapy. This increase was clinically meaningful for one subject (U-05: 15 points), but the electronic datalogs revealed that this subject did not use the background sounds in the intervention period.
Figure 3. Tinnitus Functional Index (TFI). Baseline = individual scores averaged across two weeks without use of sound therapy; Intervention = individual scores averaged across five weeks with use of sound therapy. †Participant withdrew from the study and did not complete phase 2 (no data of baseline and/or intervention period), ‡Calculated for the 14 participants that completed phase 2.
Total TFI scores were significantly correlated with the VAS scores for loudness and annoyance, both at baseline (respectively: Spearman’s r = .55, p = 0.026, and r = .75, p = 0.001) and after intervention (respectively: Spearman’s r = .69, p = 0.007, and r = .80, p = 0.001).
Regarding the subscales of the TFI, we found a decrease in median scores between baseline and intervention for intrusiveness (15-point difference), reduced sense of control (8-point difference), and cognitive interference (10-point difference) (respectively: Wilcoxon signed-rank test, Z = −3.08, p = 0.002; Z = −1.98, p = 0.048; Z = −2.45, p = 0.014). For the other subscales (sleep disturbance, auditory interference due to tinnitus, interference with relaxation, impact on quality of life, and emotional distress) median scores were also lower with sound therapy than without, however, these differences were not statistically significant (respectively: Wilcoxon signed-rank test, Z = −0.16, p = 0.875; Z = −1.89, p = 0.059; Z = −1.82, p = 0.069; Z = −0.97, p = 0.330; Z = −0.28, p = 0.783). After Bonferroni correction for multiple testing of the eight subscales, only the reduction for intrusiveness showed to be statistically significant. Note that the small sample size of 14 subjects probably effected the statistical power required for the correction. Comparing individual results across subjects showed some variation in the results on the TFI subscales at baseline and intervention, particularly for the quality of life and emotional distress subscales. Again, results for subject U-05 stood out and were contrary to the results for the rest of the subjects. In the intervention period, scores on the subscales cognitive interference, interference with relaxation, and quality of life were much worse for this subject. As reported before, electronic datalogs of this subject revealed non-use of background sounds during the intervention period.
Demographic factors and success of sound therapy
No statistically significant relationship could be found using logistic regression analysis or a chi-square test between the subjectively reported success of sound therapy and any of the demographic factors or tinnitus characteristics in this study. Factors included were age at visit 1, gender, duration of hearing loss, duration of CI use, tinnitus location (ipsilateral, contralateral, bilateral), presence of tinnitus before CI, subjectively reported effect of CI on tinnitus loudness and annoyance, total TFI score, tinnitus pitch fluctuations, and CI performance.
Secondary outcome measures
Speech perception
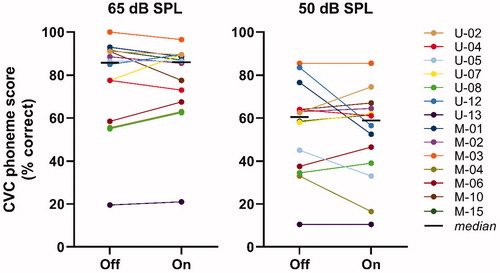
shows for each individual the speech perception scores in quiet with the background sound off and on. At 65 dB SPL, the median phoneme score was 85.8% with the background sound off, and 86.0% with participant’s most preferred background sound on. At 50 dB SPL, the median phoneme score was 60.5% with the background sound off, and 58.8% with the background sound on. The small differences between the scores with the background sound off and on were not statistically significant at 65 dB SPL (Wilcoxon signed-rank test, Z = −0.32, p = 0.770) or at 50 dB SPL (Z = −0.43, p = 0.693).
Figure 4. Speech perception in quiet was tested at 65 and 50 dB SPL with participant’s most preferred background sound off and on, using open-set Dutch consonant-vowel-consonant (CVC) monosyllabic words in a free-field-condition in a sound-treated booth.
Safety analysis
Four device deficiencies were reported: a reduced battery lifetime when using background sounds (n = 1), an unintended reset of the sound processor by the clinician during a visit (n = 2), and an occasion were the clinician was unable to unlock the CR230 remote control (n = 1). One adverse event at visit 1 was recorded, which was related to the background sound ‘Beach Surf’ (subject U-13). The sound induced an unpleasant sensation, whereas the other five background sounds did not. The unpleasant sensation disappeared immediately after turning off the background sound.
Interface usability and individual feedback
At visit 1, most subjects were not able to recognise the nature of the background sounds and described it as a murmurous, rhythmic sound, like the sound from a vacuum cleaner or car engine. Only a few participants recognised natural sounds, like running water from a stream, the shoreline, or the wind blowing through the trees.
At visit 3, subjects were asked to rate how easy it was to use the CART user interface, installed on the remote control, using a 5-point Likert scale (‘strongly disagree’ to ‘strongly agree’). Ten out of 14 subjects (strongly) agreed that the CART user interface was easy to use. Three subjects scored neutral, and one subject found it difficult to switch between the installed background sounds and to turn a background sound on or off.
50% (7/14) of the subjects who completed the take-home evaluation subjectively reported benefit on their tinnitus by the sound therapy (a combination of natural background sounds and one concise tinnitus counselling session). At least two subjects (U-01 and M-04) did not want the CART firmware to be uninstalled after study completion, which was required because it had no CE-mark.
Discussion
Despite the positive previously reported effect of a CI on tinnitus in a large group of hearing impaired patients (Ketterer et al. Citation2020; Peter et al. Citation2019; Ramakers et al. Citation2015, Citation2017), tinnitus remains a problem for a significant proportion of CI users (Gomersall, Baguley, and Carlyon Citation2019). Therefore, the aim of this study was to investigate the acceptability and the effect of sound therapy on tinnitus and speech perception in CI users who still experience tinnitus during CI use.
Acceptability of background sounds
Our results showed that the sound therapy we provided (a combination of natural background sounds and one concise tinnitus counselling session), was safe and easy to use. Almost all subjects (93.8%) found at least one out of the six background sounds acceptable to listen to at their preferred volume. In the take-home evaluation, the background sound ‘Water Creek’ was most frequently used, and median duration of sound therapy use was 6.9 h per day (62% of the median duration of daily CI use).
Acceptability of the sound is a key factor in establishing an effective sound therapy (Sereda, Davies, and Hall Citation2017). Tyler et al. (Citation2015) assessed acceptability of various mixed background stimuli (noise, sine waves, music, and natural sounds) in seven CI users. In line with our results, they found that preferences and acceptability of different sounds were highly variable between subjects. In another study, sounds perceived as rain, music, and waves were rated as most acceptable (Tyler et al. Citation2018). We also used natural sounds in our study, but most subjects did not recognise the nature of the sounds, which is in line with generally poor environmental sound discrimination with CI (Reed and Delhorne Citation2005). This is probably due to processing strategies of the sound processor and CI rehabilitation optimised for speech perception (Altieri Citation2017; Shafiro et al. Citation2015).
Effectiveness of sound therapy
Eighteen out of the 32 study participants proceeded to phase 2 of the study. The sound therapy was effective in reducing tinnitus for seven out of 14 subjects who completed the take-home evaluation. All the tinnitus outcomes (VAS on tinnitus loudness, VAS on tinnitus annoyance, and TFI) showed lower median scores when sound therapy was used. However, the median decreases were small and only statistically significant for the VAS on tinnitus annoyance (difference: 1.6) and tinnitus loudness (difference: 0.5), and the intrusiveness subscale of the TFI (difference: 15). In a recent study, Tyler et al. (Citation2018) also reported that sound therapy (without tinnitus counselling) provided relief for tinnitus sufferers with a CI. Thirteen subjects tested background sounds in a ‘2-week home trial’ using the ReSound Relief application (version 3.0) streamed from an AppleTM iPod to the CI (using a Cochlear™ Wireless Mini Microphone 2+). In all subjects, the post-trial tinnitus loudness rating was lower than the pre-trial rating (Tyler et al. Citation2018).
As expected, we found a wide variability in effectiveness between subjects, marked by individual differences in tinnitus outcomes. A clinically meaningful decrease in total TFI score was found in two out of 14 subjects in phase 2. One subject (U-05) stood out in all tinnitus outcomes and showed an increase in VAS on tinnitus loudness and tinnitus annoyance, and in TFI scores. However, after study completion, the analysis of the electronic datalogs of this subject revealed non-use of background sounds during the intervention period. Unfortunately, we could not find an explanation for this non-use, neither did the subject report any problems at the final study visit.
The goal of using sound therapy was not to suppress tinnitus, but rather to provide tinnitus relief. 34% (11/32) of the subjects went on to use sound therapy in daily life and benefit from it (defined as an improvement in VAS and/or TFI score). Recently, benefit from sound therapy (without counselling) was seen in 33% of the participants in a study with adults without hearing amplification with chronic, subjective tinnitus (Tyler et al. Citation2020). 50% of our subjects who completed the take-home evaluation subjectively reported benefit on their tinnitus by the sound therapy. Two subjects were not happy that they had to stop using the background sounds after study participation (because the CART firmware had no CE-mark). Based on individual feedback and results on the TFI subscales, we noted that some CI users with tinnitus highly appreciated the sense of control they experienced with sound therapy, even though decreases in VAS and TFI scores were not always clinically meaningful. In the study of Sereda, Davies, and Hall (Citation2017), participants with aided hearing impairment also reported that choice of tinnitus masking programs gave them a sense of control over their tinnitus. Because tinnitus patients usually do not have control over their tinnitus, this sense of control is an important aspect in providing tinnitus relief.
Sound therapy does not benefit all patients and it is not clear why some of them report that background noise makes their tinnitus worse, whereas others report that background noise makes their tinnitus better (Pan et al. Citation2015). Subjects with a flat audiogram configuration (rather than a gently or steeply high-frequency sloping audiogram), younger age, and higher tinnitus handicap inventory (THI) scores before sound therapy were found to have higher odds of having a positive treatment effect in one study (Cai et al. Citation2017). Unfortunately, we were not able to provide insight into the characteristics of responders to sound therapy due to the relatively small study sample.
Speech perception
In this study we found no detrimental effect of sound therapy provided by the sound processor of the CI on speech perception. By the lack of similar studies we were not able to compare these results to the literature. Though, the outcome is of upmost importance given the fact that CI users do need to rely on the primary function of the CI, which is to provide (improved) hearing. We measured speech perception at conversational speech levels in quiet (65 and 50 dB SPL) with the preferred background sound on and off. Even though quite high volume levels of 11 and 12 (on a scale of 0 to 20 with a linear distribution of the sound level amongst the electrical Dynamic Range) of background sounds were used by some subjects, it did not deteriorate speech perception scores. Also in previous studies, patients did not complain about reduced speech perception due to the sound therapy (Tyler et al. Citation2015). One CI user with tinnitus even experienced improved speech perception when using background noise (Vernon Citation2000). Furthermore, it has been shown that tinnitus reduction can improve speech perception (Mertens et al. Citation2013), but we did not find this phenomenon in our study. Tinnitus itself seems to have a relationship with speech perception, but whether it improves or deteriorates speech perception is still unclear (Ivansic et al. Citation2017; Jagoda et al. Citation2018; Oosterloo, Homans, and Goedegebure Citation2020; Zeng, Richardson, and Turner Citation2020).
Strengths of the study
To improve generalizability of the results, our in- and exclusion criteria did not comprise any tinnitus characteristics. So, we were able to examine the effect of sound therapy on tinnitus and speech perception in a heterogeneous group of CI users with tinnitus, even when tinnitus loudness or annoyance was low. This could, however, have an impact on the effect size.
The CART firmware was easy to install and to use in a clinical setting. The whole procedure of concise tinnitus counselling and testing of background sounds could be completed within one hour at visit 1. The firmware with the background sounds could be installed on the subject’s sound processor and controlled with the existing remote control, so no additional device for streaming was needed. We also used a single-subject design: each subject could choose its preferred sound(s) for take-home evaluation. Each sound had to be tested for three days (adjusting volume was allowed), but after that period, subjects were completely free to switch the background sounds on or off during the day for a few weeks, depending on their preferences. This allowed them to test sound therapy in specific situations, for example before going to sleep, and provided the highly appreciated individual control to the patient (Sereda, Davies, and Hall Citation2017; Tyler et al. Citation2015, Citation2018).
Limitations of the study
Several limitations of the study must be mentioned. There was no control group so the possibility that any benefits observed were due to the placebo effect cannot be ruled out. Blinding towards sound therapy was not feasible as it included counselling and fitting of the experimental background sounds which were perceived by the patients. Therefore, a baseline condition of two weeks without sound therapy was included in the study design to reduce potential bias. Due to the combination of counselling (provided in one session) and the use of background sounds, it was impossible to extract the effect of these components individually. However, this combination is clinically more applicable than providing background sounds alone. The phased nature of the study introduced a selection bias at the start of phase 2, as probably only subjects who liked background sounds agreed to proceed with the take-home evaluation. Lastly, the sample size (n = 36) was smaller than originally planned (n = 50) due to slower than expected recruitment. This reduced the power of the statistical analysis.
In retrospect, we conclude that our selected tinnitus outcomes measures were suboptimal for clinical use. One subject (M-09) reported worsening of tinnitus, due to the daily use of the tinnitus diary. A daily tinnitus diary forces subjects to pay attention to their tinnitus and it seems this could have a negative effect on providing tinnitus relief (Cima et al. Citation2019). Furthermore, we think that averaged VAS and TFI scores were not precise enough to measure the effect of sound therapy during the weeks of free background sound use (median duration of use was 6.9 h per day). For example, subject M-04 did not want to stop using sound therapy at the end of the study, because the subject perceived the background sounds as more pleasant than the tinnitus perception. However, this positive effect was not reflected in the VAS and TFI scores, as this subject had in general only a modest reduction in the VAS score on tinnitus annoyance and a small improvement on the TFI. Moreover, the VAS and TFI did not examine tinnitus in specific situations, for example before going to sleep or while reading a book (for which we obtained anecdotal evidence of sound therapy benefit). Hence, individual duration of sound therapy use (at specific situations) and subjective feedback remain important outcome measures.
Clinical implications and future research
This study investigated sound therapy in CI users and provided insight in sound selection, volume settings, and its use in different sound environments. The results are valuable for guidance in future trials or clinical use of any commercial application that can be used as an ‘add-on therapy’ for CI users with tinnitus, where the CI itself does not provide enough tinnitus reduction. Our results from CI users with tinnitus are comparable to other populations with tinnitus (e.g. hearing-impaired patients) and show that treatment for tinnitus relief is very individual and sound therapy is not effective for all. Currently, there is insufficient evidence for the effectiveness of sound therapy in controlled clinical trials to either support or refute the use of sound therapy for the treatment of tinnitus (Chari and Limb Citation2018; Hobson, Chisholm, and El Refaie Citation2012; Sereda, Davies, and Hall Citation2017; Sheppard et al. Citation2020). However, providing sound therapy has been classified as optional in a clinical guideline for tinnitus (Tunkel et al., 2014).
Sound therapy did provide significant benefit for some CI users with tinnitus and has a role to play in tinnitus treatment. It is important to understand that sound therapy can potentially be valuable in specific situations (e.g. before going to sleep, while reading a book, etc.) for which our measures were not sensitive enough to capture this. The possibility to use background sounds in specific situations potentially gives CI users with tinnitus a sense of control that helps them to get relief from tinnitus (Sereda, Davies, and Hall Citation2017), which may positively affect their quality of life.
Conclusion
Sound therapy for CI users with tinnitus is safe and easy to use. The background sounds were acceptable and provided tinnitus relief in some subjects. No detrimental effect on speech perception in quiet was observed. Individualised sound therapy designs are preferred as there is a high variability between subjects in effectiveness and acceptability of background sounds.
Acknowledgements
We want to thank Prof. Dr. R.S. Tyler and Prof. Dr. P. van Dijk, (former) members, of the American Tinnitus Association Scientific Advisory Committee, for their contribution to the early design of this study. Statistical support was provided by A.M.L. Janssen, statistician at the Department of Methodology and Statistics, Care and Public Health Research Institute, Maastricht University, Maastricht, The Netherlands.
Disclosure statement
K.A., M.K., and R.A. are employees at Cochlear Corporation. The other authors declare no conflict of interest.
Additional information
Funding
References
- Altieri, N. 2017. “Commentary: Environmental Sound Training in Cochlear Implant Users.” Frontiers in Neuroscience 11 (2): 36–14. doi:10.3389/fnins.2017.00036.
- Arts, R. A. G. J., T. Netz, A. M. L. Janssen, E. L. J. George, and R. J. Stokroos. 2015. “The Occurrence of Tinnitus After CI Surgery in Patients with Severe Hearing Loss: A Retrospective Study.” International Journal of Audiology 54 (12): 910–917. doi:10.3109/14992027.2015.1079930.
- Baguley, D. M. 2010. “New Insights into Tinnitus in Cochlear Implant Recipients.” Cochlear Implants International 11 (sup2): 31–36. doi:10.1179/146701010X12726366068616.
- Baguley, D., D. McFerran, and D. Hall. 2013. “Tinnitus.” The Lancet 382 (9904): 1600–1607. https://doi.org/10.1016/S0140-6736. (13)60142-7 doi:10.1016/S0140-6736(13)60142-7.
- Bosman, A. J., and G. F. Smoorenburg. 1995. “Intelligibility of Dutch CVC Syllables and Sentences for Listeners with Normal Hearing and with Three Types of Hearing Impairment.” Audiology : Official Organ of the International Society of Audiology 34 (5): 260–284. doi:10.3109/00206099509071918.
- Cai, Y., Q. Zhou, H. Yang, J. Jiang, F. Zhao, X. Huang, H. Mo, et al. 2017. “Logistic Regression Analysis of Factors Influencing the Effectiveness of Intensive Sound Masking Therapy in Patients with Tinnitus.” BMJ Open 7 (11): e018050. doi:10.1136/bmjopen-2017-018050.
- Chari, D. A., and C. J. Limb. 2018. “Tinnitus.” The Medical Clinics of North America 102 (6): 1081–1093. doi:10.1016/j.mcna.2018.06.014.
- Cima, R. F. F., I. H. Maes, M. A. Joore, D. J. W. W. Scheyen, A. El Refaie, D. M. Baguley, L. J. C. Anteunis, G. J. P. Van Breukelen, and J. W. S. Vlaeyen. 2012. “Specialised Treatment Based on Cognitive Behaviour Therapy versus Usual Care for Tinnitus: A Randomised Controlled Trial.” The Lancet 379 (9830): 1951–1959. https://doi.org/10.1016/S0140-6736. (12)60469-3 doi:10.1016/S0140-6736(12)60469-3.
- Cima, R. F. F., B. Mazurek, H. Haider, D. Kikidis, A. Lapira, A. Noreña, and D. J. Hoare. 2019. “A multidisciplinary European Guideline for Tinnitus: Diagnostics, Assessment, and Treatment.” HNO 67 (Suppl 1): 10–42. doi:10.1007/s00106-019-0633-7.
- Davis, A., and A. El Refaie. 2000. “The Epidemiology of Tinnitus.” In The Handbook of Tinnitus, edited by R. S. Tyler, 1–23. San Diego, CA: Singular Publishing Group.
- Figueiredo, R. R., A. A. De Azevedo, and P. D. M. Oliveira. 2009. “Análise da correlação entre a escala visual-análoga e o Tinnitus Handicap Inventory na avaliação de pacientes com zumbido.” Brazilian Journal of Otorhinolaryngology 75 (1): 76–79. doi:10.1016/S1808-8694(15)30835-1.
- Gomersall, P. A., D. M. Baguley, and R. P. Carlyon. 2019. “A Cross-Sectional Questionnaire Study of Tinnitus Awareness and Impact in a Population of Adult Cochlear Implant Users.” Ear and Hearing 40 (1): 135–142. doi:10.1097/AUD.0000000000000601.
- Henry, J. A., K. C. Dennis, and M. A. Schechter. 2005. “General Review of Tinnitus: Prevalence, Mechanisms, Effects, and Management.” Journal of Speech, Language, and Hearing Research : JSLHR 48 (5): 1204–1235. https://doi.org/10.1044/1092-4388. doi:10.1044/1092-4388(2005/084).
- Hoare, D. J., M. Edmondson-Jones, M. Sereda, M. A. Akeroyd, and D. Hall. 2014. “Amplification with Hearing Aids for Patients with Tinnitus and Co-existing Hearing Loss.” Cochrane Database of Systematic Reviews 1: 1–28. doi:10.1002/14651858.CD010151.pub2.
- Hoare, D. J., V. L. Kowalkowski, S. Kang, and D. A. Hall. 2011. “Systematic Review and Meta-Analyses of Randomized Controlled Trials Examining Tinnitus Management.” The Laryngoscope 121 (7): 1555–1564. doi:10.1002/lary.21825.
- Hobson, J., E. Chisholm, and A. El Refaie. 2012. “Sound Therapy (Masking) in the Management of Tinnitus in Adults.” Cochrane Database of Systematic Reviews 1: 1–22. doi:10.1002/14651858.CD006371.pub3.
- Ivansic, D., O. Guntinas-Lichius, B. Müller, G. F. Volk, G. Schneider, and C. Dobel. 2017. “Impairments of Speech Comprehension in Patients with Tinnitus-A Review.” Frontiers in Aging Neuroscience 9: 224–227. doi:10.3389/fnagi.2017.00224.
- Jagoda, L., N. Giroud, P. Neff, A. Kegel, T. Kleinjung, and M. Meyer. 2018. “Speech Perception in Tinnitus is Related to Individual Distress Level - A Neurophysiological Study.” Hearing Research 367: 48–58. doi:10.1016/j.heares.2018.07.001.
- Jastreboff, P. J., and J. W. P. Hazell. 2004. “Tinnitus Retraining Therapy.” In Implementing the Neurophysiological Model. Cambridge University Press. doi:10.1017/CBO9780511544989.
- Ketterer, M. C., S.-M. Häussler, T. Hildenbrand, I. Speck, D. Peus, B. Rosner, S. Knopke, S. Graebel, and H. Olze. 2020. “Binaural Hearing Rehabilitation Improves Speech Perception, Quality of Life, Tinnitus Distress, and Psychological Comorbidities.” Otology & Neurotology : Official Publication of the American Otological Society, American Neurotology Society [and] European Academy of Otology and Neurotology 41 (5): e563–e574. doi:10.1097/MAO.0000000000002590.
- Likert, R. 1932. “A Technique for the Measurement of Attitudes.” Archives of Psychology 22 (140): 5–55.
- Martinez-Devesa, P., R. Perera, M. Theodoulou, and A. Waddell. 2010. “Cognitive Behavioural Therapy for Tinnitus.” Cochrane Database of Systematic Reviews 1: 1–29. doi:10.1002/14651858.CD005233.pub3.
- McCormack, A., M. Edmondson-Jones, S. Somerset, and D. Hall. 2016. “A Systematic Review of the Reporting of Tinnitus Prevalence and Severity.” Hearing Research 337: 70–79. doi:10.1016/j.heares.2016.05.009.
- Meikle, M. B., J. A. Henry, S. E. Griest, B. J. Stewart, H. B. Abrams, R. McArdle, P. J. Myers, et al. 2012. “The Tinnitus Functional Index: Development of a New Clinical Measure for Chronic, Intrusive Tinnitus.” Ear and Hearing 33 (2): 153–176. doi:10.1097/AUD.0b013e31822f67c0.
- Mertens, G., A. K. Punte, D. De Ridder, and P. Van De Heyning. 2013. “Tinnitus in a Single-Sided Deaf Ear Reduces Speech Reception in the Nontinnitus Ear.” Otology and Neurotology 34 (4): 662–666. doi:10.1097/MAO.0b013e31828779f0.
- Oosterloo, B. C., N. C. Homans, and A. Goedegebure. 2020. “Tinnitus Affects Speech in Noise Comprehension in Individuals with Hearing Loss.” Otology & Neurotology : Official Publication of the American Otological Society, American Neurotology Society [and] European Academy of Otology and Neurotology 41 (9): e1074–e1081. doi:10.1097/MAO.0000000000002733.
- Pan, T., R. S. Tyler, H. Ji, C. Coelho, and S. A. Gogel. 2015. “Differences Among Patients That Make Their Tinnitus Worse or Better.” American Journal of Audiology 24 (4): 469–476. doi:10.1044/2015_AJA-15-0020.
- Peter, N., N. Liyanage, F. Pfiffner, A. Huber, and T. Kleinjung. 2019. “The Influence of Cochlear Implantation on Tinnitus in Patients with Single-Sided Deafness: A Systematic Review.” Otolaryngology-Head and Neck Surgery : Official Journal of American Academy of Otolaryngology-Head and Neck Surgery 161 (4): 576–588. doi:10.1177/0194599819846084.
- Phillips, J. S., and D. McFerran. 2010. “Tinnitus Retraining Therapy (TRT) for Tinnitus.” Cochrane Database of Systematic Reviews 3: 1–16. doi:10.1002/14651858.CD007330.pub2.
- Pierzycki, R. H., C. Corner, C. A. Fielden, and P. T. Kitterick. 2019. “Effects of Tinnitus on Cochlear Implant Programming.” Trends in Hearing 23: 2331216519836624–2331216519836615. doi:10.1177/2331216519836624.
- Pierzycki, R. H., M. Edmondson-Jones, P. Dawes, K. J. Munro, D. R. Moore, and P. T. Kitterick. 2016. “Tinnitus and Sleep Difficulties After Cochlear Implantation.” Ear and Hearing 37 (6): e402–e408. doi:10.1097/AUD.0000000000000341.
- Rabau, S., K. Wouters, and P. Van de Heyning. 2014. “Validation and Translation of the Dutch Tinnitus Functional Index.” B-Ent 10 (4): 251–258.
- Ramakers, G. G. J., V. J. C. Kraaijenga, Y. E. Smulders, A. van Zon, I. Stegeman, R. J. Stokroos, R. H. Free, et al. 2017. “Tinnitus After Simultaneous and Sequential Bilateral Cochlear Implantation.” Frontiers in Surgery 4: 65–68. doi:10.3389/fsurg.2017.00065.
- Ramakers, G. G. J., A. Van Zon, I. Stegeman, and W. Grolman. 2015. “The Effect of Cochlear Implantation on Tinnitus in Patients with Bilateral Hearing Loss: A Systematic Review.” The Laryngoscope 125 (11): 2584–2592. doi:10.1002/lary.25370.
- Reed, C. M., and L. A. Delhorne. 2005. “Reception of Environmental Sounds Through Cochlear Implants.” Ear and Hearing 26 (1): 48–61. doi:10.1097/00003446-200502000-00005.
- Sereda, M., J. Davies, and D. A. Hall. 2017. “Pre-Market Version of a Commercially Available Hearing Instrument with a Tinnitus Sound Generator: Feasibility of Evaluation in a Clinical Trial.” International Journal of Audiology 56 (4): 286–294. doi:10.1080/14992027.2016.1254822.
- Shafiro, V., S. Sheft, S. Kuvadia, and B. Gygi. 2015. “Environmental Sound Training in Cochlear Implant Users.” Journal of Speech, Language, and Hearing Research : JSLHR 58 (2): 509–519. doi:10.1044/2015_JSLHR-H-14-0312.
- Sheppard, A., C. Stocking, M. Ralli, and R. Salvi. 2020. “A Review of Auditory Gain, Low-Level Noise and Sound Therapy for Tinnitus and Hyperacusis.” International Journal of Audiology 59 (1): 5–15. doi:10.1080/14992027.2019.1660812.
- Sherlock, L. P., and D. J. Eisenman. 2020. “Current Device-Based Clinical Treatments for Tinnitus.” Otolaryngologic Clinics of North America 53 (4): 627–636. doi:10.1016/j.otc.2020.03.010.
- Tunkel, D. E., C. A. Bauer, G. H. Sun, R. M. Rosenfeld, S. S. Chandrasekhar, E. R. Cunningham, S. M. Archer, et al. 2014. “Clinical Practice Guideline: Tinnitus.” Otolaryngology-Head and Neck Surgery : Official Journal of American Academy of Otolaryngology-Head and Neck Surgery 151 (2 Suppl): S1–S40. doi:10.1177/0194599814545325.
- Tyler, R. S., A. J. Keiner, K. Walker, A. K. Deshpande, S. Witt, M. Killian, H. Ji, et al. 2015. “A Series of Case Studies of Tinnitus Suppression with Mixed Background Stimuli in a Cochlear Implant.” American Journal of Audiology 24 (3): 398–410. http://www.ncbi.nlm.nih.gov/pubmed/26001407. doi:10.1044/2015_AJA-15-0005.
- Tyler, R. S., R. L. Owen, J. Bridges, P. E. Gander, A. Perreau, and P. C. Mancini. 2018. “Tinnitus Suppression in Cochlear Implant Patients Using a Sound Therapy App.” American Journal of Audiology 27 (3): 316–323. doi:10.1044/2018_AJA-17-0105.
- Tyler, R. S., A. Perreau, T. Powers, A. Watts, R. Owen, H. Ji, and P. C. Mancini. 2020. “Tinnitus Sound Therapy Trial Shows Effectiveness for Those with Tinnitus.” Journal of the American Academy of Audiology 31 (1): 6–16. doi:10.3766/jaaa.18027.
- Vernon, J. A. 2000. “Masking of Tinnitus Through a Cochlear Implant.” Journal of the American Academy of Audiology 11 (6): 293–294.
- von Elm, E.,. D. G. Altman, M. Egger, S. J. Pocock, P. C. Gøtzsche, and J. P. Vandenbroucke. 2007. “The Strengthening the Reporting of Observational Studies in Epidemiology (STROBE) Statement: Guidelines for Reporting Observational Studies.” The Lancet 370 (9596): 1453–1457. https://doi.org/10.1016/S0140-6736. (07)61602-X doi:10.1016/S0140-6736(07)61602-X.
- Zeng, F. G., M. Richardson, and K. Turner. 2020. “Tinnitus Does Not Interfere with Auditory and Speech Perception.” The Journal of Neuroscience : The Official Journal of the Society for Neuroscience 40 (31): 6007–6017. doi:10.1523/JNEUROSCI.0396-20.2020.