
 ?Mathematical formulae have been encoded as MathML and are displayed in this HTML version using MathJax in order to improve their display. Uncheck the box to turn MathJax off. This feature requires Javascript. Click on a formula to zoom.
Abstract
Objective
To determine the relation between stapedius reflex thresholds in cochlear implant users evoked once through direct electric stimulation on single channels (ESRT) and once through acoustic stimulation in free sound field. For comparison, stapedius reflex thresholds were obtained in free sound field in a normal-hearing control group.
Design
For each participant a new ESRT-based fitting was created. Stapedius reflex thresholds were obtained for this new fitting in free sound field for different loudness adjustments. Acoustic stimuli for eliciting the stapedius reflex were narrow band noise signals covering the audiometric frequency range.
Study sample
N = 29 experienced CI users (34 ears) and N = 10 normal hearing listeners.
Results
ESRT-based fitting resulted in different stapedius reflex behaviour compared to normal-hearing listeners. A frequency dependence was observed. Stapedius reflex thresholds decreased with increasing centre frequencies of acoustic narrow band noise stimuli. A linear relation between upper stimulation levels on the implant channels and corresponding stapedius reflex thresholds evoked in free sound field was found.
Conclusion
The found correlation may be a guideline for adjusting the electrical dynamic range during cochlear implant fitting. This allows the implant system to mimic the natural reflex behaviour in the best possible way and potentially avoid overstimulation.
Introduction
Fitting cochlear implant systems
One of the most challenging aspects of rehabilitation after cochlear implantation is estimating the optimal electrical dynamic range of the cochlear implant (CI) system. In clinical practice, the minimum and maximum stimulation level of the electrical dynamic range are determined using psychoacoustic methods. This procedure works very well for cooperative patients who are able to assess loudness. However, some patients, such as very young children or patients with complex needs, are not able to give feedback on the loudness of stimuli. Beyond that, part of the adult patient cohort without handicap do have the ability to estimate loudness but indicate an electrical dynamic range that results in suboptimal fitting: When solely relying on psychoacoustic methods, some of the patients tend to indicate very high stimulation levels that result in overstimulation whereas others tend to indicate very low stimulation levels that result in understimulation. Overstimulation may lead to poorer speech understanding due to the associated spread of stimulation fields resulting in poorer pitch discrimination (Müller-Deile and Hey Citation2016). Understimulation may also deteriorate speech recognition because of a reduced electrical dynamic range. Both under- and overstimulation may be avoided by applying the method of stapedius reflex measurement. In CI patients, the stapedius reflex can be induced by electrical single-channel stimulation through the fitting software or by an acoustic stimulus in free sound field (presented through a loudspeaker in a room). For the latter, sound is recorded and processed by the audio processor prior to being transmitted to the inner ear as an electrical signal by the implant electrodes. In both cases, the stapedius reflex is registered as the change of the acoustic impedance of the eardrum, hence allowing postoperative application.
Electrically evoked stapedius reflex (ESRT)
The option to measure the electrically evoked stapedius reflex threshold (ERST) postoperatively by detecting the change of the acoustic impedance at the eardrum was first demonstrated in the late eighties for different CI-systems (Jerger et al. Citation1986; Stephan, Welzl-Müller, and Stiglbrunner Citation1988; Battmer, Laszig, and Lehnhardt Citation1990). It was shown that the postoperative reflex could be detected in 65% to 90% of CI patients (Battmer, Laszig, and Lehnhardt Citation1990; Cinar et al. Citation2011; Gordon, Papsin, and Harrison Citation2004). Further aspects of ESRT measurement were investigated in various studies, such as dynamic range and amplitude growth function of ESRT, or influence of stimulus duration or stimulation rate (Jerger, Oliver, and Chmiel Citation1988; Stephan, Welzl-Müller, and Stiglbrunner Citation1990; Stephan and Welzl-Müller 1994; Müller-Deile Citation2009). Others investigated the correlation between ESRT and other electrophysiological measurements, such as electrically evoked compound action potential (ECAP) or auditory brainstem response (EABR) (Gordon, Papsin, and Harrison Citation2004; Kosaner et al. Citation2018).
Several authors have discussed the use of ESRT to estimate the electrical dynamic range. Some investigated the correlation between ESRT and behaviourally determined maximum comfort level (MCL). Most authors found a positive correlation between ESRT and psychoacoustically determined MCL (Hodges et al. Citation1997; Shallop and Ash Citation1995; Stephan & Welzl-Müller 2000; Allum, Greisiger, and Probst Citation2002; Gordon, Papsin, and Harrison Citation2004; Kosaner et al. Citation2009; Walkowiak et al. Citation2011). Others found in Nucleus Cochlear implanted patients that ESRT underestimated or overestimated psychoacoustically determined MCL (Spivak and Chute Citation1994, Bresnihan et al. Citation2001). Other studies presented speech recognition scores of ERST based maps, showing that these were at least as good as the scores based on psychoacoustically determined maps (Kosaner et al. Citation2009; Spivak et al. Citation1994). Some authors presented ESRT-based fitting in children (Kosaner Citation2010; Gordon et al. Citation2012). Kosaner demonstrated the feasibility of this fitting method in children as well as the acceptance of, and performance with, ESRT-generated maps in children. Gordon et al. used ESRT to create balanced bilateral CI stimulation levels in children.
Regarding the development of the ESRT over time, one study shows that the ESRT at the time of first fitting is approximately 60% of the value achieved after 9–12 months and that it continuously increases in between (Seebacher Citation2014). Therefore, only patients with at least 10 months CI experience were included in this study.
Acoustically evoked stapedius reflex via free field stimulation (FF-SRT)
In order to avoid under- and overstimulation Müller-Deile & Hey proposed to measure the stapedius reflex threshold using acoustic stimulation in free sound field (Müller-Deile and Hey Citation2016). In their approach, stimulation levels of the CI system should be adjusted such that the reflex thresholds were between approximately 70 dB SPL and 90 dB HL, which is similar to typical reflex thresholds evoked through acoustic stimulation in normal-hearing subjects. Regarding audiological investigations during rehabilitation after cochlear implantation, the German Audiology Society recommends stapedius reflex measurement using both acoustic stimuli via free field and electrical single channel stimuli (Empfehlung der deutschen Gesellschaft für Audiologie Citation2018). There are various studies on ESRT in the literature, as described above, but no study was found investigating the acoustically evoked stapedius reflex in free sound field in CI patients.
This study
The present study investigated the elicitation of the postoperative stapedius reflex using both single channel electric stimulation when the CI was connected to the fitting system and using acoustic stimulation in free sound field when the patient was wearing the activated audio processor. The study aimed to scrutinise the relation between stapedius reflex thresholds evoked through single channel stimulation and corresponding stapedius reflex thresholds evoked in free sound field. This adds further knowledge about the impact of the electrical dynamic range on eliciting the stapedius reflex via a CI in free sound field. Furthermore, the stapedius reflex thresholds of CI patients were compared with those of a normal-hearing control group. Ultimately, such information may enable certain predictions of the CI system in the “daily use” condition. In particular, the fitting of the audio processor can be guided to reach the recommended target range of 70–90 dB HL for eliciting the stapedius reflex through the CI system in free sound field. Especially in specific cases, it might be helpful to know about the correlation between the change of the electrical dynamic range and the change of the resulting stapedius reflex thresholds in free sound field. For example, in patients whose stimulation levels are set too high (overstimulated) with reflex thresholds in free sound field well below 70 dB HL, the audiologist would be able to estimate the required change of the electrical dynamic range to reach reflex thresholds in the desired range.
Materials and methods
Subjects
A group consisting of 29 CI users (34 ears) participated in this study. This study was conducted according to the Declaration of Helsinki (2013) and approved by the local ethics committee (EK 368072019). Selection criteria of the patients with a CI were the following: at least ten months experience with their CI system and a functioning intact middle ear for stapedius reflex detection. presents the demographic and CI-specific details of the participants. All patients were supplied with MED-EL CI systems.
Table 1. CI-specific details for study group (FF-SRT measurement with NBN) and control group selected for comparison to normal-hearing listeners (FF-SRT measurement with NBN and WBN).
All participants used maps with the maximum stimulation rate. Most participants used biphasic pulses except for one bilaterally implanted subject exhibiting facial nerve co-stimulation and thus using triphasic pulses on both ears. The lowest frequency transmitted through the CI system ranged from 0.07 kHz to 0.1 kHz for all patients, except for two who had residual hearing in the low frequency region. One of these two patients uses an acoustic component for electric-acoustic stimulation with a crossover frequency of 0.375 kHz. The other one exhibits hearing threshold levels around 15 dB HL below 0.5 kHz using a map with lower frequency of 0.3 kHz. Accordingly, there is no need for using an acoustic component in this patient. The upper frequency limit was the default value of the CI system of 8.5 kHz in all subjects. The backend compression (MAPLAW) was set to the default value of 500 in all patients, with four exceptions using a MAPLAW of 300 (N = 1), 600 (N = 1) and 750 (N = 2). The number of active electrodes ranged from nine to twelve. The reduction of the number of active electrodes had different reasons: in most cases overall sound impression, co-stimulation of the facial nerve in one patient, and migration of the electrode array resulting in three electrodes located outside of the cochlea in another patient. With these adjustments of the CI system, the participants reached PTA4 (mean of hearing level at 0.5, 1, 2 and 4 kHz) values ranging from 22 to 53 dB HL, with a mean ± standard deviation of 39 ± 7 dB HL.
Normal-hearing control group
The control group consisted of ten normal hearing adults with a mean age of 37 years and an age range from 26 to 52 years. Each participant of the control group underwent otologic examination and audiometric testing. Pure tone hearing thresholds were obtained for all audiometric frequencies and the PTA4 average (mean of hearing level at 0.5, 1, 2 and 4 kHz) was calculated. Normal hearing was defined as a PTA4 value of less than 25 dB HL. Through this, natural age dependencies of human hearing thresholds were accounted for according to DIN-ISO7029. All participants included in the control group met these requirements.
Measurement procedure
Reflex detection
The stapedius reflex was detected by measuring the change of acoustic impedance using a eTymp USB tympanometer and the eAudio software (Biomed Jena). The probe tone frequency was 0.226 kHz and a sound pressure level of 85 dB SPL was adjusted when the probe was attached to a standardised 2ccm coupler. The eTymp tympanometer is equipped with a trigger input which enables precisely timed measurements of the impedance change in response to an electric stimulation burst. The input trigger signal can be driven by the fitting interface box or by the interface for acoustic stimulation. Thus, the stapedius reflex could be detected both when it was triggered by single channel stimulation and when it was evoked by acoustic stimulation of the entire CI system in free sound field. The standard position of the ear plug was ipsilateral. In case of irregular impedance morphology or a non-functioning middle ear, the ear plug was placed in the contralateral ear. In the normal-hearing controls, stapedius reflex measurement using acoustic stimulation via free sound field was sequentially performed in both ears. For this purpose, the ear plug was placed once in the right ear and once in the left ear. The effective stapedius reflex threshold was calculated as the mean of the thresholds obtained in both sides.
Electrically evoked stapedius reflex threshold – ESRT
The procedure for measuring the electrically evoked stapedius reflex (ESR) and for determining its threshold (ESRT) was similar to the procedure published by Stephan, Welzl-Müller, and Stiglbrunner (Citation1988). In brief, single channels of the CI were stimulated using the fitting task of the MAESTRO software. The stimulus duration was set to 500 ms. For threshold identification, an up and down stimulation procedure was used, and the threshold was estimated by the minimum stimulus amplitude at which a stimulus-correlated change in impedance was recorded. In order to check for reproducibility, at least two detection cycles were subsequently performed. An example of one detection cycle can be seen in . In this example, ESRT of increasing (ESRTup) stimulus level is equal to ESRT decreasing (ESRTdown) stimulus level amounting to 15.11 qu. In the cases which showed hysteresis (ESRTup > ESRTdown), the final ESRT was defined as the ESRTdown value. Apical, medial and basal electrodes were chosen to perform this up/down procedure. Electrodes 1,3,6,9, and 12 were selected as standard. If the reflex could not be detected, adjacent electrodes were selected.
Figure 1. Impedance change for a sequence of increasing and decreasing stimulus intensities (up/down procedure) according to Stephan and Welzl-Müller (2000). The number above each box indicates the stimulus level respectively [charge units qu]. Boxes highlighted in green indicate the impedance change due to the stapedius reflex. The ESRT could be first elicited (increasing stimulus intensity) and disappeared (decreasing stimulation intensity) at a stimulation charge of 15.11qu in this example.
![Figure 1. Impedance change for a sequence of increasing and decreasing stimulus intensities (up/down procedure) according to Stephan and Welzl-Müller (2000). The number above each box indicates the stimulus level respectively [charge units qu]. Boxes highlighted in green indicate the impedance change due to the stapedius reflex. The ESRT could be first elicited (increasing stimulus intensity) and disappeared (decreasing stimulation intensity) at a stimulation charge of 15.11qu in this example.](/cms/asset/5fbe4844-ecc7-40ef-839e-164f58f58641/iija_a_1866780_f0001_c.jpg)
Creating ESRT-based maps
The participants of the study were experienced CI users (with at least ten months CI experience) who had undergone several fittings of the audio processor based on psychoacoustic methods. In particular, the lower and upper limits of the electric stimulation, the THR and MCL levels, had been determined based on loudness scaling and loudness balancing in these earlier fitting sessions. For each channel of the implant, loudness scaling had been performed. In the present study, a new fitting was created for each patient in which upper stimulation levels (MCL levels) of the used map based on subjective loudness scaling were replaced by the estimated ESRT. The term "used map" refers to the map that had been used in everyday life up to the participation in this study. For electrodes that had not been tested by means of the above mentioned up/down procedure, ESRT based MCL levels were estimated by interpolation of neighbouring electrodes that had been tested. To verify the map, a sweep on the level of ESRT based MCL was performed across all electrodes from apical to basal and vice versa. During this sweep, the impedance change was measured again. If impedance change amplitudes of certain electrodes deviated from neighbouring ones, the ESRT measurement by means of the up/down procedure was repeated to also determine the ESRT of these electrodes. This increased the number of electrodes whose ESRT was determined by the up/down procedure in all cases. On average, the ESRT was determined using the up/down procedure on 8 electrodes and the values were estimated by interpolation on the remaining ones. Finally, the sweep was repeated to verify the final map, by means of similar amplitudes of impedance change.
Acoustically evoked stapedius reflex threshold through free field stimulation (FF-SRT) of activated CI systems
For measuring the stapedius reflex in free sound field, patients were seated in front of a loudspeaker with their audio processors switched on. The sound pressure level was calibrated for the patient’s position – one metre distance in front of the loudspeaker. The stapedius reflex was elicited using noise stimuli with a duration of 500 ms. Particular stimuli were narrow band noise (NBN) bursts with centre frequencies at 0.5, 1, 2 and 4 kHz and one wide band noise burst (WBN). The stimuli were provided by the Biomed Company, constructed from white noise and in compliance with the DIN EN ISO 389-4 standards.
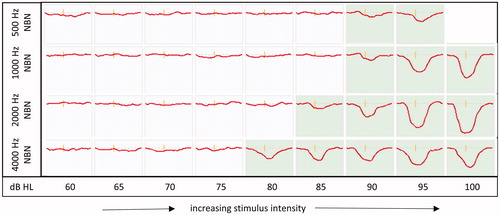
shows an example of free field stapedius reflex measurement in one CI patient. The four NBN stimuli were presented in free sound field at different sound levels, and the response in terms of the acoustic impedance change of the ear drum was recorded. Presentation levels ranged from 40 to 100 dB HL, except for the 0.5 kHz stimuli were the maximum presentation level was 95 dB HL. Sound levels were increased or decreased in 5 dB steps (typical audiometric accuracy). The audio processor of each patient was programmed with the ESRT based map, which was created through single channel ESR measurement as described above prior to the free field measurement. During free field measurement, pre-processing parameters of the audio processors were set equally in all study participants. In particular, the sensitivity was set at 75%, the volume at 100%, and the compression ratio at 3:1.
Figure 2. Measurement of free field stapedius reflexes of CI patients for NBN)with increasing stimulus intensities ranging from 65 dB HL to 95 dB HL for 0.5 kHz and ranging from 65 dB HL to 100 dB HL for 1, 2 and 4 kHz. The boxes show impedance change. Green highlighted boxes indicate the impedance change due to the stapedius reflex. The free field stapedius reflex threshold is 90, 90, 85 and 80 dB HL at frequencies 0.5, 1, 2 and 4 kHz.
All of the study participants underwent the tests with the NBN signals. In total ten individuals of the CI group were tested more extensively including WBN stimuli. This group served as a reference for comparison with the normal-hearing control group who also underwent the same more extensive test procedure.
Relation between electrical dynamic range and resulting change of acoustic reflex thresholds (FF-SRT)
To analyse the relation between the change of the maximum level of the electrical dynamic range (MCL) and the resulting change in the acoustic stapedius reflex threshold, progressive maps with successive decreasing and increasing MCL were created to measure resulting free field stapedius reflex thresholds (FF-SRTs). Based on an initial map that was based on ESRT measurement, one progressive map was created by decreasing the MCL globally (–6% step) and five progressive maps were created by increasing the MCL globally (+6% steps). FF-SRTs were determined twice for each map, the initial one and the progressive ones. For data evaluation, the mean value of measured stapedius reflex thresholds was determined for each patient. To participate in this test, patients needed to tolerate maps with very high levels because the levels in this test were increased by up to 30% of the dynamic range. Therefore, patients with MCL of the daily used map being significantly higher than the ESRT-based estimate of MCL were selected. This means that the MCL of the initial map of this test procedure was significantly lower than the MCL of the daily used map. Four patients were selected featuring mean FF-SRTs of 80, 62, 53 and 54 dB HL for NBN with centre frequencies of 0.5, 1, 2, and 4 kHz with the daily used map. As these patients are used to (too) high levels due to the daily use of the (overstimulated) map, they do tolerate increasing MCL by up to 30% of the dynamic range.
Data analysis and statistics
Artwork and linear regression were performed with OriginLab (Northampton, MA). For statistical analysis of the data, SPSS (SPSS Inc., Chicago, IL,USA) was used. For comparison of stapedius reflex thresholds obtained for NBN bursts with different centre frequencies, a Repeated Measures Analysis of Variance (RM ANOVA) with the factor “burst frequency” was performed. Subsequent Posthoc test using the Bonferroni correction was performed to reveal significant differences between “burst frequency” conditions. Since the maximum stimulus intensity of NBN with a centre frequency of 0.5 kHz is smaller compared to 1, 2, and 4 kHz (which results in missing data if the reflex threshold for 0.5 kHz is equal to 100 dB), the Repeated Measures Analysis of Variance (RM ANOVA) with subsequent Posthoc test was performed between centre frequencies of 1, 2, and 4 kHz.
To investigate the relationship between MCL change and change of FF-SRT, linear regression through the coordinate origin was performed, followed by a paired t-test between the slopes of neighbouring regression lines using the formula
with b1 and b2 being the slopes of regression lines and sb1 and sb2 being the standard errors.
Results
FF-SRTs of ESRT based maps
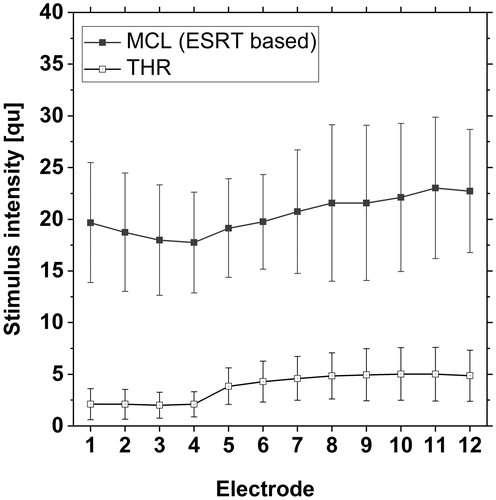
shows mean and standard deviation of the maximum (MCL) and minimum (THR) levels of the electrical dynamic range of ESRT-based maps (N = 34 ears) with MCL based on ESRT as desribed above and psychoacoustically determined THRs which remained unchanged compared to the used map. Mean ESRT-based MCL ranged between 18 qu to 23 qu. The estimated ESRT is higher for basal electrodes than for apical electrodes.
Figure 3. Mean and standard deviation of ESRT-based maps (N = 34 patients) with maximum level of the electric dynamic range (MCL) = based on ESRT estimation and psychoacoustically determined THRs, which remained unchanged compared to the used map.
Stapedius reflex thresholds obtained in free sound field using NBN bursts with centre frequencies of 0.5, 1, 2, and 4 kHz are presented in . For the NBN stimulus with the lowest centre frequency of 0.5 kHz, the stapedius reflex threshold could be determined in N = 17 of the N = 34 subjects. In N = 17, the reflex could not be detected up to a sound level of 95 dB which is the maximum presentation level of the 0.5 kHz noise burst. For noise bursts with higher centre frequencies, sound presentation was possible up to 100 dB. For 1 kHz and 4 kHz, the reflex could be observed in all except for one subject. For 2 kHz, the reflex could be detected in all subjects. The stapedius reflex threshold decreased with increasing centre frequency of the NBN bursts. The median threshold was 95 dB HL for 0.5 kHz, 90 dB HL for 1 kHz, 85 dB HL for 2 kHz, and 80 dB HL for 4 kHz. The interquartile range was 5 dB for 0.5 kHz and 10 dB for higher frequencies. RM ANOVA with subsequent Posthoc Test showed a significant difference between 1 kHz and 2 kHz and between 2 kHz and 4 kHz (p < 0.001) (
Figure 4. Mean and standard deviation of FF-SRTs of ESRT-based maps, shown in (N = 34 patients). Box plot shows median (solid mid line), 25th and 75th percentile interval (box limits), the 5th and 95th percentile (whiskers), and mean values (squares).
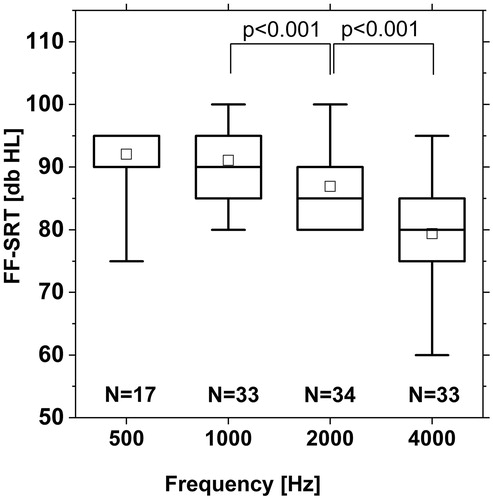
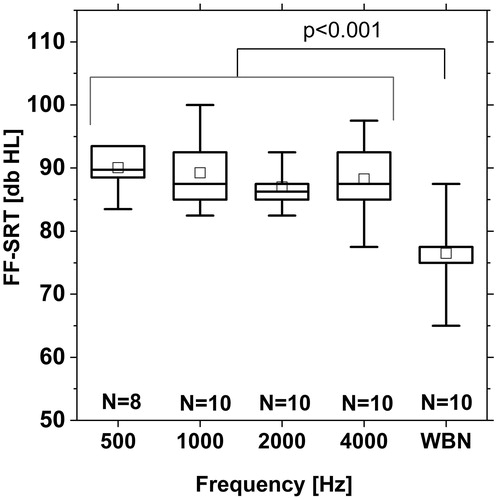
Figure 5. FF-SRTs of CI patients using ESRT-based maps (N = 10) for NBN with centre frequencies of 0.5, 1, 2, and 4 kHz and WBN (acoustic presentation via loudspeaker). Box plot shows median (solid mid line), 25th and 75th percentile interval (box limits), the 5th and 95th percentile (whiskers), and mean values (squares).
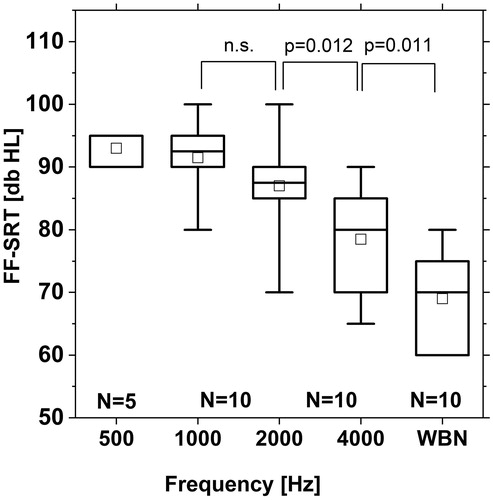
Figure 6. FF-SRTs of normal hearing subjects (N = 10 for NBN with centre frequencies of 0.5, 1, 2, and 4 kHz and WBN (acoustic presentation via loudspeaker). Box plot shows median (solid mid line), 25th and 75th percentile interval (box limits), the 5th and 95th percentile (whiskers), and mean values (squares).
FF-SRTs of CI patients using ESRT-based maps vs. normal-hearing subjects
In ten of the CI patients, free field measurement was performed using WBN in addition to NBN. The control group of ten normal-hearing listeners underwent the same procedure. For NBN, the obtained FF-SRTs of the subgroup of CI patients (N = 10) were similar to the entire group (N = 34). For the subgroup, the median FF-SRT was 95 dB HL for 0.5 kHz, 93 dB HL for 1 kHz, 88 dB HL for 2 kHz, and 80 dB HL for 4 kHz. These are nearly identical medians compared to the entire group of CI participants, considering that the reflex threshold was measured in 5 dB steps. Again for 0.5 kHz, the reflex could be detected in 50% of the patients like in the entire group of N = 34 subjects. The median threshold of WBN was 70 dB HL, which is 10 dB less than the median threshold for 4 kHz NBN. RM ANOVA with subsequent Posthoc test showed a significant difference between 2 kHz and 4 kHz NBN burst (p = 0.012) and between the 4 kHz NBN and the WBN burst (p < 0.011) (
For normal-hearing subjects, the median stapedius reflex threshold for NBN burstswas 90 dB HL for 0.5 kHz, 88 dB HL for 1 kHz, 86 dB for 2 kHz, and 88 dB HL for 4 kHz (. In contrast to the CI group, mean thresholds of normal-hearing subjects did not decrease with increasing frequency. The reflex for 0.5 kHz could be detected in N = 8 out of N = 10 subjects i.e. in considerably more subjects compared to the CI group. For WBN, the median stapedius reflex threshold was 78 dB HL for the normal-hearing group. Thus, for CI participants and for normal-hearing subjects, the reflex threshold for WBN was 10 dB lower than the threshold for the 4 kHz NBN burst. For normal-hearing listeners, RM ANOVA with subsequent Posthoc test showed a significant difference between WBN and all NBN bursts (p < 0.001).
Relation between electrical dynamic range (MCL) and change of FF-SRT
On the initial maps, mean free field thresholds of NBN bursts were 93 dB HL at 0.5 kHz, 84 dB HL at 1 kHz, 83 dB HL at 2 kHz, and 75 dB HL at 4 kHz; the WBN threshold was 76 dB HL. Starting from this map, global decreasing MCL resulted in increased FF-SRTs and global increasing MCL resulted in decreased FF-SRTs for all frequencies. Global decreasing/increasing MCL by 6% steps resulted in a change of FF-SRTs by about 5 dB HL to 10 dB HL per step. The change in the resulting reflex threshold for a given change in MCL increased with increasing frequency and was greatest for WBN. The data revealed a linear relationship between the change in electrical dynamics (relative to the MCL of the initial map) and the resulting change in reflex thresholds, as presented in . Linear regression was performed on the data of the four patients revealing high correlation coefficients for each frequency. Slope of the regression line and regression coefficient are presented in . Low-frequency noise bursts had a smaller (negative) slope of this linear function than high-frequency noise bursts. For WBN, the regression line showed the largest slope. The slopes of the regression lines differed between noise stimuli at different centre frequencies except for 2 kHz vs. 4 kHz with nearly identical regression lines. Paired t-test showed statistically different slopes between 0.5 vs. 1 kHz, 1 vs. 2 kHz, and 4 kHz NBN vs. WBN, as presented in .
Figure 7. Change of FF-SRT in response to the change of MCL relative to MCL of the initial map for different NBN bursts with centre frequencies of 0.5, 1, 2, and 4 kHz, and for WBN. a) Example shown for one patient; b) Linear regression line based on data of N = 4 patients. Slopes of regression line increase for increasing centre frequency of NBN, except for 2 and 4 kHz with nearly identical regression lines. Details of the linear regression are shown in .
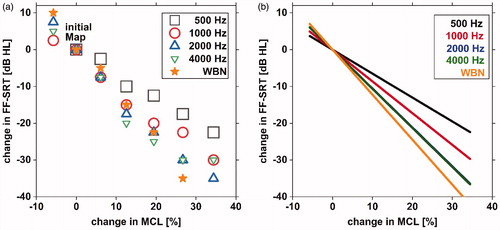
Table 2. Slope, standard error, and Pearson regression coefficient of regression lines presented in .
Table 3. t-value and significance level of paired t-test comparing slopes of neighbouring regression lines presented in .
Discussion
FF-SRTs in CI patients vs. normal-hearing listeners
Postoperative stapedius reflex measurement in patients with a CI is one of a few objective methods to estimate the upper limit of the electrical stimulation which is typically referred to as comfort level. In the present study, such comfort levels were estimated as the threshold at which the stapedius reflex could be elicited through electrical stimulation. In particular, two methods for obtaining the stapedius reflex threshold were compared: stapedius reflex threshold measurement using electric single channel stimulation and stapedius reflex threshold measurement using acoustic stimulation of the entire implant system in free sound field. In a first step, the stapedius reflex threshold was detected using electric stimulation of single channels (ESRT) in order to create an ESRT-based fitting. The ESRT values found were higher for basal electrodes than for apical electrodes, which is in accordance with the results of other studies (Battmer, Laszig, and Lehnhardt Citation1990). One major goal of this study was to investigate stapedius reflex thresholds determined from measurement in free sound field in CI patients when using ESRT-based fitting and to compare this to normal-hearing listeners.
The results showed that free field thresholds of NBN bursts at centre frequencies of 0.5 kHz to 4 kHz in CI patients using ESRT-based maps reached the target range of approx. 70–90 dB HL given by Müller-Deile and Hey (Citation2016). In contrast to the normal-hearing control group, a frequency dependence of the reflex threshold was found for CI patients using ESRT-based maps. Similar behaviour was observed in the entire study group (N = 34) and the group of CI patients selected for comparison with the normal-hearing control group (N = 10). Stapedius reflex thresholds elicited in free sound field through the CI system decreased with increasing frequency. The median thresholds were 95 dB HL for 0.5 kHz, 90 dB HL for 1 kHz, 85 dB HL for 2 kHz, and 80 dB HL for 4 kHz.
For the normal-hearing control group, stapedius reflex thresholds for the narrow band signals did not show a decreasing trend for increasing centre frequency from 0.5 to 4 kHz. The median values of the stapedius reflex thresholds were in the range of between 86 dB HL and 90 dB HL. In a recent study, stapedius reflex thresholds in normal-hearing listeners were investigated in free sound field using similar narrow band signals as were used in this study (Dageförde et al. Citation2019). Results of that study showed the same behaviour of the stapedius reflex in normal-hearing listeners as was found for the control group of normal-hearing listeners in the present study.
In view of these results, a frequency dependence of the stapedius reflex threshold is not likely in normal-hearing listeners. Hence, the frequency dependence of the stapedius reflex threshold elicited in free sound field found in patients with a CI seems not to be a physiological effect. It is caused by signal processing in the CI system.
Within the complex CI signal processing most likely two effects contribute to the observed frequency dependence of the stapedius reflex thresholds in free sound field: pre-emphasis of the microphone signal and the adjustment of the filter banks, which determines the mapping of the acoustic signal to individual stimulation channels. Pre-emphasis filters are designed to reduce the low-frequency energy prior to encoding the acoustic signal. Such pre-emphasis filters were analysed in a study by Chung & McKibben in 2011 for different CI systems. Therein the slope of these filters was in the range of 5–10dB per octave, which would explain the increasing trend in stapedius reflex thresholds with stimulus frequency observed in the present study. Secondly, the adjustment of the filter banks may also have an effect. In the particular CI systems used in this study, the acoustic signal is divided into up to 12 frequency bands. The centre frequency of the used acoustic NBN burst does not necessarily have to match the centre frequency of the related frequency band. While some acoustic stimuli are well centred within the related frequency band, others are mapped to the edges or even to the spectral overlap of adjacent filter bands. For example, in standard configuration with 12 activated electrodes, the 4 kHz NBN burst is well centred within the band no. 10 while the 1 kHz NBN burst is mapped to the spectral overlap of frequency bands no. 5 and no. 6. So, if the frequency of the acoustic NBN is located at the edge of the frequency band, there are two effects: First, the acoustic signal is attenuated according to the roll-off of the band pass filter and second, a wider area of the cochlea is excited by the electrical stimulation of adjacent electrodes. This could lead to a higher and more focussed energy input if the centre frequency of the NBN burst is well centred within the related frequency band. For the standard configuration with 12 activated electrodes, the 0.5 kHz and 1 kHz frequencies are mapped at the edge of the corresponding frequency bands, the 2 kHz frequency is closer to the centre frequency and 4 kHz is even well centred within the corresponding frequency band. This could be related to a higher energy input for 2 kHz and even higher for 4 kHz compared to 0.5 kHz and 1 kHz as described above. This might explain the observation in all tested patients with a CI that the stapedius reflex threshold decreases with increasing centre frequency of the NBN stimuli.
In half of the patients, at least one electrode was deactivated for different reasons as discussed above. Thus, not all patients had identical adjustments of the frequency bands, as these were reassigned according to the number and position of active electrodes. Analysing the effect of the position of the centre frequency of the NBN bursts relative to the adjusted frequency bands of the CI system on the stapedius reflex threshold requires further evaluation of the data and was not the subject of this study.
For WBN, the reflex threshold of CI patients showed a similar behaviour to that of normal-hearing patients. The median value of the stapedius reflex threshold of WBN was 78 dB for normal-hearing subjects and to 70 dB for CI subjects. In both groups, the stapedius reflex threshold for WBN was 10 dB lower than the reflex threshold for a NBN signal centred at 4 kHz. This observation suggests that this might be a physiological effect. The results in normal-hearing subjects are consistent with the findings of previous studies which also found significantly lower stapedius reflex thresholds for WBN compared to NBN (Keefe et al. Citation2017 and Dageförde et al. Citation2019).
For NBN bursts centred at 0.5 kHz, the reflex could be detected in N = 16 out of N = 34 subjects. For noise bursts with higher centre frequencies of 1, 2, and 4 kHz, the reflex could always be detected, with one exception each for 1 kHz and 4 kHz. For the 0.5 kHz burst, the limit of the presentation level was 95 dB, whereas for all higher frequencies it was 100 dB. This could be one reason why the stapedius reflex could be detected in only 50% of the patients at 0.5 kHz. If an intensity of 100 dB HL had also been possible for the 0.5 kHz noise burst, the number of detectable stapedius reflexes at 0.5 kHz and consequently their mean threshold would most likely have increased. Therefore, the 0.5 kHz frequency was excluded from the statistical comparison of thresholds for NBN at different centre frequencies.
Electrically evoked stapedius reflex threshold vs stapedius reflex threshold evoked in free sound field
The present study investigated the elicitation of the postoperative stapedius reflex using both single channel electric stimulation when the CI of the patient was connected to the fitting system, and using acoustic stimulation in free sound field when the patient was wearing his activated audio processor. Single channel ESRT measurements were used to create an ESRT based map and subsequent free field measurements were used to measure the stapedius reflex thresholds of such a single channel ESRT based map in live mode when presenting stimuli in free sound field. Estimating the ESRT of single electrodes provides information on each tested electrode but the procedure is very time-consuming. In contrast to that, free field stapedius reflex measurement provides information on certain frequency ranges, but the exact mapping of individual electrodes might not always be possible because the acoustic signal covers a certain range and thus several adjacent electrodes might be involved. However, the free field measurement of an existing map requires significantly less time than the ESRT measurement of each individual electrode. In this respect, free field measurement has an advantage for use in clinical routine. Furthermore, free field measurement more reflects the “daily life” condition than electrical single stimulation does.
It has to be mentioned that determining ESRT by single channel stimulation was performed using a modified procedure based on the work of Stephan, Welzl-Müller, and Stiglbrunner (Citation1988) who described an up/down procedure on each electrode of the array and who performed five detection scans respectively to test reproducibility. This whole procedure as described in that publication is very time-consuming. In the present study, stapedius reflex measurement in free field sound field was performed in addition, which takes extra time. To perform the complete stapedius reflex measurement within a reasonable time frame, the procedure for estimating ESRT was shortened. In the present study, fewer detection scans were made to ensure reproducibility, and the up/down procedure was not performed on all but on a reduced number of electrodes. Therefore, the estimation of the ESRT in the present study might be less accurate than the procedure described by Stephan, Welzl-Müller, and Stiglbrunner (Citation1988). On the other hand, complete stapedius reflex measurement within a reasonable time frame (60–90 minutes) was possible which ultimately also has an influence on the patients’ willingness to participate. Finally, N = 29 patients (N = 34 ears) participated, which allows statistically significant findings.
Relation between electrical dynamic range (MCL) and change of FF-SRT
A further aim of this study was to investigate the relationship between electrical dynamic range and the resulting stapedius reflex thresholds in free sound field. A linear correlation was found with decreasing reflex thresholds for increasing electrical dynamic range. The slope of the linear regression decreased for increasing centre frequency of narrow band signals The slope was greatest for WBN. For this experiment, overstimulated patients were selected featuring mean stapedius reflex thresholds in free sound field significantly well below 70 dB HL for NBN (even below 55 dB for certain centre frequencies) with their daily used maps. Particularly these overstimulated patients might benefit from these findings since the found correlation provides a simple calculation basis for guiding the audiologist on how to reduce the MCL to create a map with reflex thresholds in the desired range.
Conclusion
The findings of this study have shown that fitting based on electrically evoked stapedius reflex thresholds (ESRTs) results in free field stapedius reflex thresholds (FF-SRTs) that are close to those of normal-hearing listeners, even though a frequency dependence was found in CI patients that was not found in the normal-hearing control group. If CI patients exhibit reflex thresholds in the free sound field that are significantly outside the natural range, this could be indicative of suboptimal fitting in terms of over- or under-stimulation. The correlation found between electrical dynamic range and stapedius reflex threshold in the free sound field may provide a guideline for adjusting the electrical dynamic range. This allows the implant system to mimic the natural reflex behaviour in the best possible way and potentially avoid over- or under-stimulation.
Acknowledgement
We would like to thank MEDEL Deutschland GmbH for supporting this research, Ursula Lehner-Mayrhofer for proofreading and the participants who gave time and effort to participate.
Disclosure statement
All authors declare no conflict of interest.
Additional information
Funding
References
- Allum, J. H. J., R. Greisiger, and R. Probst. 2002. “Relationship of Intraoperative Electrically Evoked Stapedius Reflex Thresholds to Maximum Comfortable Loudness Levels of Children with Cochlear Implants.” International Journal of Audiology 41 (2): 93–99. doi:10.3109/14992020209090399.
- Battmer, R.-D., R. Laszig, and E. Lehnhardt. 1990. Electrically Elicited Stapedius Reflex in Cochlear Implant Patients: Ear and Hearing 11, 370–374. doi:10.1097/00003446-199010000-00008
- Bresnihan, M., G. Norman, F. Scott, and L. Viani. 2001. “Measurement of comfort levels by Means of Electrical Stapedial Reflex in Children.” Archives of Otolaryngology-Head & Neck Surgery 127 (8): 963–966. doi:10.1001/archotol.127.8.963.
- Chung, K., and N. McKibben. 2011. “Microphone Directionality, Pre-Emphasis Filter, and Wind Noise in Cochlear Implants.” Journal of the American Academy of Audiology 22 (9): 586–600. doi:10.3766/jaaa.22.9.4.
- Cinar, B. C., A. Atas, G. Sennaroglu, and L. Sennaroglu. 2011. “Evaluation of Objective Test Techniques in Cochlear Implant Users with Inner Ear Malformations.” Otology & Neurotology: Official Publication of the American Otological Society, American Neurotology Society [and] European Academy of Otology and Neurotology 32 (7): 1065–1074. doi:10.1097/MAO.0b013e318229d4af.
- Dageförde, G., K. Plotz, K. Schmitt, and O. Dziemba. 2019. “Die Stapediusreflexschwelle an Normalhörigen – Vergleich Von Messungen Mit Freifeld- Und Sondenstimulation.” Jahrestagung Der Deutschen Gesellschaft Für Audiologie 22: 19DGA176. doi:10.3205/19DGA176.
- Empfehlung der deutschen Gesellschaft für Audiologie. 2018. “Audiologische Leistungen Nach CI-Indikation.” Z Audiol 57: 77–78.
- Gordon, K. A., M. H. Chaikof, C. Salloum, G. Goulding, and B. Papsin. 2012. “Toward a Method for Programming Balanced Bilateral Cochlear Implant Stimulation Levels in Children.” Cochlear Implants International 13 (4): 220–227. doi:10.1179/1754762811Y.0000000022.
- Gordon, K. A., B. C. Papsin, and R. V. Harrison. 2004. “Toward a Battery of Behavioral and Objective Measures to Achieve Optimal Cochlear Implant Stimulation Levels in Children.” Ear and Hearing 25: 447–463. doi:10.1097/01.aud.0000146178.84065.b3.
- Hodges, A. V., T. J. Balkany, R. A. Ruth, P. R. Lambert, S. Dolan-Ash, and J. J. Schloffman. 1997. “Electrical Middle Ear Muscle Reflex: Use in Cochlear Implant Programming.” Otolaryngology-Head and Neck Surgery: Official Journal of American Academy of Otolaryngology-Head and Neck Surgery 117 (3 Pt 1): 255–261. doi:10.1016/S0194-5998(97)70183-9.
- Jerger, J.,. R. Fifer, H. Jenkins, and D. Mecklenburg. 1986. “Stapedius Reflex to Electrical Stimulation in a Patient with a Cochlear Implant.” The Annals of Otology, Rhinology, and Laryngology 95 (2 Pt 1): 151–157. doi:10.1177/000348948609500208.
- Jerger, J.,. T. A. Oliver, and R. A. Chmiel. 1988. “Prediction of Dynamic Range from Stapedius Reflex in Cochlear Implant Patients.” Ear and Hearing 9 (1): 4–8. doi:10.1097/00003446-198802000-00010.
- Keefe, D. H., M. P. Feeney, L. L. Hunter, and D. F. Fitzpatrick. 2017. “Aural Acoustic Stapedius-Muscle Reflex Threshold Procedures to Test Human Infants and Adults.” Journal of the Association for Research in Otolaryngology 18 (1): 65–88. doi:10.1007/s10162-016-0599-z.
- Kosaner, J. 2010. “Generating Speech Processor Programmes for Children Using ESRT Measurements.” Cochlear Implants International 11 (sup2): 20–24. doi:10.1179/146701010X12726366068535.
- Kosaner, J., I. Anderson, Z. Turan, and M. Deibl. 2009. “The Use of ESRT in Fitting Children with.” Cochlear Implants. International Advanced Otology 5: 70–79.
- Kosaner, J., P. Spitzer, S. Bayguzina, M. Gultekin, and L. A. Behar. 2018. “Comparing eSRT and eCAP Measurements in Pediatric MED-EL Cochlear Implant Users.” Cochlear Implants International 19 (3): 153–161. doi:10.1080/14670100.2017.1416759.
- Müller-Deile, J. 2009. Verfahren zur Anpassung und Evaluation von Cochlear-Implant-Sprachprozessoren, 1. Heidelberg: Aufl. Median-Verl. von Killisch-Horn.
- Müller-Deile, J., and M. Hey. 2016. Audiologische Kontrolle des Cochlea-Implantat-Systems und Evaluation des Versorgungserfolges. Hörakustik, Cochlea Implantat Special 09/2016, 53–58.
- Seebacher, J. 2014. Zeitliche Entwicklung der elektrischen Stapediusreflexschwellen (ESRT) bei Kindern mit CI im Vergleich zu zur Änderung der maximal angenehmen Lautheit. 17. Oldenburg: Jahrestagung der Deutschen Gesellschaft für Audiologie, 13.03.2014,
- Shallop, J. K., and K. R. Ash. 1995. “Relationships among Comfort Levels Determined by Cochlear Implant Patient’s Self-Programming, Audiologist’s Programming, and Electrical Stapedius Reflex Thresholds.” The Annals of Otology, Rhinology & Laryngology. Supplement 166: 175–176. PMID: 7668623
- Spivak, L. G., and P. M. Chute. 1994. “The Relationship between Electrical Acoustic Reflex Thresholds and Behavioral Comfort Levels in Children and Adult Cochlear Implant Patients.” Ear and Hearing 15 (2): 184–192. doi:10.1097/00003446-199404000-00008.
- Spivak, L. G., P. M. Chute, A. L. Popp, and S. C. Parisier. 1994. “Programming the Cochlear Implant Based on Electrical Acoustic Reflex Thresholds: Patient Performance.” The Laryngoscope 104 (10): 1225–1230. doi:10.1288/00005537-199410000-00007.
- Stephan, K., and K. Welzl-Müller. 1994. “Effect of Stimulus Duration on Stapedius Reflex Threshold in Electrical Stimulation via Cochlear Implant: Announcement.” International Journal of Audiology 33 (3): 143–151. doi:10.3109/00206099409071875.
- Stephan, K., and K. Welzl-Müller. 2000. “Post-Operative Stapedius Reflex Tests with Simultaneous Loudness Scaling in Patients Supplied with Cochlear Implants.” Audiology: Official Organ of the International Society of Audiology 39 (1): 13–18. doi:10.3109/00206090009073049.
- Stephan, K., K. Welzl-Müller, and H. Stiglbrunner. 1988. “Stapedius Reflex Threshold in Cochlear Implant Patients.” Audiology: Official Organ of the International Society of Audiology 27 (4): 227–233. doi:10.3109/00206098809081593.
- Stephan, K., K. Welzl-Müller, and H. Stiglbrunner. 1990. “Dynamic Range of the Contralateral Stapedius Reflex in Cochlear Implant Patients.” Scandinavian Audiology 19 (2): 111–115. doi:10.3109/01050399009070761.
- Walkowiak, A., A. Lorens, M. Polak, B. Kostek, H. Skarzynski, A. Szkielkowska, and P. H. Skarzynski. 2011. “Evoked Stapedius Reflex and Compound Action Potential Thresholds versus Most Comfortable Loudness Level: Assessment of Their Relation for Charge-Based Fitting Strategies in Implant Users.” ORL; Journal for Oto-Rhino-Laryngology and Its Related Specialties 73 (4): 189–195. doi:10.1159/000326892.