
Abstract
Objectives
To assess the performance of newborn hearing screening (NHS) programmes, through selected quality measures and their relationship to protocol design.
Design
NHS coverage, referral, follow-up and detection rates were aggregated. Referral rates were compared to age at screening step 1, number of steps, and test method: OAE or aABR.
Study sample
A questionnaire on existing hearing screening was completed by experts from countries in Europe, plus Russia, Malawi, Rwanda, India and China.
Results
Out of 47 countries or regions, NHS coverage rates were reported from 26, referral rates from 23, follow up from 12 and detection rates from 13. Median coverage rate for step 1 was 96%. Referral rate from step 1 was 6–22% where screening may be performed <24 h from birth, 2–15% for >24 h, and 4% for >72 h. Referral rates to diagnostic assessment averaged 2.1% after one to two steps using OAE only, 1.7% after two steps including aABR, and 0.8% after three to four steps including aABR. Median detection rate for bilateral permanent hearing impairment ≥40dB was 1 per 1000 infants.
Conclusion
Referral rates were related to age, test method and number of screening steps. Quality measures were not available for many NHS programmes.
Introduction
To achieve early identification and intervention for infants with permanent hearing impairment (HI), programmes for newborn hearing screening (NHS) have been widely implemented. The goal is to detect all infants with HI while maintaining low false positives to avoid unnecessary costs and parental worry. A sustained data collection process allows decision makers and programme managers to monitor and evaluate the performance of their NHS programme. According to the World Health Organization (Citation2015), implementing a procedure for monitoring and evaluation is a key step in the development of a national strategy for ear and hearing care (including early detection). Without it, success cannot be distinguished from failure.
Quality measures and benchmarks (i.e. performance targets) provide a framework for evaluating the performance of screening. In this study, coverage rate, referral rate, and follow-up rate are the quality measures assessed. These measures were previously described in literature and are used in local screening programmes and position statements from around the world (Joint Committee on Infant Hearing Citation2007; Olusanya et al. Citation2007; Patel and Feldman Citation2011; Wood, Sutton, and Davis Citation2015; Neumann et al. Citation2019). Benchmarks for quality measures used in NHS have been recommended by the Joint Committee on Infant Hearing (Citation2007) and are used directly or as a starting point for local policy makers to predefine alternative benchmarks.
Coverage is the quality measure that ensures NHS is available to all eligible infants who are born in the administering hospital, or who live in the administering region or country. In some literature, coverage rate has been defined as the percentage of eligible infants that complete the entire screening pathway within a specific timeframe (e.g., Wood, Sutton, and Davis Citation2015). In other studies, coverage has been defined as the number of eligible infants that complete step 1 (e.g. Olusanya et al. Citation2007). Notwithstanding the different definitions, coverage rate reflects the quality of NHS access and its uptake. Several screening programmes and guidelines have defined a benchmark coverage rate of 95–97% (Joint Committee on Infant Hearing Citation2007; Patel and Feldman Citation2011; Januario et al. Citation2015; Neumann et al. Citation2019).
Referral rate is the percentage of infants that do not pass the screening, for each individual step or after all screening steps. A screening step is when screening is performed, and a result (pass or fail) is obtained. Infants that fail a screening step may be referred to the next step. Infants that fail all steps in the sequence are referred to diagnostic assessment. Approximately 0.1–0.2% of all infants are born with a permanent HI (Kennedy et al. Citation1998; Bussé et al. Citation2020). The infants with a permanent HI make up only a part of the infants referred for diagnostic assessment. Other infants referred may have normal hearing, a transient HI (e.g. temporary fluid in the middle ear) or a permanent HI that was missed if best-practice diagnostic protocols were not followed. Referral rates should therefore be low, signifying a low false positive rate. The benchmark for final referral to diagnostic assessment is commonly 4% for low-risk or all infants combined (Joint Committee on Infant Hearing Citation2007; Patel and Feldman Citation2011; Januario et al. Citation2015; Neumann et al. Citation2019). In this study, high-risk infants are defined as having an increased risk for HI or retrocochlear dysfunction and the remaining infants are defined as low risk.
Follow-up rate is the percentage of infants whose families attend either the rescreening step or the diagnostic assessment, after having been referred in a previous step. Follow-up rate could inversely be described as loss to follow-up (LTFU), which identifies the percentage of infants referred who are not followed up (or documented) at a rescreening step or diagnostic assessment. A benchmark of 90–97% is often used for a target follow-up rate (Joint Committee on Infant Hearing Citation2007; Patel and Feldman Citation2011; Januario et al. Citation2015; Neumann et al. Citation2019).
Within the EUSCREEN project, the cost-effectiveness of vision and hearing screening programmes will be compared. A model is being developed to calculate the most cost-effective screening programme in any country given its local circumstances. For this purpose, a large-scale international aggregation of information on childhood hearing and vision screening was completed. In the preceding article, we described the various NHS protocols, in terms of the number of screening steps, the choice of test (otoacoustic emissions [OAE] and/or automated auditory brainstem response [aABR]), and the age of the infant at step 1 (Bussé et al. Citation2021). Our results suggested that the level of health care spending may influence decisions on protocol design, as more countries with lower health spending had OAE-only programmes. Yet OAE screening is highly sensitive to transient obstructions of the middle ear, such as amniotic fluid, which may lead to a high number of false positive results (VAN Dyk, Swanepoel, and Hall Citation2015). Increasing the number of screening steps, using aABR instead of OAE, and/or delaying step 1 may help reduce the overall referral rate (Clemens and Davis Citation2001; Benito-Orejas et al. Citation2008; Berninger and Westling Citation2011; Caluraud et al. Citation2015). Lower referral rates reduce the subsequent burden and costs on diagnostic services, and may also lead to a reduction of LTFU (Finitzo, Albright, and O'Neal Citation1998). Given the significant diversity in protocol design across countries (Sloot et al. Citation2015; Bussé et al. Citation2021), a systematic evaluation of the effectiveness of NHS is essential to better understand the consequences of protocol choice and the current barriers to effective NHS.
In the present study, we evaluated the quality measures reported by NHS programmes. This study also examined the relationship between referral rates to the protocol features across multiple screening programmes. Specifically, the minimum age and location for step 1, the number of screening steps, and the use of aABR and/or OAE were investigated. The quality measures described in this study are the coverage of the NHS programme, the referral rates per step and to diagnostic assessment, the follow-up rates between steps 1 and 2 and from all screening steps to diagnostic assessment, the detection rates, specificity and the positive predictive value (PPV). Sensitivity and negative predictive values are difficult to assess and were not included in this study. Decisions made by policymakers when selecting or revising an NHS protocol design may be influenced by previous findings on its effectiveness, in combination with the current state of newborn health care in the country. This is addressed in the present study. Results are particularly valuable to areas still in the phase of NHS implementation, where few local reports on NHS effectiveness may be available.
Methods
The web-based EUSCREEN questionnaire was developed by a panel of hearing and screening professionals and contained 191 questions across nine domains on hearing screening. Questions on the organisation, protocol, pathways for referral, quality measures and costs were included. Most questions were followed by a five-choice sub-question on the level of evidence of the answer supplied, which composed the options: (a) Data unavailable, (b) I don’t know, (c) Rough estimate, (d) Real estimate from calculation and (e) Actual data. If the response was composed using data from a source, the name and date of this source was requested. Publicly available sources, such as annual screening reports, were also requested via email when available.
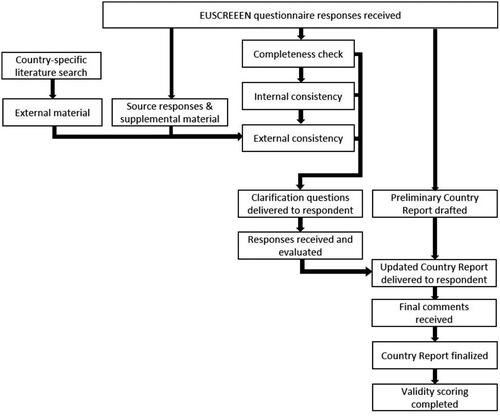
Respondents were local screening experts, so-called Country Representatives (CRs). CRs of the originally selected countries were recruited via professional organisations, existing contacts, and recent publications. Participation was open to experts from any country, regardless of the status of their NHS programme or data availability. Screening experts from countries outside the original selection were welcome to register to fill out the questionnaire but were not actively sought. Upon registration, the qualifications of the CRs were checked, and the CRs had to confirm their expertise in relation to the NHS data they provided. CRs accessed the questionnaire between March 2017 and June 2019 via the EUSCREEN website (www.euscreen.org) with a unique username and password. After the questionnaire was submitted, it was checked for completeness. The verification procedure is summarised in . An internal cross-checking procedure was performed between CRs representing the same country or region and between questions asking for similar answers. External literature and source material, supplied by the CR or searched and accessed online, were translated via Google Translate and cross-checked with answers provided. CRs were asked to clarify their answers when original answers were unclear, when answers were inconsistent with other answers within the same questionnaire, or when answers were inconsistent with supplementary materials. After completion, the list of clarification questions was returned by the CRs. A report was developed for each programme based on the combined collected information and sent to the CR for final confirmation. Countries were excluded from the study if answers were not sufficiently completed to generate a descriptive report.
Figure 1. Flow chart of the verification and validation process.
To describe the current health care status for newborn care, data on universal newborn care were aggregated from established sources (UNICEF 2019 Citation2019; World Health Organization Citation2019) and from responses in the questionnaire. The measures evaluated were the percentage of infants born in health facilities, the percentage of infants undergoing a post-natal check-up by 2 days of age, and the immunisation coverage of the first dose of diphtheria toxoid, tetanus toxoid and pertussis vaccine.
Selection and validation of quality measures
The quality measures described in this study were selected based on previously defined measures used in NHS guidance documents, international position statements, and literature describing NHS performance across countries from various income levels (Olusanya et al. Citation2007; Wood, Sutton, and Davis Citation2015). Quality measures were the coverage, referral between screening steps, referral from screening to the diagnostic assessment, and follow-up rate to screening steps. Detection rates reveal the outcome of the screening programme (i.e. the number of children with permanent HI).
Among established NHS programmes, the validation of responses was based on the level of evidence provided by the CRs. It was the CRs’ responsibility as collaborators to provide high quality and valid data where available. The quality of the responses they provided were self-rated in the sub-question following each main question. The data supplied were classified as “not valid” if the CR indicated that they were based on a rough estimation. In cases where answers were provided based on calculations of data, responses were considered “valid” if source data were recent (collected from 2014 or later), representative of the target population, and consistent with the source or external literature. The method used to collect the raw data, including the data management system, may affect the validity and accuracy of the figures provided, though this was not evaluated in this study. This made it possible for answers to be included across all data collection and management systems. Minimum sample size criteria varied based on the outcome measure: coverage rates were not dependent on the sample size; referral rates were valid if sample size was 1000 or more; detection rates were valid when the sample size was >5000. The exception was for countries or regions where birth rates were under these values.
Evaluation of valid quality measures
Data considered valid as a result of the validity scoring were analysed further. A null value was assigned for any data not scored as valid or where annual birth rates were under 1000. Descriptive statistics were calculated for all selected quality measures. To calculate pooled rates, the reported rates for each programme were transformed to estimated counts using the number of live births in the country or region for a one-year birth cohort () due to the differences in population size.
Table 1. Annual births for each country or region, validity of selected quality measures, and data collection process for each participating country or region.
The CRs filled out the questionnaire for an individual NHS programme, which was organised either nationally or regionally. For regionally organised programmes, the quality measures reported represented only the participating region, and other regions within the country were not represented. For nationally organised programmes, the rates represented the entire country.
Referral and follow-up rates were evaluated between individual steps and from the entire screening programme to diagnostic assessment. Costs were evaluated for screening (in euro per infant screened), screening devices, screener salaries, and intervention.
Analyses of quality measures and protocol design
The reported referral rates (where provided) were compared across the age of the infant at step 1 and screening protocols for low-risk infants. Formation of groups were based on the results of Bussé et al. (Citation2021). Age was categorised based on the minimum age of screening: <24 h, 24 h, or 72 h. Programmes that perform screening after 72 h performed screening outside the maternity hospital, either in a child health care centre or at home; all remaining programmes screen in the maternity hospital (before or after discharge). Protocol groups were formed based on the screening devices used (OAE versus aABR) and the number of steps (i.e. screens and repeat screens) in the protocol. For protocols using OAE only, all steps are performed using OAE. The category of OAE could include either transient-evoked OAE or distortion-product OAEs, although transient-evoked OAEs are used in the majority of programmes. For one- to two-step protocols including aABR, one programme uses aABR for step 1 (no step 2), one programme uses aABR for steps 1 and 2, and the others use OAE for step 1 and aABR for step 2. For three- or four-step protocols including aABR, the final step is performed with aABR and earlier steps are performed with OAE. A list of technologies for OAE and aABR showing the diversity across manufacturer and passing criteria is available in Bussé et al. (Citation2021).
Next, a comparison between referral rate and follow-up rate was performed. For the analyses, the estimated counts for referrals were derived from the number of births across a one-year cohort, and the estimated counts for follow-up were derived from the number of referrals.
Risk ratios were calculated in SPSS (v.26.0, SPSS Inc., Chicago, IL) with 95% confidence intervals to show the increased risk of referral between two conditions (in this case protocol choices). Because of the large population-based estimates used, risk ratios with confidence intervals provided a more clinically applicable result than p-values when comparing conditions (Cumming Citation2014).
Results
Questionnaires were sufficiently completed by CRs from 40 European countries plus five additional CRs with interest in participating: Russia, Malawi, Rwanda, India, and China (Appendix 2). Two regions from Spain and two regions from Belgium participated, for a total of 47 participating countries or regions (). The questionnaires from South Africa and Norway were not sufficiently completed to generate a descriptive report and were excluded.
Newborn health care
Thirty high-income countries (HICs), 13 middle-income countries (MICs) and 2 low-income countries (LICs) were included, according to the World Bank classification system (The World Bank Citation2019). Data on hospital births from the questionnaire and UNICEF’s Maternal and Newborn Database (2019) were available for all but eight HICs. The percentage of deliveries in a health facility was >90% for all but three countries. In India, Flanders (Belgium) and the Netherlands, 79%, 83% and 81% of deliveries take place in a hospital. Data from some participating MICs and LICs were available regarding the percentage of infants that undergo a postnatal check-up after delivery (up to 2 days of age). Rates varied from 19% in Rwanda and 27% in India to 86% in Albania, 96% in Kosovo and 99% in Montenegro (UNICEF 2019 Citation2019). Immunisation coverage for the first dose of diphtheria, tetanus & acellular pertussis (around 2 months of age) was available for all except nine countries (seven HICs and two MICs) and ranged from 89% to 99%, according to statistics from the World Health Organization (Citation2019).
Validation of quality measures
A list of all participating countries and regions and the corresponding validation results are presented in . Valid responses to the selected performance measures could not be provided by all countries or regions. Sixteen were unable to provide valid outcome data of which five (Albania, Malawi, Montenegro, Kosovo and Rwanda) did not have a permanently established NHS programme at the time of data aggregation.
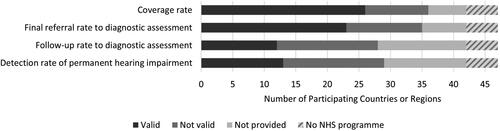
displays that valid coverage rate was reported by the most NHS programmes and valid follow-up and detection rates were reported by the fewest programmes. CRs typically acquired valid quality measures from internal databases or registries, quality assessment reports, or studies published in local journals, local media or student theses. Data were collected from 2014 to 2017, and most represented a one-year birth cohort, although some data were collected over a longer period. The sources used to cross-check the survey responses or when cited by the CR are listed in Appendix 1.
Figure 2. Results of the validation scoring for coverage rate, referral rate to diagnostic assessment, follow-up rate to diagnostic assessment, and detection rate of permanent hearing impairment. Data were considered valid when source data were recent, representative of the target population, met the minimum sample size criteria, and consistent with the source or external literature. Out of the 47 participating countries or regions, the number are displayed with valid data, not valid data, or none provided. Five countries did not have a permanently established NHS programme. Note that the exact definition of each measure may vary across programmes, as NHS programmes could only report on the values that they themselves calculate. Notably, more valid data could be provided on coverage and referral rates compared to follow-up or detection rates.
Quality measures and costs
The following paragraphs present descriptive results of the performance of NHS programmes. As described previously, pooled rates were calculated from estimated counts from each programme. Programmes reported either for all infants irrespective of risk group or for low- and/or high-risk infants separately. lists the NHS programmes (national or regional) with valid data for each selected quality measure.
Coverage rates
The definition of coverage varied slightly across the 26 NHS programmes that reported valid coverage rate data. For four programmes, coverage rate was defined as the percentage of infants that completed the entire screening sequence, and for the remaining 22 coverage was defined as the infants who completed step 1. For the four programmes where coverage rate was defined as the percentage of infants that completed the entire sequence, one had a rate of 93% and the other three had rates of 98–99%. Out of the 22 programmes where coverage of step 1 was reported, 17 had ≥95% coverage. The pooled coverage rate for step 1 (all infants, high plus low-risk) was 97.9% and the median was 96% (range: 79–100%). Romania (coverage of 18%) was not included in this calculation, as it has a national programme in the process of scaling up. Besides Romania, step 1 coverage rates of 79%, 96% and 98% were reported from three MICs. The remaining programmes were from HICs (median: 96.7%, range: 85–100%).
Referral rates
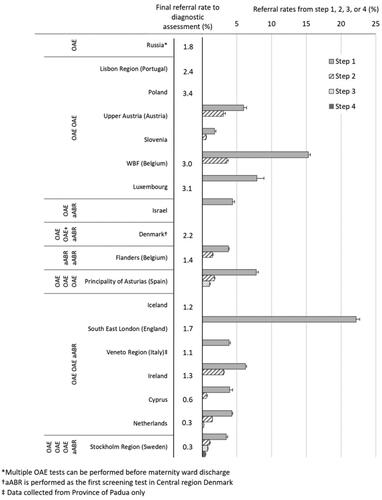
For 18 programmes, separate referral rates were reported for low-risk infants, which are displayed in according to protocol design. shows the decremental referral rates from each step of screening (steps 1, 2, etc.) and the final referral rate to diagnostic assessment out of the total number of infants screened. The pooled final referral rate to diagnostic assessment for low-risk infants was 1.9% (median 1.5%, range 0.27–3.4%). For seven programmes, referral rates were reported for high-risk infants, for which the pooled referral rate to diagnostic assessment was 8.0% (median 6.8%, range 4.0–10.2%). For ten programmes, referral rates for all infants irrespective of risk group were reported, for which the pooled referral rate from step 1 was 9.0% (median 8.4%, range 3.5–12.1%) and the pooled final referral rate from screening to diagnostic assessment was 2.6% (median 1.5%, range 0.3–3.5%). All final referral rates to diagnostic assessment for programmes reporting on low-risk or all infants were less than 4%; all final referral rates for high-risk infants were 4% or higher.
Figure 3. Percentage of infants referred out of the total population screened from each step and to diagnostic assessment, grouped by the reported NHS protocol for low-risk infants. For some programmes data for all steps could not be reported. Low-risk infants are defined as infants without an increased risk for HI or retrocochlear dysfunction as per the risk factors specified by each NHS protocol. Error bars represent 95% confidence intervals. Because most infants without hearing impairment pass step 1, a large reduction of referral rate is seen between steps 1 and 2. Programmes with more steps and using aABR had lower final referral rates.
Follow-up rates
For programmes where all infants were reported on, irrespective of risk group, the pooled follow-up rate to step 2 out of those referred from step 1 was 81% (median 81%, range 27–97%, n = 9). All programmes were from HICs except for one MIC where a 27% follow-up rate to step 2 was reported. The pooled follow-up rate to diagnostic assessment out of those referred from the final screening step was 72% (median 89%, range 19–97%, n = 12). For programmes where low- and high-risk infants were reported separately, pooled follow-up rates to diagnostic assessment were 77% for low-risk infants (median: 74%, range 71–97%) and 90% for high-risk infants (median 90%, range 64–95%). However, this contrast between high- and low-risk infants was not consistent across individual programmes. All countries where follow-up rate to diagnostic assessment was reported were HICs except for one MIC, which had 76% and 89% follow-up rates for low- and high-risk infants. Overall, out of a total of 12 participating NHS programmes where valid follow-up rates were reported to diagnostic assessment for all infants and high- and low-risk infants combined, follow-up rates were under 80% for six, between 80% and 90% for two, and 90% or higher for four.
For programmes where the referral rate from step 1 was higher, follow-up rates to step 2 were lower. For only five programmes figures for both measures were provided. Referral rates from step 1 were 4, 4, 8, 8, and 15%. Corresponding follow-up rates to step 2 were 99, 95, 92, 91, and 87%. Furthermore, loss to follow-up between steps can also affect the final referral rate, such as in Tuzla Canton (Bosnia and Herzegovina), where the final reported referral rate for all infants to a diagnostic assessment (0.35%) was highly influenced by a low follow-up rate between screening steps 1 and 2 (27%).
Detection rates
The detection rates (or prevalence rate after detection by NHS) varied between 0.7 and 3 per 1000 births (median: 1.16 per 1000, n = 10) for bilateral permanent HI ≥ 40 dB HL and between 0.28 and 0.72 per 1000 births (median: 0.42 per 1000, n = 9) for unilateral permanent HI ≥ 40 dB HL. For eight programmes (seven from HIC and one from a MIC), additional data were provided on bilateral or unilateral permanent HI ≥ 80 dB HL. Detection rates varied between 0.2 and 1.16 per 1000 (median: 0.32 per 1000, n = 8) for bilateral permanent HI ≥ 80 dB HL and between 0.1 and 0.6 per 1000 (median: 0.16 per 1000, n = 6) for unilateral permanent HI ≥ 80 dB HL. All detection rates provided were from HICs except one from a MIC, where a detection rate of 0.6 per 1000 was reported for bilateral permanent HI >80 dB HL. No clear trends were observed between detection rates of permanent HI and measures of follow-up rates to diagnostic assessment.
For only a few participating NHS programmes valid data were provided on detection or prevalence rates of auditory neuropathy spectrum disorder (ANSD), a type of retrocochlear dysfunction, among infants. In the Netherlands, a prevalence rate was reported of 2.7 per 1000 infants admitted to the NICU. Prevalence rates of ANSD for all infants were reported for the Principality of Asturias (Spain) (0.07 per 1000 births) and Ireland (0.02 per 1000 births). All other ANSD figures were rough estimations or absolute counts of ANSD cases on file.
Specificity and positive predictive value
The specificity of the entire protocol was defined as the percentage of infants with normal hearing who pass screening at any step within the sequence. Valid specificity was only reported from Westphalia-Lippe (Germany), Ireland, and Flanders (Belgium) for low-risk or all infants: 97.1%, 98.4% and 99.7%. Data on sensitivity and negative predictive value were not available.
PPV was defined as the percentage of infants referred from screening to a diagnostic assessment who have a confirmed hearing impairment that was targeted by the NHS programme. PPV is presented for each NHS programme in brackets. The only valid data on the PPV for an entire NHS programme for all infants were from Germany (6), Ireland (10), Poland (5) and the Autonomous Community of Valencia (Spain) (14). Programmes providing a PPV for low-risk infants were East Bohemia (Czechia) (10), Flanders (Belgium) (65), Upper Austria (Austria) (4), Wallonia-Brussels Federation (Belgium) (10) and the Netherlands (39). Out of these, the Netherlands also provided a PPV for high-risk infants (64.6). The protocols used by these countries can be observed in .
Costs
It was difficult for CRs to make a valid estimation of the costs of their screening programme. Overall screening costs, costs of screening devices, salary costs, hearing aid fitting and cochlear implant fitting included different aspects for each programme. The variability within the costs provided made any comparison between programmes impossible.
Analyses of quality measures and protocol design
The following paragraphs describe the results of the comparisons between quality measures and protocol features (minimum age of the infant at step 1, number of screening steps, and the inclusion of aABR in the protocol).
Referral rate from step 1 across age
For 13 programmes, the referral rate was reported from step 1 for low-risk infants. Step 1 is often performed in the maternity hospital before discharge. Subsequent steps may be performed before or after discharge. For most programmes, step 1 is performed in the maternity ward after 24 hours of age. For these programmes, the pooled referral rate from step 1 was 7.5% (median: 5.2%, range: 1.8–15.3%). In South East London (England) and Ireland, step 1 screening may be performed less than 24 h after birth. In England, the average length of stay in the maternity ward for deliveries without complications was 1.4 days (OECD Citation2019). Referral rate from step 1 in the maternity hospital was 22%, a figure consistent across England (23%; NHS Newborn Hearing Screening Programme Citation2019). In Ireland, the length of stay averaged 2.4 days (OECD Citation2019), and referral rate from step 1 was 6%. In Flanders (Belgium), the Netherlands and Cyprus, step 1 is performed after 72 h of age in a child health centre or home visit. Referral rates from step 1 were 4% for all three programmes. Out of the 13 programmes, aABR for step 1 is only used in Flanders. No difference in step 1 referral rate was observed between Flanders and the Netherlands or Cyprus where OAE is used for step 1.
Referral rate from all steps to diagnostic assessment across test method and steps
displays the referral rates and risk ratios across groups of programmes with similar low-risk protocols. Not all protocols were represented. Referral rate information was not available for countries that performed a one-step aABR protocol or a three-step protocol using only OAE. From the eight protocol categories displayed in , protocols were grouped into: protocols with one or two steps using OAE only; protocols with two steps using aABR in one or both steps; and protocols with three or four steps using aABR in the final step. Referral rates were highest for one- to two-step protocols with OAE only and lowest for a three- to four-step protocols including aABR. This trend can also be observed for individual programmes, displayed in .
Table 2. Pooled final referral rates (%) to diagnostic assessment for groups of programmes based on protocol design for low-risk infants (middle column).
Discussion
Of the 42 countries or regions with an NHS programme, 26 reported coverage rates, of which 22 reported only the coverage rate for screening step 1; 23 reported rates of referral from screening to diagnostic assessment; 12 reported the percentage of children who followed up from screening to diagnostic assessment; and 13 reported the percentage of infants detected with permanent HI. The percentage of infants referred from screening step 1 is related to the infants’ age when screened. For programmes that use aABR, referral rate from screening to diagnostic assessment was lower compared to those that use only OAE. Programmes also had lower referral rates to diagnostic assessment if they have more screening steps. Across the few countries where follow-up rates were reported, 81% of infants referred from step 1 followed up to step 2, and 72% of infants referred from all screening steps followed up to the diagnostic assessment.
Results of this study can be compared to benchmarks for NHS, as described by the Joint Committee on Infant Hearing (Citation2007). First, there were differences noted in the definition of coverage rate. The definition presented in the benchmark is the completion of screening before one month of age. In contrast, most programmes reported only the coverage rate of step 1, which neither reflects the LTFU between screening steps nor the timeliness of screening. However, it may be argued that the definition should be determined by the programme, so long as the same definition is applied to the benchmark. Despite differences in the definition of coverage rate, 20 out of 26 programmes reported good coverage (95% or higher). All reported referral rates to diagnostic assessment (for low-risk or all infants combined) achieved the benchmark (4% or lower), indicating high specificity. However, the referral rate can also be influenced by LTFU between screening steps. Unfortunately, follow-up rates were scarcely reported, and out of 12 programmes where follow-up rates were reported from screening to diagnostic assessment, only four reached the benchmark of 90% or higher, suggesting that LTFU remains a barrier to effective NHS in many countries. In the current study, detection rates of bilateral permanent HI for high- and low-risk infants combined ranged from 0.7 to 3 per 1000 infants, consistent with a previous review of the literature that showed a pooled prevalence rate of 2.2 per 1000 with a range across studies from 1 to 6 per 1000 infants (Bussé et al. Citation2020a).
When an NHS programme is implemented in a country, healthcare policy makers must make a few essential decisions. First, they must decide on the location where screening takes place, which is closely related to the age of the infant when screened. Screening is typically performed before discharge from the maternity hospital among countries with a high percentage of hospital births. This offers a major advantage, as it results in inherently high coverage. However, screening within 24 h after birth can result in a high referral rate from step 1 because of residual amniotic fluid in the middle ear. In this study, programmes performing step 1 after 24 h reported a range of referral rates from 2% to 15%. It is possible to achieve low referral rates when screening closely after birth with highly trained professionals (Vohr et al. Citation2001) and quiet test environments. For programmes with step 1 at 72 h of age or later, step 1 referral rates were 4%. Although low false positive rates are achieved, this strategy may be more expensive, and coverage may be lower. Still, high coverage after discharge from the maternity hospital has been obtained by programmes in this study and others, by combining step 1 with an existing postnatal health visit (Olusanya, Ebuehi, and Somefun Citation2009; Khoza-Shangase and Harbinson Citation2015). Second, a screening professional should be selected and trained. The decision on screening professional is described in more detail in the accompanying article (Bussé et al. Citation2021).
Next, the screening device and the number of steps should be established, plus whether a separate protocol is used for high-risk infants. In this study, aABR screening was related to lower referral rates to diagnostic assessment. An aABR may be used as the primary method for all infants or only infants that refer from earlier steps. The costs for aABR screening are up to double the costs of OAE screening, and aABR may be more complicated to use; however, lower referral rates will reduce the burden on diagnostic services, which may consequently reduce total costs (Boshuizen et al. Citation2001; Vohr et al. Citation2001). Screening effectiveness also depends on the device performance and passing criteria, listed in the accompanying article (Bussé et al. Citation2021). Given the lack of standardisation in screening equipment and the diversity of manufacturers, the decision of which device to select for a screening programme is difficult and may come down to cost and ease of use. Next, this study shows that NHS programmes with more screening steps had lower referral rates to diagnostic assessment. However, the requirement that families return one or multiple times for rescreening increases the risk that they do not return, which lowers the sensitivity of the screening programme. Finally, the decision should be taken whether to use a separate protocol for high-risk infants, which is discussed in the accompanying article (Bussé et al. Citation2021).
The overall efficacy of NHS is reduced if infants with a hearing impairment are not ultimately identified. Although sensitivity or negative predictive value were not reported in this study, poor follow-up rates between steps and to the diagnostic assessment show that LTFU is clearly an area in need of great improvement, according to both this quality investigation and other studies (Gaffney, Green, and Gaffney Citation2010; Deem, Diaz-Ordaz, and Shiner Citation2012). It is a particular barrier in LICs and MICs (Olusanya et al. Citation2007). Reducing referral rates may improve LTFU. NHS programmes that have gained more experience with the devices and management of care across a large population may have successfully streamlined both the screening and follow-up processes (Finitzo, Albright, and O'Neal Citation1998; Mehl and Thomson Citation2002). Furthermore, the confidence in the screen and perceived importance of follow-up for both the screener and parents may be strengthened by the saliency of a screening failure.
In conclusion, coverage, referral, follow-up and detection rates were aggregated across 42 NHS programmes. Our results show that screening protocol design influences the effectiveness of the NHS programme. The referral rate for step 1 was related to the age of the infants screened. Programmes had lower referral rates from screening to diagnostic assessment if they used aABR or had more screening steps. Many NHS programmes could not provide recent data representing their country or region for these quality measures. Among the reported figures, there was surely inherent variability in the quality and validity of the data supplied, despite working closely with the CRs, verifying all data where possible, and only accepting data that were considered valid. Still, the results of this study relied heavily on the CRs to provide accurate figures based on data from their local programmes, and the quality of the data management system (paper-based, digital, etc.) was not evaluated. Some programmes may collect these data in local hospitals, yet data are not shared nor evaluated on a regional or national level. Most concerningly is that many, even mature programmes, do not monitor or evaluate the performance of their NHS programme. For countries implementing NHS, the only method of ensuring effective use of resources is by collecting data, monitoring and evaluating the performance of the screening programme. Methods to identify areas for improvement, evaluate the selected protocol design, and ensure the effective use of resources should be essential components in all NHS programmes.
| Abbreviations | ||
| aABR | = | automated auditory brainstem response |
| CR | = | country representative |
| dB HL | = | decibel hearing level |
| HI | = | hearing impairment |
| HIC | = | high-income country |
| LIC | = | low-income country |
| LTFU | = | lost/loss to follow-up |
| MIC | = | middle-income country |
| NHS | = | newborn hearing screening |
| NICU | = | neonatal intensive care unit |
| OAE | = | otoacoustic emissions |
| PPV | = | positive predictive value |
TIJA-2020-05-0208-File005.docx
Download MS Word (35.9 KB)TIJA-2020-05-0208-File004.docx
Download MS Word (52.9 KB)Acknowledgements
Members of the EUS€REEN foundation contributed information from their local screening programmes. The following are members of the EUS€REEN Foundation contributing to this work: B. Qirjazi, D. Holzinger, L. Stappaert, B. Vos, F. Brkić, P. Rouev, X. Peng, M. Velepic, C. Thodi, J. Drsata, T. Ovesen, M. Bambus, M. Lepplaan, B. Ellefsen, R. Niemensivu, T. Willberg, F. Denoyelle, P. Matulat, T. Nikolopoulos, A. Gáborján, I. Hinriksdóttir, Z. Chaudhurri, G. Norman, L. Rubin, A. Martini, D. Spanca, M. Audere, S. Kušķe, N. Drazdiene, E. Lesinskas, J.M. Hild, M. Cakar, T. Fenech, W. Mulwafu, D. Chiaburu, T. Kujundžić, E. Zvrko, A. Meuwese, A. Goedegebure, H. Hoeve, V. Nagaraj, G. Greczka, L. Monteiro, M. Georgescu, G. Tavartkiladze, L. Gouma, S. Filipovic, G. Jokovic, L. Langova, I. Sebova, S. Battelino, D.W. Swanepoel, F. Núñez-Batalla, J.M. Sequi-Canet, I. Uhlén, B. Nora, M. Baydan and J. McCall.
Disclosure statement
The authors have no conflicts of interest relevant to this article to disclose.
Additional information
Funding
Related Research Data
References
- Benito-Orejas, J. I., B. Ramirez, D. Morais, A. Almaraz, and J. L. Fernandez-Calvo. 2008. “Comparison of Two-Step Transient Evoked Otoacoustic Emissions (TEOAE) and Automated Auditory Brainstem Response (AABR) for Universal Newborn Hearing Screening Programs.” International Journal of Pediatric Otorhinolaryngology 72 (8): 1193–1201. doi:https://doi.org/10.1016/j.ijporl.2008.04.011.
- Berninger, E., and B. Westling. 2011. “Outcome of a Universal Newborn Hearing-Screening Programme Based on Multiple Transient-Evoked Otoacoustic Emissions and Clinical Brainstem Response Audiometry.” Acta Oto-Laryngologica 131 (7): 728–739. doi:https://doi.org/10.3109/00016489.2011.554440.
- Boshuizen, H. C., G. J. Van Der Lem, D. E. Kauffman, M. A. Boer, G. A. VAN Zanten, A. M. Oudesluys-Murphy, and P. H. Verkerk. 2001. “Costs of Different Strategies for Neonatal Hearing Screening: A Modelling Approach.” Archives of Disease in Childhood. Fetal and Neonatal Edition 85 (3): F177–F181. doi:https://doi.org/10.1136/fn.85.3.f177.
- Bussé, A. M. L., H. L. J. Hoeve, K. Nasserinejad, A. R. Mackey, H. J. Simonsz, and A. Goedegebure. 2020. “Prevalence of Permanent Neonatal Hearing Impairment: systematic Review and Bayesian Meta-Analysis.” International Journal of Audiology 59 (6): 475–485. doi:https://doi.org/10.1080/14992027.2020.1716087.
- Bussé, A. M. L., A. R. Mackey, H. L. Hoeve, A. Goedegebure, G. Carr, I. M. Uhlèn, and H. J. Simonsz. 2021. “Assessment of Hearing Screening Programmes across 47 Countries or Regions I: Provision of Newborn Hearing Screening.” Submitted for Publication.
- Caluraud, S., A. Marcolla-Bouchetemble, A. DE Barros, F. Moreau-Lenoir, E. DE Sevin, S. Rerolle, E. Charriere, et al. 2015. “Newborn Hearing Screening: Analysis and Outcomes after 100,000 Births in Upper-Normandy French Region.” International Journal of Pediatric Otorhinolaryngology 79 (6): 829–833. doi:https://doi.org/10.1016/j.ijporl.2015.03.012.
- Clemens, C. J., and S. A. Davis. 2001. “Minimizing False-Positives in Universal Newborn Hearing Screening: A Simple Solution.” Pediatrics 107 (3): E29. doi:https://doi.org/10.1542/peds.107.3.e29.
- Cumming, G. 2014. “The New Statistics: Why and How.” Psychological Science 25 (1): 7–29. doi:https://doi.org/10.1177/0956797613504966.
- Deem, K. C., E. A. Diaz-Ordaz, and B. Shiner. 2012. “Identifying Quality Improvement Opportunities in a Universal Newborn Hearing Screening Program.” Pediatrics 129 (1): e157–64–e164. doi:https://doi.org/10.1542/peds.2011-0912.
- Finitzo, T., K. Albright, and J. O'Neal. 1998. “The Newborn with Hearing Loss: Detection in the Nursery.” Pediatrics 102 (6): 1452–1460. doi:https://doi.org/10.1542/peds.102.6.1452.
- Gaffney, M., D. R. Green, and C. Gaffney. 2010. “Newborn Hearing Screening and Follow-up: Are Children Receiving Recommended Services?” Public Health Reports *(Washington, D.C. : 1974) 125 (2): 199–207. doi:https://doi.org/10.1177/003335491012500208.
- Januario, G. C., S. M. Lemos, A. A. Friche, and C. R. Alves. 2015. “Quality Indicators in a Newborn Hearing Screening Service.” Brazilian Journal of Otorhinolaryngology 81 (3): 255–263. doi:https://doi.org/10.1016/j.bjorl.2014.08.008.
- Joint Committee on Infant Hearing. 2007. “Year 2007 Position Statement: Principles and Guidelines for Early Hearing Detection and Intervention Programs.” Pediatrics 120: 898–921. doi:https://doi.org/10.1542/peds.2007-2333.
- Kennedy, C., L. Kimm, D. C. Dees, M. Campbell, and A. Thornton. 1998. “Controlled Trial of Universal Neonatal Screening for Early Identification of Permanent Childhood Hearing Impairment.” The Lancet 352: 1957.
- Khoza-Shangase, K., and S. Harbinson. 2015. Evaluation of Universal Newborn Hearing Screening in South African Primary Care. African Journal of Primary Health Care & Family Medicine 7: 769.
- Mehl, A. L., and V. Thomson. 2002. “The Colorado Newborn Hearing Screening Project, 1992–1999: On the Threshold of Effective Population-Based Universal Newborn Hearing Screening.” Pediatrics 109 (1): e7–e7. doi:https://doi.org/10.1542/peds.109.1.e7.
- Neumann, K., S. Chadha, G. Tavartkiladze, X. Bu, and K. R. White. 2019. “Newborn and Infant Hearing Screening Facing Globally Growing Numbers of People Suffering from Disabling Hearing Loss.” International Journal of Neonatal Screening 5 (1): 7. doi:https://doi.org/10.3390/ijns5010007.
- NHS Newborn Hearing Screening Programme 2019. Newborn hearing screening data tables 1 April 2017 to 31 March 2018.
- OECD. 2019. Health at a Glance 2019: OECD Indicators. Average length of stay in hospitals. [Online]. Available: doi:https://doi.org/10.1787/888934017804.
- Olusanya, B. O., O. M. Ebuehi, and A. O. Somefun. 2009. “Universal Infant Hearing Screening Programme in a Community with Predominant Non-Hospital Births: A Three-Year Experience.” Journal of Epidemiology & Community Health 63 (6): 481–487. doi:https://doi.org/10.1136/jech.2008.082784.
- Olusanya, B. O., D. Swanepoel, M. J. Chapchap, S. Castillo, H. Habib, S. Z. Mukari, N. V. Martinez, H.-C. Lin, and B. Mcpherson. 2007. “Progress towards Early Detection Services for Infants with Hearing Loss in Developing Countries.” BMC Health Services Research 7: 14. doi:https://doi.org/10.1186/1472-6963-7-14.
- Patel, H., and M. Feldman. 2011. “Universal Newborn Hearing Screening.” Paediatrics and Child Health 16 (5): 301–310. doi:https://doi.org/10.1093/pch/16.5.301.
- Sloot, F., H. L. Hoeve, M. L. DE Kroon, A. Goedegebure, J. Carlton, H. J. Griffiths, and H. J. Simonsz, EUS€REEN Study Group 2015. “Inventory of Current EU Paediatric Vision and Hearing Screening Programmes.” Journal of Medical Screening 22 (2): 55–64. doi:https://doi.org/10.1177/0969141315572403.
- The World Bank. 2019. World Bank Country and Lending Groups [Online]. The World Bank. Available: https://datahelpdesk.worldbank.org/knowledgebase/articles/906519-world-bank-country-and-lending-groups [Accessed 03-06-2019 2019].
- UNICEF 2019. 2019. Maternal and Newborn Health Coverage Database. November ed.
- Van Dyk, M., D. W. Swanepoel, and J. W. Hall. 2015. “Outcomes with OAE and AABR Screening in the First 48h—Implications for Newborn Hearing Screening in Developing Countries.” International Journal of Pediatric Otorhinolaryngology 79 (7): 1034–1040. doi:https://doi.org/10.1016/j.ijporl.2015.04.021.
- Vohr, Betty R., William Oh, Edward J. Stewart, Judith D. Bentkover, Sandra Gabbard, James Lemons, Lu-Ann Papile, and Ronald Pye. 2001. “Comparison of Costs and Referral Rates of 3 Universal Newborn Hearing Screening Protocols.” Journal of Pediatrics 139 (2): 238–244. doi:https://doi.org/10.1067/mpd.2001.115971.
- Wood, S. A., G. J. Sutton, and A. C. Davis. 2015. “Performance and Characteristics of the Newborn Hearing Screening Programme in England: The First Seven Years.” International Journal of Audiology 54 (6): 353–358. doi:https://doi.org/10.3109/14992027.2014.989548.
- World Health Organization. 2015. Ear and Hearing Care: Planning and Monitoring of National Strategies: A Manual. Geneva, Switzerland.
- World Health Organization. 2019. First dose of diphtheria toxoid, tetanus toxoid and pertussis vaccine [Online]. Available: https://apps.who.int/immunization_monitoring/globalsummary/timeseries/tscoveragedtp1.html [Accessed April 28 2020].