
Abstract
Objective
To investigate transcranial transmission (TT) and the dampening effect of the skin in patients and cadaver heads.
Design
In patients a pure tone bone conduction audiogram for ipsilateral and contralateral stimulation was performed. The TT was defined as the difference between ipsilateral and contralateral hearing thresholds. In cadaver heads ipsilateral and contralateral promontory motion was measured using a three-dimensional Laser Doppler Vibrometer system.
Study sample
Seven single-sided deaf patients fitted with a Baha® Connect, fifteen single-sided deaf patients without a bone conduction hearing aid and five Thiel-embalmed cadaver heads were included.
Results
The TT decreased with increasing frequency in patients and cadaver heads. No significant difference was seen between patients and cadaver heads. Measurements on patients and cadaver heads showed increasing skin attenuation with increasing frequency. However, the dampening effect was 3–12 dB higher in patients than in cadavers at all frequencies.
Conclusion
The TT was not significantly different for patients compared to cadaver heads. The value of promontory motion to estimate TT in patients need to be further evaluated. The skin attenuates a BC stimulus by 10–20 dB in patients and by a smaller amount in cadaver heads, probably due to changes in the properties of the Thiel-conserved skin.
Introduction
Bone conduction (BC) is an alternative pathway to air conduction. This pathway may be used for stimulation in patients with conductive or mixed hearing loss, and for patients with single-sided deafness (SSD) using a bone conduction hearing aid (BCHA). Single-sided deafness leads to impaired binaural hearing, which is needed for sound localisation (Tyler et al. Citation2003) and for better understanding in a noisy environment by improving signal-to-noise ratio (SNR) threshold (Sargent et al. Citation2001; Tyler et al. Citation2003). One of the reasons for this impaired binaural hearing is the head shadow effect, where the head forms a physical barrier, attenuating sound. The attenuation is as much as 20 dB at high frequencies and is only 3–6 dB at low frequencies. One aim of a BCHA is to overcome the head shadow effect by transmitting sound from the impaired side to the hearing side. The transmission of sound by BC stimulation is reduced with increasing frequency. This reduction in the transcranial transmission (TT) shows a plateau around 3–4 kHz ranging from 20 to 40 dB and then drops, with the interindividual variability being 35 dB (Dobrev et al. Citation2019; Snapp et al. Citation2016; Stenfelt Citation2012). Because the head is reasonably symmetrical, the TT will be the same from the ipsilateral to the contralateral side as from the contralateral to the ipsilateral side if the same area is being stimulated (Stenfelt Citation2012). Measurement of TT before fitting a BCHA can give some information about the expected benefit. However, it cannot currently be used as a general preoperative assessment tool (Snapp et al. Citation2016).
Multiple studies have investigated TT in cadaver heads, but only a few have compared these data to patients. Stenfelt (Citation2012) measured TT in patients and compared his findings to vibration measurements in human cadaver heads (Stenfelt Citation2012). He found comparable TT between 0.8 and 6 kHz. Eeg-Olofsson et al. (Citation2013) measured promontory motion with a Laser Doppler Vibrometer (LDV) and obtained hearing thresholds (HTs) in patients for ipsilateral and contralateral stimulation. They found high variability and low correlation of the two types of measurements at the individual level. However, they concluded that human hearing levels can be estimated from promontory vibration on a group level.
Two major parameters affecting BC transmission are the geometric proximity of the source to the cochleae and skin dampening. Ipsilateral promontory motion (PM) increases with proximity of the stimulation to the ipsilateral cochlea in cadaver heads (Dobrev et al. Citation2018; Eeg-Olofsson et al. Citation2008), while having little effect on the contralateral side (Rigato et al. Citation2019; Stenfelt and Goode Citation2005). The same was found in living patients based on measurement of hearing thresholds (Reinfeldt et al. Citation2014). The skin has a negative effect on BC transmission because it dampens the stimulus as much as 20 dB, slightly more on the contralateral side and especially at higher frequencies (Chang and Stenfelt Citation2019; Håkansson, Tjellström, and Rosenhall Citation1984, Citation1985). The objectives of this study were 1) to determine if the TT in patients (defined as the difference between contralateral and ipsilateral HTs) is comparable to TT in cadaver heads (defined as the difference of contralateral and ipsilateral promontory vibration); 2) to examine how TT varies with stimulation frequency; and 3) to investigate the dampening effect of the skin by comparing percutaneous (PC) and transcutaneous (TC) BC stimulation in patients and cadaver heads. This would first, allow us to have a better understanding of how experimental work translates to patients. Second, having more knowledge on the effect of skin dampening helps us to advise patients, who test a BC hearing aid on a headband before implantation of a transcutaneous system.
Materials and methods
Patients
This study was approved by the institutional ethics committee (Swissethics 2016-01-05-0). A retrospective chart review was performed to identify patients from the Department of ENT, Head and Neck Surgery at University Hospital Zürich, who met specific inclusion criteria. Patients were included who 1) were 18 years and older; 2) had single-sided deafness defined as BC hearing thresholds (HTs) of >50 dB HL for frequencies 0.25–4 kHz and normal hearing defined as HTs of <20 dB HL for frequencies 0.25–4kHz on the contralateral side; 3) had either no hearing device or a Baha® Connect (Cochlear Bone Anchored Solution®, Sweden); 4) were implanted between September 2000 and May 2019; and 5) were able to consent and provide written approval. The patients were assigned to one of two groups: no hearing device (“No-device”) group or Baha® Connect (“Baha”) group.
In all patients, a pure tone BC audiogram was performed in combination with a routine check-up. The “No-device” group consisted of 15 patients (8 women, 7 men) ages 28–65 years (mean 48 years). A total of 16 patients, which were implanted between September 2000 and May 2019, qualified for the “Baha” group. However, four had no interest in the study, two had died, one person was not reachable, and one person had the Baha explanted. Furthermore, one participant with a Baha Attract had to be excluded. As a result, there were four women and three men in the “Baha” group ages 47–74 years (mean 57 years).
Measurements of hearing thresholds in patients
A pure tone BC audiogram was obtained with 5 dB steps at frequencies of 0.25, 0.5, 0.75, 1, 1.5, 2, 3, 4, and 6 kHz for all patients, with ipsilateral and contralateral stimulation delivered by an Interacoustics Equinox 2.0 audiometer (Interacoustics®, Denmark) in a sound-isolated booth. A calibrated B-71 (Radioear®, Denmark) transducer was used in all patients, supported on the mastoid with a 5-Newton steel headband, without touching the pinna (i.e. transcutaneous coupling, TC). The software used was Affinity Suite (version 2.6.0, Interacoustics®, Denmark). The B-71 was calibrated as a standard procedure with the available audiometric equipment.
Additionally, the same measurement procedure was executed in the “Baha” group (n = 7), using a Baha 5 transducer (Cochlear Bone Anchored Solution®, Sweden) coupled to the mastoid via a 5-Newton steel headband (i.e. transcutaneous coupling, TC), first applied on the ipsilateral side, then the contralateral side. The Baha 5 transducer was controlled via a computer, using the NOAH programming interface (version 4.9.1, HIMSA®, Denmark) with Cochlear™ Fitting Suite (version 1.4.16875.1, Cochlear Bone Anchored Solution®, Sweden) and Noahlink wireless connection (HIMSA®, Denmark) for communication with the sound processor. For stimulation, the Baha was calibrated against an artificial mastoid (Type 4930, Brüel & Kjaer, Denmark) after the completion of all measurements.
The measurement procedure with the Baha 5 transducer was repeated with a stimulation via the patient’s BI300 implant (i.e. percutaneous coupling, PC), at its typical location on the contralateral side. The factory calibration of the specific Baha device was used for the PC stimulation. The TC and PC HT data, for Baha stimulation on the contralateral side, was used to assess the transmission through the skin. However, it should be noted that this approach also includes an effect from the change in stimulation location (mastoid vs. BAHA location) and is discussed in the Discussion section “Skin attenuation”.
Since only the relative difference in response under PC versus TC was of interest no calibration of the absolute level of the Baha stimulation was used for the skin attenuation calculation, and any calibrated data was used only for display purposes. The Baha stimulation level was kept unchanged for both coupling conditions, and stimulation locations and coupling were controlled by an audiologist. Based on the hypothesis of a linear response of the BC (Hakansson et al. Citation1996), it is assumed that the normalised responses (TT and skin attenuation) are independent of differences in absolute level of stimulation.
Cadaver heads
An equivalent measurement procedure was applied to a set of 5 Thiel-embalmed cadaver heads, details of which have been described by Dobrev et al. (Citation2019). Before measurements, the tympanic membrane was lifted up to provide access to the promontory, and the BI 300 was placed at its typical location. Measurements always started with the TC stimulation on the mastoid, followed by PC stimulation at the Baha location, 5 cm posterior of the external auditory canal. The motions of both the ipsilateral and contralateral promontories were measured sequentially by moving the 3 D LDV in a repetitive manner via a robotic arm, in the frequency range 0.1–10 kHz, with approximately 50 frequencies per decade. Measurements always started on the ipsilateral side. The cadaver heads were oriented in a natural upright position (Dobrev et al. Citation2018, Citation2019, Citation2020). For each stimulation frequency, the promontory motion was measured using a single point 3-dimensional (3 D) LDV (3 D CLV 3000 by Polytec GmbH), providing the time waveform of three orthogonal velocity components, from which the corresponding acceleration components were calculated. For comparison with the patient data, the promontory data were averaged in bandwidths of approximately 1–2 octaves around the HT test frequencies. For example, for a frequency of 0.25 kHz measured in patients, an average of all measured frequencies from 0.125 to 0.372 kHz in cadaver heads was calculated. The highest frequency used from cadaver heads data was 6.685 kHz.
Comparison of cadaver heads and patients
Hearing thresholds in patients were compared to vibration of the promontory in cadaver heads. Stimulus intensity for measurement of HT in patients and PM in cadaver heads differed. Therefore, their comparison was done under the assumption that the promontory response is linear with stimulation level (Hakansson et al., 1996). Furthermore, the HTs were in dB HL whereas the PM was in dB relative to 1 mm/s. This allowed comparison of trends but not absolute values. Since TT and skin attenuation are relative metrics (unitless ratios of two values), they allowed for direct comparisons of data between cadaver heads and patients.
Transcranial transmission (TT)
When the TT ratio is expressed in decibels (0 dB = 1), a negative TT value indicates an attenuation, namely a better response (HL or PM) on the stimulation side than on the contralateral side. In SSD patients, the stimulation is applied on the contralateral side (containing the non-functioning cochlea), inducing stimulation on the ipsilateral side (the hearing side), by transmitting sound though the skull bone and contents.
In order to measure the transcranial transmission in patients, the actuator was sequentially moved from the contralateral side (the non-functioning or acoustically masked cochlea) to the ipsilateral side (hearing ear) in patients, and HT was measured in each stimulation condition. The corresponding TT was calculated as the ipsilateral HT minus the contralateral HT, as scaled in dB. The TT metrics, under the B-71 stimulation, were calculated for the “Baha” group (n = 7) and the “No-device” group (n = 15), for a total of 22 patients.
In contrast, in cadaver heads, ipsilateral and contralateral promontory vibration was measured sequentially, without changing the positioning of the actuator from its ipsilateral location. The corresponding TT in cadaver heads was calculated, as the contralateral (opposite to stimulation side) PM minus the ipsilateral (at the stimulation side) PM, as scaled in dB.
The procedural difference was due to the fact that the cadaver head measurements were part of a larger measurement campaign, where multiple coupling methods and stimulation locations were involved, restricting repositioning of the actuator from ipsi- to contralateral side (Dobrev et al. Citation2019, Citation2020). The measurement position on both promontories was controlled within 1 mm (via a retroreflective target < 1 mm2) and the measurement orientation was controlled within 5 deg via a robot arm, holding the 3 D LDV, and the anatomical orientation of the ear canal (Dobrev et al. Citation2019). In addition, during preliminary tests, several points across each promontory area were measured, indicating negligible difference (<1dB) in response across each promontory. Thus, it is assumed that there are no significant effects of preparation of the measurement area on the promontory response. Based on the low variability of the response across each promontory and the repeatability in the positioning of the 3 D LDV, it was assumed that moving the actuator position was considered a greater contributor to experimental variability than moving the 3 D LDV, especially in the case of TC coupling (via 5-N steel headband at the mastoid).
Skin attenuation
The skin attenuation in patients was defined by the difference in BC HT for contralateral TC (via a 5-N steel headband at the mastoid) versus PC (via the BI300 implant at the Baha location) stimulation. To make measurements between patients and cadaver heads comparable, skin attenuation in cadaver heads was defined in an equivalent way. Namely, the attenuation was defined as the difference in contralateral promontory motion (in dB) with stimulation via TC on the mastoid versus via PC at the Baha location.
Statistical analysis
Microsoft Excel 2019 was used for the statistical analysis. Means and standard deviations were calculated. When comparing measurements based on patients from the same patient group or cadaver heads alone, a paired test could be used, in particular the two-sided paired t-test. When comparing measurements across data sets (i.e. cadaver heads vs. patients, or patients of different groups), an unpaired test was used. Based on literature (Dobrev et al. Citation2018, Citation2019, Citation2020; Eeg-Olofsson et al. Citation2013, Citation2008; Stenfelt and Goode Citation2005) the intersample variability is different between patients (about 7–13 dB SD) and cadaver heads (about 3–7 dB SD), thus it was assumed that the two data sets exhibited different variances. This behaviour is also seen in the current data, shown in , and indicated in the Results section. Thus, an unpaired heteroscedastic t-test was used for comparison between the two cadaver heads and patients sets.
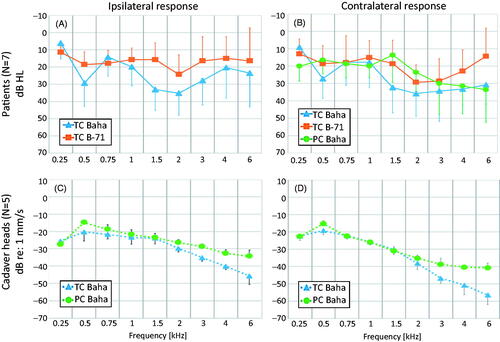
Figure 1. Means and standard deviations (error bars) for hearing thresholds and promontory movement for ipsilateral (A, C) and contralateral (B, D) stimulation in the “Baha” group patients (A, B) and cadaver heads (C, D). TC Baha: Transcutaneous stimulation with a Baha transducer. TC B-71: Transcutaneous stimulation with a B-71 transducer. PC Baha: Percutaneous stimulation with a Baha transducer.
A p value of <0.05 was originally selected as a threshold for statistical significance for all tests. However, since each statistical test was repeated on 9 frequencies for each comparison, the threshold for statistical significance was adjusted by the number of frequencies, based on the Bonferroni correction. This resulted in 0.006 as the maximum for statistical significance.
Results
Patients and cadaver heads responses
Ipsilateral and contralateral responses were evaluated to show differences between patients and cadaver heads, as well as between transducer and attachment types. shows an overview of the averaged data for each sample group, coupling and stimulation condition, before any further normalisation (i.e. TT or skin attenuation).
It can be seen, in , that both the ipsilateral and contralateral TC stimulation with Baha transducer induced comparable HTs relative to the corresponding response with B-71. This is not aimed at comparing the two actuators, but only to give an overview of the stimulation levels, when collecting the data shown throughout the rest of the figures. All further processing is based on relative difference (in dB) in the promontory motion or HL, between coupling conditions (i.e. TC vs. PC) and stimulation/measurement locations (i.e. ipsi- vs contralateral). Thus, based on the hypothesis of a linear response under BC (Hakansson et al. Citation1996), it is assumed that such normalised responses are independent of any potential differences in absolute level of stimulation between devices.
The promontory motion data in cadaver heads () showed a trend for reduction in the response with higher frequencies, for both coupling conditions and measurement sides, all with ipsilateral stimulation with a Baha. Furthermore, the cadaver head data demonstrated an increasing difference in the promontory response between transcutaneous and percutaneous coupling with increasing frequencies. The PC stimulation induced higher PM than TC at frequencies around 0.5 kHz, and above 1.5 kHz. At 6 kHz, the PM with PC was up to 10 dB higher on the ipsilateral side and up to 15 dB higher on the contralateral side, than with TC.
Transcranial transmission (TT)
Transcranial transmission with transcutaneous coupling
A trend towards decreasing TT with higher frequencies in patients and cadaver heads for TC stimulation with the Baha 5 is shown in . A heteroscedastic unpaired t-test showed no significant difference in TT between patients and cadaver heads. The cadaver head data showed a significant (p ≤ 0.006) gain at 0.25 kHz and a slight gain at 0.5 kHz. The TT decreased with frequency up to 3 kHz, and then levelled out at higher frequencies. This resulted in a significant (p ≤ 0.006) attenuation in the rage of 1.5–4 kHz. In patients, a small gain was observed at 0.5 and 1 kHz, with a trend for a decrease in TT above 1 kHz. The decrease continued up to 4 kHz, followed by an increase at 6 kHz. Patients showed up to 8 dB higher TT than cadaver heads in the frequency range of 1–3 kHz, with the Baha transducer; however, this difference was not statistically significant (Supplementary table 1).
Figure 2. Comparison of transcranial transmission (TT) in patients and cadaver heads for TC stimulation. Standard deviations are indicated as error bars in a single direction for each data set. TC Baha Patients: Transcutaneous stimulation with a Baha transducer in patients. TC Baha Cadaver heads: Transcutaneous stimulation with a Baha transducer in cadaver heads.
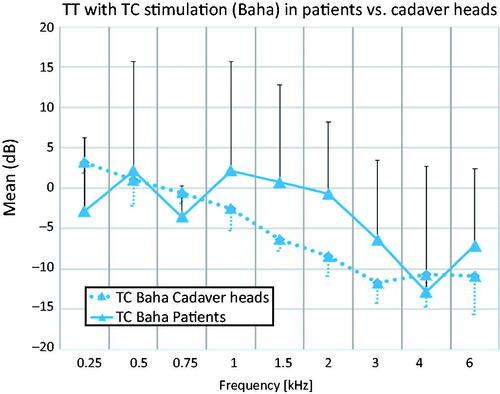
The interindividual variation in TT in patients was on average up to 30.5 dB across frequencies, with up to 50 dB at a single frequency, based on the maximum difference between individual patients. In cadaver heads, the interindividual variation in TT was smaller, with an average of 6.2 dB and a maximum of 10.2 dB at a single frequency.
Differences in TT between patient groups
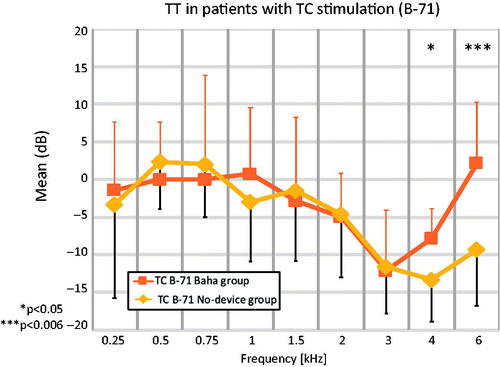
There was a significant (p ≤ 0.006) difference between patient groups at 6 kHz. For stimulation with the B-71 over the mastoid (), there was a plateau from 0.25 kHz to 1 kHz and then a continuous decrease in TT up to 3 kHz for both the “Baha” and the “No-device” patient groups, with a small gain at 6 kHz for the “Baha” group. shows a range of 10 dB from 0.25–1.5 kHz, within the means of the “Baha” group and the “No-device” group lie. Between 1.5 and 3 kHz, TT decreased, and then increased at 6 kHz. For the frequencies 0.75, 1.5, 3, and 6 kHz there are missing threshold values in three patients from the “No-device” group, resulting in n = 12 of unique samples for these frequencies (Supplementary table 2). However, missing data at these frequencies were estimated by linear interpolation of the available data at neighbouring frequencies. The interpolated data was then used for statistical analysis across all patients (n = 15) at all frequencies.
Figure 3. Means for TT in patients for TC stimulation with a B-71 transducer. Significant differences (p ≤ 0.006) are marked with ***. Standard deviations (error bars) are indicated in a single direction. TC B-71 Baha group: Transcutaneous stimulation with a B-71 transducer in the “Baha” group (n = 7). TC B-71 No-device group: Transcutaneous stimulation with a B-71 transducer in the “No-device” group (n = 15).
Skin attenuation
The skin attenuation in patients and cadaver heads, was measured as the contralateral response (dB HL for patients and dB PM for cadaver heads) for TC stimulation at the mastoid versus PC stimulation at the BAHA location. When collecting the patient data, used to calculate skin attenuation, only the relative difference in response under TC versus PC was of interest, for Baha stimulation. Thus, no calibration of the Baha was applied in the calculations, since the stimulation level was kept same for both coupling conditions. This is illustrated in , where TC and PC patient data are shown, using the Baha’s PC calibration for both, for comparison purposes only.
Figure 4. Comparison of TC and PC response (A) in patients and corresponding skin attenuation (B) in patients versus cadaver heads, all under Baha stimulation. In (A), the y-axis shows dB HL based on PC Baha calibration. In (B), the y-axis shows TC contralateral PM or HL relative to PC contralateral PM or HL. All data is shown as means and standard deviations. Significant differences (p ≤ 0.006) between patients and cadaver heads are marked with ***.
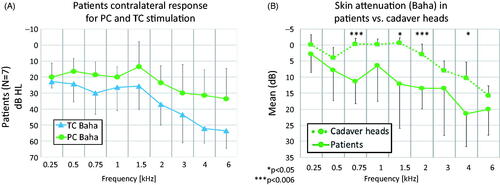
Positive values of skin attenuation (lower on the y-axis of ) correspond to negative transmission through the skin, namely worse HL for TC than PC, under the same Baha stimulation level. Patients and cadaver heads showed a similar trend of increasing skin attenuation with increasing frequency above 1.5 kHz (). Such a trend is also visible to a limited extend (−7 dB to −3 dB) at low frequencies in cadaver heads (0.5 kHz) and patients (0.25–0.75 kHz). The skin attenuation was significant (p ≤ 0.006) at 3 and 6 kHz for cadaver heads, and at 0.75 and 2, 4 and 6 kHz for patients. Overall, the patients had 3–12 dB stronger skin attenuation than the cadaver heads at all frequencies. The difference between the two data sets was significant (p ≤ 0.006) at 0.75 kHz and 2 kHz. The interindividual variability for skin attenuation in patients was 27.2 dB on average, with a maximum of 40 dB at a single frequency. In cadaver heads, the variation was smaller, with 6.6 dB on average and a maximum of 11.9 dB at a single frequency (Supplementary table 3).
Discussion
In this study, the ipsilateral and contralateral hearing thresholds of patients were compared to the vibrational responses of the promontory in cadaver heads for different attachment and stimulation types. Based on these data, differences in TT and skin attenuation were analysed and compared for patients and cadaver heads.
Comparison of patient responses
For ipsilateral stimulation, it was found () that HTs in patients with TC B-71 stimulation showed only small changes (within ±5dB on average) over the measured frequency range, corresponding to the findings of others (Eeg-Olofsson et al. Citation2008). In contrast, under contralateral stimulation with B-71, there was a trend for larger variations (within ±10 dB on average) with different frequencies in the patients’ response.
Overall, the Baha TC stimulation produced 5–10 dB higher HTs above 1 kHz, for both stimulation sides, relative to B-71 stimulation. This has been observed by others for the Baha on a soft band (Snapp, Morgenstein, and Kuzbyt Citation2019) or the Baha attract system at high frequencies (Kurz et al. Citation2014). This could be due to differences in the Baha output during calibration on the artificial mastoid, relative to its output on patients.
Comparison of cadaver head responses
In cadaver heads, PM on both sides decreased with increasing frequency () as described by others (Eeg-Olofsson et al. Citation2008; Roosli et al. Citation2016). Promontory motion in cadaver heads was larger for PC stimulation compared to TC stimulation (), which was confirmed by a previous study based on a finite element model of a whole human head (Chang and Stenfelt Citation2019). Such observations were also shown in patients for contralateral stimulation by Snapp, Morgenstein, and Kuzbyt (Citation2019) who used the same study design.
A larger difference between PC and TC stimulation for contralateral responses can be seen in cadaver heads at and above 3 kHz (). A previous study also showed increasing thresholds above 3 kHz reaching almost 40 dB HL at 6 kHz for contralateral stimulation (Kurz et al. Citation2014).
The increasing difference between PC and TC stimulation on the contralateral response with higher frequencies seems to be more dependent on coupling than location. Previous studies found that contralateral PM for PC stimulation depends on stimulation location in cadaver heads with smaller PM below 1 kHz when stimulation is on the ipsilateral mastoid compared to stimulation on the parietal bone (Eeg-Olofsson, Stenfelt, and Granström Citation2011). This indicates that stimulation location has some effect below 1 kHz, but no significant difference could be shown. Above 1 kHz, the stimulus location had no effect on PM. Therefore, it can be assumed that PC stimulation on the mastoid corresponds to PC stimulation on the BAHA location in the high frequencies. Hence, to assess the effect of skin attenuation, promontory motion with TC stimulation on the mastoid can be compared with PC stimulation at the BAHA location.
Transcranial transmission
Transcranial transmission with transcutaneous coupling
The general trend in TT was qualitatively consistent for both patients and cadaver heads (), as well as for different patient groups (). There were, however, quantitative differences between cadaver heads and patients, at very low (250 Hz) and mid frequencies (1–3 kHz) ().
At low frequencies, there was a significant transcranial gain in the PM of cadaver heads (0.25 Hz). There was, however, only a trend ( and ) for a transcranial gain in HTs of patients. Previous studies described a transcranial gain at low frequencies in cadaver heads (Dobrev et al. Citation2018, 2019; Stenfelt and Goode Citation2005), as well as in patients (Eeg-Olofsson, Stenfelt, and Granström Citation2011; Stenfelt Citation2012).
At mid frequencies (1–3 kHz), there was a trend for decreasing TT (). At high frequencies (≥4 kHz), the TT for TC stimulation with a Baha or B-71 increased in patients from 4–6 kHz ( and ). This effect is much more pronounced in the “Baha” group using the B-71 transducer (). Similar trends for TT were reported for cadaver heads starting at 1 kHz, as in our measurements (Rigato et al. Citation2019; Stenfelt and Goode Citation2005) and patients, showing increasing TT starting above 2 kHz (Stenfelt Citation2012). In contrast, Eeg-Olofsson et al. (Citation2013) found no statistically significant differences above 2 kHz, when comparing the contralateral parietal location to the ipsilateral parietal location. A difficulty in comparing results between studies is the stimulation location, as the ipsilateral location could influence the TT as much as 10–20 dB, as reported in the literature (Eeg-Olofsson et al. Citation2008; Huber et al. Citation2013; Reinfeldt et al. Citation2014; Rigato et al. Citation2019; Stenfelt Citation2012).
Furthermore, TT values showed high variability between patients, but less variability in cadaver heads. This is partially because, for data at each audiometric frequency, cadaver head data at several neighbouring frequencies were averaged. Moreover, for the cadaver heads, ipsilateral and contralateral sides were measured sequentially without moving the actuator.
While there were qualitative differences, there were no significant differences in TT for TC stimulation () between cadaver heads and patients. This is supported by literature (Eeg-Olofsson et al. Citation2013), where a correlation between PM and HT on a group level, but not on an individual level, has been described. This suggests that the relative PM (i.e. ipsi- versus contralateral) in cadaver heads is representative of relative HTs in patients, on a group level, under equivalent stimulation (e.g. TC stimulation with a Baha transducer). Thus, intraoperative PM measurements could be useful to quantitatively assess the coupling and optimal attachment site of a BCHA.
Differences in TT between patient groups
Our TT () data showed a significant (p ≤ 0.006) difference between patient groups at 6 kHz, with a trend (p < 0.05) for increasing difference above 3 kHz. The reason of this difference remains unclear. The plasticity of the brain may be one reason. Previous studies found an improvement with Baha and Bonebridge systems 6 and 12 months postoperative. They reported a decrease in SNR of up to 3.9 dB using the Oldenburger sentence test (Laske et al. Citation2015) or the Hearing in Noise Test (Linstrom, Silverman, and Yu Citation2009). Another reason could be the improvement of device fitting over time, or a learning effect. Therefore, these findings must be interpreted with care due to the low number of subjects in our study, and further confirmation is required with large patient groups.
Skin attenuation
Our study aimed to investigate differences in responses (HTs or PM) between PC and TC stimulation. Promontory motion in cadaver heads and HTs in patients showed similar trends () for PC and TC stimulation with increasing attenuation above 1.5 kHz (). However, HTs in patients demonstrated 3–10dB higher skin attenuation (negative transmission values) for all frequencies. Prior studies indicated lower TT at higher frequencies (>4 kHz) at the mastoid compared to the Baha location (Dobrev et al. Citation2018; Stenfelt Citation2012).
It should be noted that stimulation location for the TC (softband at mastoid) and the PC (BI300 at BAHA location) stimulation was different. This could have caused an influence of not only the skin, but also the relative distance to the cochlea and differences in the point mechanical impendace (Reinfeldt et al. Citation2013). However, Stenfelt and Goode (Citation2005), in their work with fresh cadaver heads, have shown that, under the same PC coupling (via an implanted screw), stimulation on the BAHA and the mastoid showed only 1–4 dB difference in the contralateral response, given the same amount of input force. Such observations were qualitatively confirmed in live human subjects by Stenfelt (Citation2012), showing 1–6 dB difference in the transracial attenuations for stimulation at the BAHA position via a BI300 versus stimulation at the mastoid via a steel band. Thus, it is hypothesised that the observed 5–20 dB difference in attenaution is mainly caused by increased skin attenuation in patients, relative to Thiel-embalmed cadaver heads.
Hearing thresholds for PC stimulation in patients in this study are comparable to those of previous studies, which reported 10–20 dB better thresholds above 1.5 kHz compared to the TC transmission (Eeg-Olofsson et al. Citation2008; Reinfeldt et al. Citation2014; Rigato et al. Citation2019; Stenfelt Citation2012). In particular, PC BC in patients shows as much as 10 dB better hearing sensitivity up to 1.5 kHz, while from 1.5–6 kHz the difference increases to 20 dB compared to TC transmission (Håkansson, Tjellström, and Rosenhall Citation1984, Citation1985; Kurz et al. Citation2014; Snapp, Morgenstein, and Kuzbyt Citation2019; van Barneveld et al. Citation2018).
It is hypothesised that a factor influencing the skin attenuation is the Thiel embalming technique, which has proven useful for studying human middle ear mechanics (Guignard et al. Citation2013; Stieger et al. Citation2012). The effect it has on human soft tissue, however, has to be further researched. A recent study investigated this effect and supported the theory of increased collagen crosslinking in human soft tissue, thus potentially making it stiffer and with less damping (Zwirner et al. Citation2019). Zwirner et al. concluded that Thiel-embalmed soft tissue may not sufficiently imitate the biomechanics of living human soft tissue.
Conclusions
Transcranial transmission with transcutaneous stimulation shows a similar trend in patients and cadaver heads: decreasing TT with increasing frequency. No significant differences in transmission between patients and cadaver heads were found. However, due to the low number of cadaver head measurements, no correlation analysis was made. Single-sided deaf patients fitted with an implanted Baha had significantly better TT (less attenuation), for TC stimulation with a B-71 transducer, at higher frequencies compared to SSD patients with no device. The reason for this finding remains unclear and needs to be further investigated in a larger patient population. The skin attenuates the BC stimulus by 10–20 dB in patients. Cadaver heads have about 10 dB less attenuation across mid and high frequencies, which may be due to the embalming method, which alters skin and soft tissue characteristics.
Supplementary files.docx
Download MS Word (22.9 KB)Acknowledgements
Thanks to Dr. rer. biol. hum. Bernd Strauchmann, Head of CI-Center Audiology at the University Hospital Zürich, for his technical support. Thanks to Maggy Kunz, audiometrist at the University Hospital Zürich, for the logistical support.
Disclosure statement
The authors declare that there are no conflicts of interest.
Additional information
Funding
References
- Chang, Y., and S. Stenfelt. 2019. “Characteristics of Bone-Conduction Devices Simulated in a Finite-Element Model of a Whole Human Head.” Trends in Hearing 23: 2331216519836053. doi:https://doi.org/10.1177/2331216519836053.
- Dobrev, I., T. S. Farahmandi, J. H. Sim, F. Pfiffner, A. M. Huber, and C. Röösli. 2020. “Dependence of Skull Surface Wave Propagation on Stimulation Sites and Direction under Bone Conduction.” The Journal of the Acoustical Society of America 147 (3): 1985–2001. doi:https://doi.org/10.1121/10.0000933.
- Dobrev, I., J. H. Sim, F. Pfiffner, A. M. Huber, and C. Röösli. 2018. “Performance Evaluation of a Novel Piezoelectric Subcutaneous Bone Conduction device.” Hearing Research 370: 94–104. doi:https://doi.org/10.1016/j.heares.2018.10.003.
- Dobrev, I., J. H. Sim, F. Pfiffner, A. M. Huber, and C. Röösli. 2019. “Experimental Investigation of Promontory Motion and Intracranial Pressure following Bone Conduction: Stimulation Site and Coupling Type Dependence.” Hearing Research 378: 108–125. doi:https://doi.org/10.1016/j.heares.2019.03.005.
- Eeg-Olofsson, M., S. Stenfelt, and G. Granström. 2011. “Implications for Contralateral Bone-Conducted Transmission as Measured by Cochlear Vibrations.” Otology & Neurotology : Official Publication of the American Otological Society, American Neurotology Society [and] European Academy of Otology and Neurotology 32 (2): 192–198. doi:https://doi.org/10.1097/MAO.0b013e3182009f16.
- Eeg-Olofsson, M., S. Stenfelt, H. Taghavi, S. Reinfeldt, B. Håkansson, T. Tengstrand, and C. Finizia. 2013. “Transmission of Bone Conducted Sound – Correlation Between Hearing Perception and Cochlear Vibration.” Hearing Research 306: 11–20. doi:https://doi.org/10.1016/j.heares.2013.08.015.
- Eeg-Olofsson, M., S. Stenfelt, A. Tjellström, and G. Granström. 2008. “Transmission of Bone-Conducted Sound in the Human Skull Measured by Cochlear Vibrations.” International Journal of Audiology 47 (12): 761–769. doi:https://doi.org/10.1080/14992020802311216.
- Guignard, J., C. Stieger, M. Kompis, M. Caversaccio, and A. Arnold. 2013. “Bone Conduction in Thiel-Embalmed Cadaver Heads.” Hearing Research 306: 115–122. doi:https://doi.org/10.1016/j.heares.2013.10.002.
- Håkansson, B., A. Tjellström, and U. Rosenhall. 1984. “Hearing Thresholds with Direct Bone Conduction Versus Conventional Bone Conduction.” Scandinavian Audiology 13 (1): 3–13. doi:https://doi.org/10.3109/01050398409076252.
- Håkansson, B., A. Tjellström, and U. Rosenhall. 1985. “Acceleration Levels at Hearing Threshold with Direct Bone Conduction versus Conventional Bone Conduction.” Acta Oto-Laryngologica 100 (3-4): 240–252. doi:https://doi.org/10.3109/00016488509104786.
- Hakansson, B., P. Carlsson, A. Brandt, and S. Stenfelt. 1996. “Linearity of Sound Transmission Through the Human Skull In Vivo.” The Journal of the Acoustical Society of America 99 (4 Pt 1): 2239–2243. doi:https://doi.org/10.1121/1.415411.
- Huber, A. M., J. H. Sim, Y. Z. Xie, M. Chatzimichalis, O. Ullrich, and C. Röösli. 2013. “The Bonebridge: Preclinical Evaluation of a New Transcutaneously-Activated Bone Anchored Hearing Device.” Hearing Research 301: 93–99. doi:https://doi.org/10.1016/j.heares.2013.02.003.
- Kurz, A., M. Flynn, M. Caversaccio, and M. Kompis. 2014. “Speech Understanding with a New Implant Technology: A Comparative Study with a New Nonskin Penetrating Baha System.” BioMed Research International 2014: 416205 doi:https://doi.org/10.1155/2014/416205.
- Laske, R. D., C. Röösli, F. Pfiffner, D. Veraguth, and A. M. Huber. 2015. “Functional Results and Subjective Benefit of a Transcutaneous Bone Conduction Device in Patients with Single-Sided Deafness.” Otology & Neurotology 36 (7): 1151–1156. doi:https://doi.org/10.1097/MAO.0000000000000791.
- Linstrom, C. J., C. A. Silverman, and G. P. Yu. 2009. “Efficacy of the Bone-Anchored Hearing Aid for Single-Sided Deafness .” The Laryngoscope 119 (4): 713–720. doi:https://doi.org/10.1002/lary.20164.
- Reinfeldt, S., B. Håkansson, H. Taghavi, and M. Eeg-Olofsson. 2014. “Bone Conduction Hearing Sensitivity in Normal-Hearing Subjects: Transcutaneous Stimulation at BAHA vs BCI Position.” International Journal of Audiology 53 (6): 360–369. doi:https://doi.org/10.3109/14992027.2014.880813.
- Reinfeldt, S., S. Stenfelt, and B. Håkansson. 2013. “Estimation of Bone Conduction Skull Transmission by Hearing Thresholds and Ear-Canal Sound Pressure.” Hearing Research 299: 19–28. doi:https://doi.org/10.1016/j.heares.2013.01.023.
- Rigato, C., S. Reinfeldt, B. Håkansson, K. J. Fredén Jansson, E. Renvall, and M. Eeg-Olofsson. 2019. “Effect of Transducer Attachment on Vibration Transmission and Transcranial Attenuation for Direct Drive Bone Conduction Stimulation.” Hearing Research 381: 107763. doi:https://doi.org/10.1016/j.heares.2019.06.006.
- Roosli, C., I. Dobrev, J. H. Sim, R. Gerig, F. Pfiffner, S. Stenfelt, and A. M. Huber. 2016. “Intracranial Pressure and Promontory Vibration with Soft Tissue Stimulation in Cadaveric Human Whole Heads.” Otology & Neurotology : Official Publication of the American Otological Society, American Neurotology Society [and] European Academy of Otology and Neurotology 37 (9): e384–e390. doi:https://doi.org/10.1097/MAO.0000000000001121.
- Sargent, E. W., B. Herrmann, C. S. Hollenbeak, and A. E. Bankaitis. 2001. “The Minimum Speech Test Battery in Profound Unilateral Hearing loss.” Otology & Neurotology : Official Publication of the American Otological Society, American Neurotology Society [and] European Academy of Otology and Neurotology 22 (4): 480–486. doi:https://doi.org/10.1097/00129492-200107000-00012.
- Snapp, H. A., K. E. Morgenstein, and B. Kuzbyt. 2019. “Speech Perception Outcomes in Transcutaneous versus Percutaneous Bone Conduction Stimulation in Individuals with Single-Sided Deafness.” Otology & Neurotology : official Publication of the American Otological Society, American Neurotology Society [and] European Academy of Otology and Neurotology 40 (8): 1068–1075. doi:https://doi.org/10.1097/MAO.0000000000002362.
- Snapp, H. A., K. E. Morgenstein, F. F. Telischi, and S. Angeli. 2016. “Transcranial Attenuation in Patients with Single-Sided Deafness.” Audiology & Neuro-Otology 21 (4): 237–243. doi:https://doi.org/10.1159/000447044.
- Stenfelt, S. 2012. “Transcranial Attenuation of Bone-Conducted Sound When Stimulation is at the Mastoid and at the Bone Conduction Hearing Aid Position.” Otology & Neurotology : Official Publication of the American Otological Society, American Neurotology Society [and] European Academy of Otology and Neurotology 33 (2): 105–114. doi:https://doi.org/10.1097/MAO.0b013e31823e28ab.
- Stenfelt, S., and R. L. Goode. 2005. “Transmission Properties of Bone Conducted Sound: Measurements in Cadaver Heads.” The Journal of the Acoustical Society of America 118 (4): 2373–2391. doi:https://doi.org/10.1121/1.2005847.
- Stieger, C., C. Candreia, M. Kompis, G. Herrmann, F. Pfiffner, D. Widmer, and A. Arnold. 2012. “Laser Doppler Vibrometric Assessment of Middle Ear Motion in Thiel-Embalmed Heads.” Otology & Neurotology : Official Publication of the American Otological Society, American Neurotology Society [and] European Academy of Otology and Neurotology 33 (3): 311–318. doi:https://doi.org/10.1097/MAO.0b013e3182487de0.
- Tyler, R. S., C. C. Dunn, S. A. Witt, and J. P. Preece. 2003. “Update on Bilateral Cochlear Implantation.” Current Opinion in Otolaryngology & Head and Neck Surgery 11 (5): 388–393. doi:https://doi.org/10.1097/00020840-200310000-00014.
- van Barneveld, D. C. P. B., H. J. W. Kok, J. F. P. Noten, A. J. Bosman, and A. F. M. Snik. 2018. “Determining Fitting Ranges of Various Bone Conduction Hearing Aids.” Clinical Otolaryngology : Official Journal of ENT-UK ; Official Journal of Netherlands Society for Oto-Rhino-Laryngology & Cervico-Facial Surgery 43 (1): 68–75. doi:https://doi.org/10.1111/coa.12901.
- Zwirner, J., M. Scholze, B. Ondruschka, and N. Hammer. 2019. “Tissue Biomechanics of the Human Head Are Altered by Thiel Embalming, Restricting Its Use for Biomechanical Validation.” Clinical Anatomy 32 (7): 903–913. doi:https://doi.org/10.1002/ca.23409.