
 ?Mathematical formulae have been encoded as MathML and are displayed in this HTML version using MathJax in order to improve their display. Uncheck the box to turn MathJax off. This feature requires Javascript. Click on a formula to zoom.
Abstract
Objective
This work presents the design and verification of a simplified measurement setup for wireless remote microphone systems (WRMSs), which has been incorporated into guidelines of the European Union of Hearing Aid Acousticians (EUHA).
Design
Three studies were conducted. First, speech intelligibility scores within the simplified setup were compared to that in an actual classroom. Second, different WRMSs were compared in the simplified setup, and third, normative data for normal-hearing people with and without WRMS were collected.
Study sample
The first two studies include 40 older hearing impaired and the third study 20 young normal-hearing adults.
Results
Speech intelligibility with WRMS was not different across actual classroom and simplified setup. An analog omnidirectional WRMS showed poorer speech intelligibility and poorer quality ratings than digital WMRSs. The usage of a WRMS in the simplified setup resulted in significantly higher speech intelligibility across all tested background noise levels.
Conclusions
Despite being a simplified measurement setup, it realistically emulates a situation where people are listening to speech in noise from a distance, such as in a classroom or meeting room. Hence, with standard audiological equipment, the individual benefit of WRMSs can be measured and experienced by the user in clinical practice.
Listening to a person from a distance in noise (e.g. in a lecture hall, classroom, meeting room, church) can be challenging. With increasing distance, the signal-to-noise ratio (SNR) decreases and effects of the room acoustics such as reverberation impede speech understanding (Davis and Patronis Citation2014). These difficulties are common for people living with hearing loss and may not be sufficiently addressed by hearing aids alone (Zanin and Rance Citation2016; Maidment, Barker, and Xia Citation2018). One approach to improve speech intelligibility in such a situation is using a wireless remote microphone system (WRMS) where a microphone signal is wirelessly transmitted to the listener’s hearing aids (Crandell, Smaldino, and Flexer Citation2005). Historically, frequency modulation (FM) has been used for the wireless transmission so that devices of this technology are often referred to as FM systems (Katz et al. Citation2014; Metz Citation2014). In an ideal case, the listener experiences the wirelessly transmitted signal as if the listener was close to the speaker independent of the position within the room. Consequently, the main advantage of this technology for the listener is the increase in SNR, and the suppression of deteriorating effects from reverberation in cases of poor room acoustics. This improves speech intelligibility and also reduces listening effort (Valente, Hosford-Dunn, and Roeser Citation2008; Cruz, et al. Citation2019). Hence, a variety of benefits have been reported for hearing-impaired children (Bagatto et al. Citation2019; Walker et al. Citation2019) and adults with hearing aids (Chisolm et al. Citation2007; Thibodeau Citation2010), with bimodal fittings (Vroegop et al. Citation2017) or with cochlear implants (Schafer and Thibodeau Citation2006; Schafer et al. Citation2009; Fitzpatrick, et al. Citation2010). Benefits of WRMSs have been observed in various situations, but mainly where people listen to a sound source from a distance in noise, e.g. in a classroom or lecture hall, in meetings, watching TV, listening to radio, attending church, in group conversations, or in certain occasions in a home environment (Benítez-Barrera, et al. Citation2019).
Although the advantages of WRMSs are well known, many more people could benefit from them. An important point is demonstrating the individual benefit to the user. One possibility is testing WRMSs in the real world, allowing the users to assess the benefits of a WRMS for themselves. However, in this uncontrolled environment no reproducible and objective results can be obtained. An individual proof of the benefit (e.g. in terms of improved speech intelligibility) is sometimes required to justify the costs (e.g. to get reimbursement from health insurances). In addition, in the real world, it is difficult to compare different systems in order to choose the system that best fulfils the user’s needs. Furthermore, performance tests on the individual level in a controlled environment are helpful to fit a WRMS to the personal needs of a user and to check functionality.
Besides technical measurements, e.g. according to (ANSI/ASA S3.47 Citation2014), several behavioural measurements are suggested to evaluate the performance of WRMSs. Some of them are very complex, i.e. requiring large test rooms or the simultaneous presentation of more than two test signals (Thibodeau Citation2014). However, in practice, the size of common test rooms is not large enough to present signals several metres away from the test person, e.g. ISO 21388 requires a minimum floor surface area of 10 m2 and the loudspeakers are placed 1 m away from the test person in the example of a fitting room in Annexe C (ISO 21388 Citation2020). Moreover, most audiometers can only present two signals simultaneously. Consequently, the implementation of these approaches is difficult, e.g. in sound booths of hearing aid professionals, audiologists, ear, nose, and throat (ENT) specialists, clinics, schools, or paediatric centres. Other approaches may be too simplified, e.g. a speech signal is presented from 0° and noise is presented from 180° behind the listener, or the speech signal and the noise are presented from ±45° and the remote microphone is located in a neighbouring room (ASHA Ad Hoc Committee on FM Systems Citation2002; AAA Citation2011). Therefore, we have designed a realistic and easily applicable setup to evaluate the individual benefit of a WRMS (Husstedt Citation2016; Husstedt and Steinhauer Citation2016). This design has become part of the guidelines “Wireless remote microphone systems – configuration, verification and measurement of individual benefit (Guidelines 04-06)” published by the European Union of Hearing Aid Acousticians (EUHA Citation2017). These guidelines not only include the design of the measurement setup but also provide procedures for the configuration and verification of the settings of WRMSs. In addition, some background information about the idea and design of the measurement setup is included in the annexe of the guidelines. However, the guidelines do not include any studies verifying the design. Therefore, in this work, we present results of three different studies, which verify the design, demonstrate the possibilities of the setup, and provide normative data for young normal-hearing listeners.
The rest of the paper is organised as follows. To begin with, the content of the EUHA guidelines and the design of the measurement setup are reviewed. Then, the first study compares speech intelligibility of the simplified measurement setup with a more realistic scenario to verify the design. In the second study, the performance of five different WRMSs was analysed in the simplified measurement setup, and in the third study normative data were collected.
EUHA guidelines
Overview
The EUHA guidelines suggest a procedure to measure the individual benefit from a WRMS in a reference situation, which is listening to a person at a 4 m distance, akin to a meeting room or classroom (EUHA Citation2017). It is possible to compare the performance with and without WRMS and to compare performance across different WRMSs. Although the measurement setup emulates a real-life situation, it is designed such that it can be easily implemented in practice (e.g. in sound booths of hearing aid professionals, audiologists, ENT specialists, clinics, schools, paediatric centres, etc.). Furthermore, the setup allows for testing persons with normal and impaired hearing who use hearing aids, cochlear implants, or other devices compensating for a hearing loss. Before the individual benefit can be measured, the WRMS is required to be correctly configured. Therefore, the guidelines describe how to configure the WRMS, and how to verify its configuration. Only when this step has been completed, a reliable measurement of the individual benefit can be performed.
Many ideas and concepts of the EUHA guidelines are in agreement with the clinical practice guidelines of the American Academy of Audiology (AAA Citation2011). Especially, the configuration and verification of the transfer characteristic of the EUHA guidelines (Chapter 2) are similar to the electroacoustic verification of the AAA guidelines (SA1.4). However, the behavioural test configurations described in the AAA guidelines (SA1.5) are different to the measurement setup of the EUHA guidelines considered in this work.
Configuration and verification of the transfer characteristic
The transfer characteristic of the WRMS describes the amplification of the target signal with respect to ambient noise surrounding the listener. If the amplification of the target signal is not strong enough, the sound near the listener masks the wirelessly transmitted speech signal. In this case, the benefit of the WRMS is limited, or completely lost. On the other hand, if the signal of the WRMS is too loud, the user may be isolated and cannot recognise any sounds in close proximity. As a result, no communication with other people in close proximity such as colleagues or classmates is possible anymore. Thus, the suggestion of the guidelines is to adjust the transfer characteristic of the WRMS such that the signal of the speaker (e.g. of the lecturer) is dominant but sounds in the immediate environment (e.g. comments of other people, co-worker, or another speaker/conversation partner) can still be recognised. This suggestion is based on the “10 dB FM advantage”, which is described in the “Guidelines for Fitting and Monitoring FM Systems” written by the ASHA Ad Hoc Committee on FM Systems (ASHA Ad Hoc Committee on FM Systems Citation2002). In this context, the term “10-dB FM advantage” means that the signal of the WRMS shall be 10 dB higher in level than ambient sounds.
Since the transfer characteristic is crucial for the correct function of the WRMS, the EUHA guidelines describe different methods for how this characteristic can be configured and verified. For instance, a test box can be used for people wearing hearing aids, real-ear measurements are suggested for people without hearing impairment, and a subjective procedure can be applied for people with implants. The International Speech Test Signal (ISTS; Holube et al. Citation2010) is recommended as test signal for all situations. A simple way to assess the transfer characteristic of the WRMS would be sequential measurements. This means the ISTS is successively presented at realistic levels, e.g. at the remote microphone at 80 dB SPL, and in the free field at 65 dB. Each time the output signal is stored so that the transfer characteristic can be computed as the difference beween both results. However, hearing aids, cochlear implants, or the WRMS itself usually include nonlinear signal processing, e.g. due to dynamic range compression. Therefore, sequential measurements would lead to a wrong transfer characteristic. To overcome this problem, the EUHA guidelines suggest acoustic transparency instead. This means that the ISTS presented at 65 dB SPL at the remote microphone, generates an equal output signal for the user as an ISTS at 65 dB SPL without WRMS. As the same input level is used, a sequential measurement is now possible, despite non-linear signal processing. If acoustic transparency is met at 65 dB SPL, it is most likely that an FM advantage of approximately 10 dB can be achieved in the actual application. This is primarily because the remote microphone in the application experiences a higher sound pressure level of around 80 dB SPL. If the signal processing was perfectly linear, the acoustic transparency would lead to an FM advantage of 15 dB. As an input level of 80 dB normally results in dynamic range compression, the FM gain is more likely to be around 10 dB. Thus, demanding acoustic transparency is a reasonable approach for non-linear devices. However, this is no direct verifcation that the criterion for the “10-dB FM advantage” is exactly met.
Measurement setup for WRMSs
Objective
The goal of the simplified measurement setup is to emulate a situation where people are listening to speech from a distance in noise, e.g. during a business meeting or in a classroom. In such situations, the communication is affected by noise which is assumed to be diffuse and distributed equally inside the room. The measurement setup should be as simple as possible, but the following three conditions should be met:
The noise levels at the position of the remote microphone and at the position of the listener are the same.
The direction and level of speech and noise are the same at both sides of the listener’s head.
At the remote microphone, speech and noise are not presented from the same direction.
The first condition is essential since a fair comparison with and without WRMS can only be made if the noise level is equal at the position of the remote microphone and at the position of the listener. For example, if the noise level is higher at the position of the listener, which may sometimes occur in practice, the improvement with WRMS would be unrealistically high. The second condition is important, because asymmetry in the sound field across ears would interfere with potential asymmetric hearing loss of the listener. The third condition ensures that the effects of directional microphone technology in the remote microphone can be taken into account. Many modern WRMSs use this technology (Vroegop et al. Citation2018), so that its impact would be ignored if the noise and speech signal were presented from the same direction. In addition to these three conditions which are important for a realistic emulation, other practical features are of interest, too. The distance between the speaker and listener should be reasonable for the use of a WRMS, but the size of the setup should be adaptable to meet local room restrictions in practice. Moreover, because most audiometers provide only two output channels, the setup should not require more than two.
Approach – simplified setup
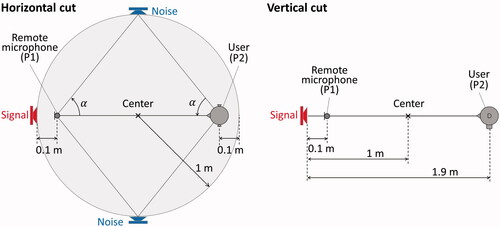
Taking all these considerations into account has led to the simplified setup shown in . This setup consists of three loudspeakers connected to a two-channel speech audiometer. The remote microphone and the listener are placed in front of the loudspeaker presenting the speech signal. The loudspeakers presenting the noise signal are placed such that they are equidistant to the listener and to the remote microphone. Moreover, the position is defined such that the noise is presented from approx. ±45° from the perspective of the listener, as well as from the perspective of the speaker. Thus, the diffuse noise, assumed to be present in most realistic scenarios, is approximated by noise from approx. ±45°. The complete setup fits within a circle of 1 m radius. In addition, preserving all important features of the setup, some modifications are possible as described in Appendix II of the EUHA guidelines, e.g. it is possible to use only one loudspeaker located at the ceiling of the room presenting the noise. Moreover, Appendix II of the EUHA guidelines also describes limitations in the application of the test setup., e.g. the maximum and minimum dimensions of the setup, or the allowed tolerances for the alignment of the loudspeakers (EUHA Citation2017).
Figure 1. Measurement setup visualised from two perspectives. P1 indicates the position of the remote microphone, and P2 the position of the user.
Sound levels and measurement approach
The levels of speech and noise used within the simplified setup were inferred from a typical class or meeting room with a listener at a 4 m distance to the speaker. In the reference situation, the speech level at the remote microphone depends on the distance between the mouth of the speaker and the microphone. In the EUHA guidelines, the speech level at the remote microphone is assumed to be 80 dB SPL for microphones worn around the neck of the speaker, and 85 dB SPL for microphones positioned in front of the mouth. In the simplified setup, the remote microphone is placed in 0.1 m distance to the loudspeaker (P1 in ) for both types of remote microphones, and the sound pressure level is adapted accordingly.
The speech level at the listener’s position in the reference situation is computed using the distance law in enclosed rooms according to (Hopkins and Stryker Citation1948). Assuming the listener sits at a 4 m distance from the speaker in a room with a volume of 300 m³ and a reverberation time of 0.6 s, this would result in a speech level of approx. 58 dB SPL (Crandell, Smaldino, and Flexer Citation2005; Husstedt Citation2016). The noise level is defined to be 60 dB SPL for a regular and 70 dB SPL for a noisy environment. During the test procedure, the positions of the remote microphone and the listener in the reference situation are considered by adapting the speech level in accordance with the distance law. However, with one loudspeaker, the speech level can only be adapted at either the position of the remote microphone (P1 in ) or the position of the listener (P2 in ). For the measurement without WRMS, the speech level at the listener’s position is the only one of importance, and therefore is set to 58 dB SPL (, red colour). For the situation with WRMS, the speech level at the remote microphone is essential and therefore correctly adapted (, red colour). However, in the situation with WRMS, the speech level at the listener’s position is not exactly defined, because the direct air-borne speech level will add to the speech level transmitted via WRMS. Nevertheless, if the WRMS is correctly configured, the acoustically transmitted speech signal should not influence the speech intelligibility measured (Section “Verification of the design – first study”).
Figure 2. Speech (underlined) and noise levels for the measurement without wireless remote microphone system (WRMS) (a) and for the measurement with WRMS (b).
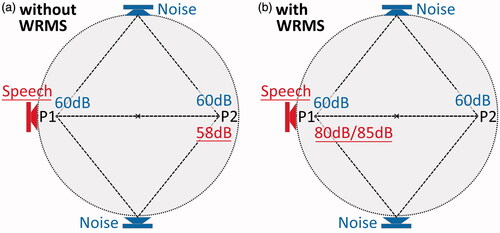
With and without the WRMS, speech intelligibility performance for a fixed noise level (blue colour in ) can be measured. In the EUHA guidelines for instance, a German monosyllabic speech test is considered which is called “Freiburger Einsilber Test” (Hahlbrock Citation1957). This test consists of 20 test lists each with 20 monosyllabic test words, and it is used in all studies presented in the following. The type of test is not important for the idea of measurement such that other tests in other languages may be applied, e.g. the Hearing in Noise Test (Nilsson, Soli, and Sullivan Citation1994) as used in (Thibodeau Citation2014).
Verification of the design – first study
Objective
The goal of the simplified measurement setup of the EUHA guidelines is to emulate a situation where people are listening to speech from a distance in noise. As reference situation, a listener is assumed to be at a 4 m distance to the speaker in a room with a volume of 300 m³ and a reverberation time of 0.6 s. Nevertheless, it is not clear how well the reference situation is emulated by the simplified setup. Therefore, in this study, a direct comparison is performed (Griepentrog et al. Citation2019).
Materials and methods
The simplified setup was realised as depicted in ) with the speech audiometer ACAM 5 from Acousticon Hörsysteme GmbH equipped with one-way loudspeakers of type “dB-99”. The measurements took place in an audiological test room with a floor area of 21.9 m2, a volume of 68.7 m³ and a mean reverberation time of 0.14 s between 0.2 kHz and 5 kHz. This test room is larger and has a lower reverberation time compared to typical audiological test rooms, e.g. according to (ISO 21388 2020). For the simplified setup, effects of reverberation would lead to a more realistic emulation of the reference situation where the listener would mostly experience speech and noise as a diffuse signal. Thus, differences between the simplified setup and a more realistic situation become more obvious in the audiological test room selected than in typical audiological test rooms.
Figure 3. (a) Photograph of realisation of the simplified setup (left) and photograph of the position of the remote microphone (right). (b) Schematic drawing (left) and photograph of the classroom used for the measurements.
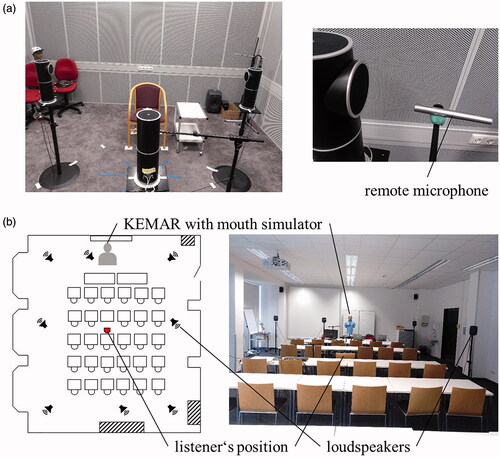
For a more realistic situation, all tests were performed in a classroom of the Academy of Hearing Aid Acoustics in Lübeck, Germany (). This classroom has a floor area of 99.5 m2, a volume of 304 m³, and a mean reverberation time of 0.73 s between 0.2 kHz and 5 kHz. The GRAS head and torso simulator with mouth simulator (KEMAR) was placed at the position of the lecturer and the test subjects were seated at a 4 m distance. The noise was presented using 8 Genelec loudspeakers of type “8020 A” placed near the corners and walls of the room. The orientation and position of the speakers are shown in ).
The German monosyllabic speech test “Freiburger Einsilber Test” (Hahlbrock Citation1957) was used for testing speech intelligibility and the CCITT noise was presented to create a noisy background. The CCITT noise (according to Comité Consultatif International Téléphonique et Télégraphique) was originally designed to test telephone channels (ITU Citation1993). In addition, this signal has been used as masking signal for the “Freiburger Einsilber Test” for many years (Winkler, Holube, and Husstedt Citation2019). Moreover, in (Winkler and Holube Citation2018), it was shown that the masking of the CCITT noise is comparable to the speech weighted noise described in (IEC 60645-1 Citation2017).
Without WRMS, a background noise level of 60 dB SPL, and with WRMS a background noise of either 60, 65, or 70 dB SPL was considered. Phonak Bolero B-90 hearing aids were fitted to each participant according to NAL-NL2 fitting rule, and custom ear moulds were available for most of the subjects. No real-ear measurements were performed to streamline the fitting process, since the key focus of the study was on the WRMS. The omnidirectional setting was chosen as microphone characteristic for the hearing aid. The directional setting was also added at 70 dB SPL background noise level (). This additional condition was introduced to examine whether directionality of the hearing aids leads to a reduced capturing of background noise in this situation.
Table 1. Five different measurement conditions were considered in each test room (simplified setup/classroom) with and without wireless remote microphones system (WRMS) and with an omnidirectional or directional hearing aid microphone characteristic.
zA digital WRMS, Phonak Roger Pen (model 1.1), was used for conditions C2 to C5, which provided a directional microphone characteristic. The transfer characteristic of the WRMS was checked according to the procedure of the EUHA guidelines, as explained earlier in section “Configuration and verification of the transfer characteristic”. If required, the gain of the remote microphone signal was adjusted to best meet acoustic transparency.
Study design
Speech intelligibility scores of 20 subjects (10 male, 10 female) aged between 52 to 83 years were measured for both, the simplified setup and the actual classroom, in randomised order. All subjects were native German speakers, and they were recruited from a subject database of the Audiological Campus Lübeck. That means the subjects were experienced test candidates, which are regularly involved in classes of hearing aid professional students or within scientific studies. The subject database is continuously updated, and subjects are removed, if they do not want or cannot take part in studies anymore, e.g. due to cognitive impairments. However, no cognitive screening tests were performed in this study. Subjects were recruited to have a hearing loss most similar to type “N3” according to (IEC 60118-15 Citation2012). In this standard the “hearing loss” is defined as the average of hearing thresholds at frequencies of 0.5, 1, 2, and 4 kHz, which is commonly referred to as pure tone average (PTA). The average PTA over all subjects for the left, right, and better ear closely matches the PTA of 46 dB of type N3 (left:
right:
better ear:
). Comparing the individual PTAs of all ears and all subjects with the definition of the hearing loss N3 results in a maximum difference of 17.5 dB. For each condition, two lists were presented such that all 20 lists have been presented to each test person. Moreover, the order of the lists was randomised according to a Latin square such that each list was equally often presented in each of the conditions and test rooms.
Results
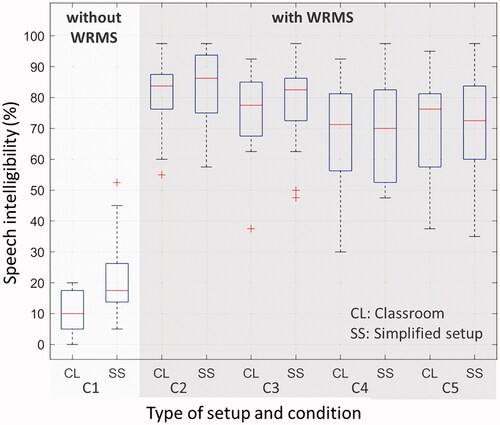
In , the speech intelligibility in percent correct is shown for all conditions and for both test rooms. Since the results are restricted to be within 0% to 100%, ceiling and flooring effects may occur. Therefore, the rationalised arcsine transform (RAU) was applied to the data (Studebaker Citation1985) for statistical testing. Testing on normality using the Shapiro–Wilk test reveals that almost all RAU data except for the condition C1 in the classroom were normally distributed. Hence, we decided to use parametric statistical tests.
Figure 4. Speech intelligibility for all conditions (C1–C5 as listed in ) and for the classroom (CL) and the simplified setup (SS). The conditions with WRMS are indicated with a grey background.
First, a two-way repeated measures ANOVA was performed using the factors “type of setup” and “condition”. The ANOVA revealed a highly significant effect of “type of setup” F(1,18) = 31.1 (p < 0.001***) and “condition” F(4,15) = 294 (p < 0.001***), as well as a highly significant effect of their interaction F(4) = 4.26 (p = 0.004**)Footnote1.
Next, a post-hoc pairwise t-test between the setups () and between the conditions was performed () using Bonferroni correction for multiple comparisons.
Table 2. Results of the post-hoc pairwise comparison with Bonferroni correction for all conditions (C1–C5) between the classroom (CL) and the simplified setup (SS).
Table 3. Results of the post-hoc pairwise comparison with Bonferroni correction for both rooms (CL or SS) between all conditions (C1–C5).
The comparison between the setups shows a significant difference between the simplified setup and the classroom for the situation only without WRMS (C1). All other conditions do not show significant differences.
The comparison between the conditions confirms that the speech intelligibility with WRMS (C2–C5) is significantly higher than without WRMS (C1). Looking at the background noise levels (C2 at 60 dB SPL, C3 at 65 dB SPL, C4 at 70 dB SPL), we see a decrease of speech intelligibility with increasing background noise as expected. Except for the comparison between C2 and C3, all differences between a lower and higher noise level are significant.
Finally, the comparison between the hearing aid settings with omnidirectional or directional microphones at a noise level of 70 dB SPL (C4 and C5) shows no significant difference in both setups.
Discussion
The results demonstrate that similar patterns of individual benefit from a WRMS can be observed in an actual room and with the simplified setup. A significant difference can be noticed for the situation without WRMS. A difference in the situation without WRMS can be explained by approximations of the simplified setup to the actual room, such as: (i) the sound pressure level was adapted to meet the level at a 4 m distance so that no effects of the room acoustics were included; (ii) the diffuse background noise in the actual room was approximated by noise arriving from approx. ±45°; (iii) the speech signal was presented by a regular loudspeaker and not by a head and torso simulator with mouth simulator. Nevertheless, the difference in median is low with 7.5 percentage points and for all situations with WRMS no significant differences were observed. Overall, the simplified setup shows comparable results to the results of the classroom. Furthermore, since the simplified setup shows slightly higher speech intelligibility without WRMS, the benefit of the WRMS in a real classroom is expected to be even higher than demonstrated with the simplified setup.
Comparison of different WRMSs – second study
Objective
There are digital and analog WRMSs from different manufacturers available. Some remote microphones provide a directional microphone characteristic and others an omnidirectional characteristic only. Therefore, in this study, the performance of different WRMSs was compared (Fitschen, Tchorz, and Husstedt Citation2017). Digital systems were compared to an analog system, and systems with directional microphones were compared to systems with omnidirectional characteristic. A benchmark test of different manufacturers was not intended. The main goal was to demonstrate that the comparison of different WRMSs is possible within the simplified setup. Furthermore, the results obtained were compared with subjective ratings to evaluate how much they reflect the quality experienced by the users.
Materials and methods
Five different WRMSs were tested using the simplified setup of the EUHA guidelines. One analog and four digital WRMSs of three different manufacturers were included (). Furthermore, the remote microphones of two digital systems had a directional characteristic.
Table 4. Overview about the five different WRMSs tested.
A pair of Siemens Motion SA 7bx hearing aids with custom earmolds were fitted to each of the participants of the study according to NAL-NL2 fitting rule. No real-ear measurements were performed to streamline the fitting process, since the key focus of the study was on the WRMSs. The manufacturer of the hearing aid was different to all three manufacturers of the WRMSs and the WRMSs were connected via direct audio input (DAI). As in the first study, the transfer characteristic of the WRMS was checked, if required, the gain of the remote microphone signal was adjusted to best meet acoustic transparency, and the same speech test and noise signals as in the first study were used.
Study design
Speech intelligibility scores of 20 participants (6 male, 14 female) aged between 63 to 83 years (average of 74 years) were measured. All subjects were recruited from the same subject database of the Audiological Campus Lübeck as described in the first study, and eight subjects had already participated in the first study. Subjects were recruited to have a hearing loss most similar to type “N3” according to (IEC 60118-15 2012). The average PTA over all subjects for the left, right and better ear nearly matches the PTA of 46 dB of type N3 (left:
right:
better ear:
). Comparing the individual PTAs of all ears and all subjects with the definition of the hearing loss N3 results in a maximum difference of 26.3 dB. All WRMSs were tested in randomised order at a noise level of 60 and 65 dB SPL. For each WRMS and each noise level, the speech intelligibility was averaged across three test lists with 20 test words each (overall 60 words).
At a noise level of 65 dB SPL, immediately after the speech test of each WRMS, the subjects were asked to rate the sound quality and the experienced speech intelligibility using one of the five categories: “very satisfied (5)”, “satisfied (4)”, “neutral (3)”, “unsatisfied (2)”, “very unsatisfied (1)”. The subjects rated the sound quality and experienced speech intelligibility without any further explanation of these terms.
Results
The result of the speech test for all WRMSs and both noise levels is shown in . For further statistical testing, the speech intelligibility scores in percent correct were again transformed with the rationalised arcsine function. Testing on normality with the Shapiro–Wilk test revealed that all RAU data were normally distributed so that parametric tests were used. A two-way repeated measures ANOVA was performed using the factors “noise level” and “type of WRMS”. This ANOVA revealed a significant effect of “noise level” F(1,18) = 7.54 (p = 0.013*) and a highly significant effect of “type of WRMS” F(4,15) = 14.4 (p < 0.001***), but no effect of their interaction F(4) = 1.37 (p = 0.25). Next, a post-hoc pairwise t-test comparison between the WRMS types () and between the noise levels are performed () using Bonferroni correction.
Figure 5. (a) Speech intelligibility for all five WRMSs (W1–W5) and two noise levels. (b) Ratings of speech intelligibility and sound quality for a noise level of 65 dB SPL.
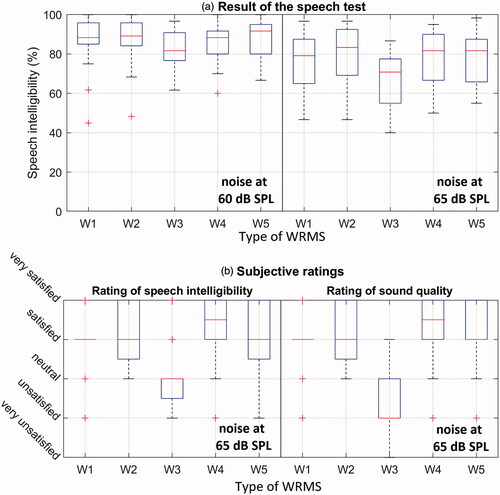
Table 5. Results of the post-hoc pairwise comparison with Bonferroni correction for both noise levels (60 dB or 65 dB SPL) between all conditions WRMSs (W1–W5).
Table 6. Results of the post-hoc pairwise comparison with Bonferroni correction for all WRMSs (W1–W5) between the situation with a noise level of 60 dB SPL and 65 dB SPL.
All systems provide relatively high speech intelligibility, but the speech intelligibility for the analog system (W3) was significantly lower compared to the digital systems at a noise level of 65 dB SPL.
With increasing noise level, the speech intelligibility was significantly reduced for almost all systems except for W4. At 60 dB SPL a ceiling effect can be observed due to the high percentage scores. The ceiling effect is much less pronounced at 65 dB SPL, such that differences across WRMSs become more evident.
The subjective ratings of speech intelligibility and sound quality at a noise level of 65 dB SPL are depicted in . Due to the ordinal scale of the data, we decided to use non-parametric statistical tests. Since we have a repeated measures design, Friedman’s test was performed on both ratings. These results show that there are significant differences between the WRMSs for both the ratings on speech intelligibility and on sound quality ().
Table 7. Result of Friedman’s test performed on the data of the subjective ratings on speech intelligibility (SI) and sound quality (SQ) shown in .
Next, a post-hoc pairwise comparison for both types of subjective ratings were performed () using Bonferroni correction.
Table 8. Results of the post-hoc pairwise comparison with Bonferroni correction for the subjective ratings depicted in .
This comparison shows that all digital systems are rated significantly higher than the analog system (W3) for both speech intelligibility and sound quality, which is similar to the result of the speech test at a noise level of 65 dB SPL. Therefore, the correlation between the results of the speech test at a noise level of 65 dB SPL and the subjective ratings was examined. Spearman’s correlation for the ratings on speech quality was significant (p = 0.034*) with a correlation coefficient of 0.21 whereas the correlation for the ratings on sound quality was just not significant (p = 0.050) with a correlation coefficient of 0.20. Moreover, both subjective ratings were significantly correlated to each other with Spearman’s correlation coefficients of 0.83 (p < 0.001***).
Discussion
The results measured with the simplified setup depict that all WRMSs provide high speech intelligibility at the EUHA-guidelines-specified noise level of 60 dB SPL. However, digital WRMSs show higher speech intelligibility especially at the higher noise level of 65 dB SPL. At the low noise level, a comparison of different WRMSs is difficult, due to the ceiling effect. Thus, a comparison of different WRMSs seems to be more meaningful at higher noise levels, i.e. noise levels of 65 dB SPL and above.
In this study, no differences could be observed between systems using omnidirectional or directional microphones. Since differences become more obvious at higher noise levels, maybe directional microphones show their advantages at noise levels above 65 dB SPL.
Furthermore, the subjective ratings of sound quality and speech intelligibility showed a highly significant correlation, maybe because sound quality and speech intelligibility could not really be distinguished by the test subjects. Moreover, the subjective ratings show similar results as the speech test. All digital systems yield significantly higher speech intelligibility or better subjective ratings than the analog system, whereas there were no significant differences between the digital systems. However, the correlation between the results of the speech test and the subjective ratings was low and only significant for the rating of speech intelligibility. Thus, the results of the speech test and the subjective rating may measure not the same, but a similar or at least overlapping construct.
Normative data for normal-hearing listeners – third study
Objective
Listening to a person from a distance in noise can also be challenging for people without hearing impairment, e.g. sitting in the back of a room during a conference, such that they would benefit from a WRMS, too. Moreover, the new Bluetooth LE Audio standard provides a broadcast functionality, which possibly leads to wider use of WMRSs of people with and without hearing loss (Kolderup Citation2020). Consequently, another application of the EUHA setup is measuring the benefit of WRMSs for people with normal hearing. Therefore, one objective of this study was to demonstrate that also normal-hearing people can be tested with the simplified measurement setup. Another goal was to collect normative data for young otologically normal persons similar to the determination of a reference speech recognition curve as described in (ISO 8253-3 Citation2012). A comparison of the performance of hearing-impaired subjects with such normative data helps to rate whether a WRMS is required to reach the same speech intelligibility as young people without hearing loss when listening to a person from a distance in noise. For instance, young people with a mild hearing loss may reach the same speech intelligibility with hearing aids as young normal-hearing listeners in this situation. Other people with a greater hearing loss and hearing aids or implants, people with an auditory processing disorder (APD; Musiek et al. Citation2018), or older audiometrically normal-hearing people (Füllgrabe, Moore, and Stone Citation2015) may reach significantly lower speech intelligibility. Hence, a criterion in terms of speech intelligibility could be defined, whether a person has a deficit when listening to sounds from a distance in noise. Consequently, normative date could also be used for candidacy of a WRMS (Husstedt and Fitschen Citation2018).
Materials and methods
Normal-hearing listeners were tested with the simplified setup of the EUHA guidelines with and without WRMS in a background noise of 60, 65, and 70 dB SPL. As in the first study, Phonak Roger Pen (model 1.1) was used as WRMS. For the sound emission, both ears were equipped with Phonak Roger Focus receivers, which have a shape similar to hearing aids with slim tubes but without microphones and amplification. The acoustic tube was attached to the ear with open domes. These devices enable the user to adjust the loudness of the wirelessly transmitted signal within a certain range for each ear, whereas the frequency characteristic cannot be configured. To measure the individual transfer characteristic, real-ear measurements were performed with the audiometer ACAM 5. In this situation, the environmental sounds were transmitted on the unprocessed acoustic path through the room to the ear and thus linearly superimposed with the signal of the WRMS. This means the 10 dB FM advantage could have been measured directly. However, to ensure comparable conditions as in the previous studies, the output level was adjusted to best meet acoustic transparency as defined in the EUHA guidelines. Again, the same speech test with speech presented at 65 dB SPL and the same noise signal were used as in the previous studies.
Study design
Speech intelligibility scores of 20 subjects (8 male, 12 female) with an age between 22 to 29 years (average of 26 years) were measured with and without WRMS. Normal hearing was tested with pure tone audiometry at frequencies of 0.25, 0.5, 1, 2, 3, 4, and 6 kHz. As limit for normal hearing, a hearing threshold below 20 dB HL for all frequencies was required. At each noise level and in the situation with or without WRMS each time the speech intelligibility was averaged over three test lists each with 20 test words (overall 60 words).
Results
The results of the real-ear measurements demonstrate that in most cases the manual volume control was not sufficient to adjust the WRMS in a way that acoustic transparency could be reached. In the EUHA guidelines, a tolerance of ±5 dB for a frequency range of 0.8 kHz to 3.5 kHz is specified, as depicted with a grey box in .
Figure 6. Real-ear measurement for all 20 subjects to check acoustic transparency, as defined in the EUHA guidelines using the ISTS at 65 dB SPL. The plots show the level difference between free field and the remote microphone in a test box. As reference the free field is defined so that positive differences indicate a transmission of the WRMS with higher level.
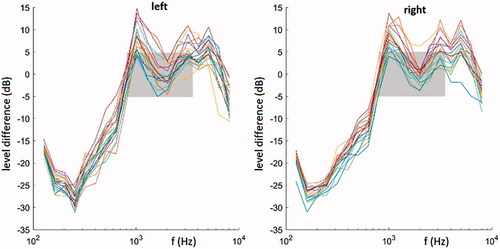
Around 1 kHz and 3 kHz, most of the real-ear measurement curves were above the tolerance of 5 dB of the EUHA guidelines.
In , the speech intelligibility with and without WRMS for 20 normal-hearing listeners at noise levels of 60, 65, and 70 dB SPL is shown. For statistical testing, the speech intelligibility scores in percent correct were again transformed with the rationalised arcsine function. Testing on normality with the Shapiro–Wilk test reveals that all RAU data were normally distributed so that parametric tests were used. A two-way repeated measures ANOVA was performed using the factors “noise level” and “usage of WRMS”. The ANOVA revealed highly significant effects of “noise level” F(2,17) = 530 (p < 0.001***), of “usage of WRMS” F(1,18) = 1237 (p < 0.001***), and their interaction F(2) = 30.7 (p < 0.001***). Next, post-hoc pairwise t-test comparisons between the situations without or with WRMS () and between the different noise levels were performed () using Bonferroni correction.
Figure 7. Speech intelligibility with and without WRMS for 20 normal-hearing listeners at noise levels of 60, 65, and 70 dB SPL.
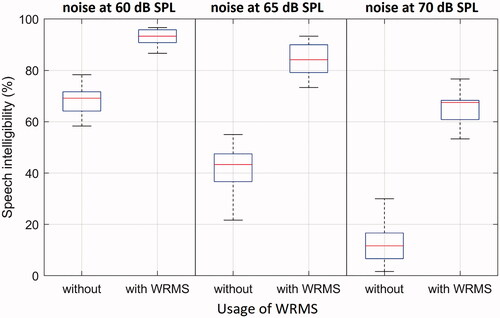
Table 9. Results of the post-hoc pairwise comparison with Bonferroni correction for the results of the speech test depicted in .
Table 10. Results of the post-hoc pairwise comparison with Bonferroni correction for the results of the speech test depicted in .
A comparison of speech intelligibility for the situation with and without WRMS showed a highly significant benefit for all noise levels due to the WRMS.
With increasing noise level, the absolute value of speech intelligibility significantly decreases with and without WRMS, whereas the benefit (difference between the situation with and without WRMS) increases.
Discussion
The results of the real-ear measurements show that there is hardly any acoustic transmission for frequencies below 1 kHz, which is expected due to the open fitting. In the frequency range of speech, the receiver shows variations of about 10–15 dB. Moreover, in most cases the manual volume control was not sufficient to adjust the WRMS in a way that acoustic transparency could be reached as defined in the EUHA guidelines. Additional measurements within a test box revealed that the WRMS with receivers for normal-hearing listeners shows a high dynamic range compression. This means that increasing the level of the ISTS at the remote microphone from 65 dB SPL to 80 dB SPL results in only a small increase of the level at the output of the receiver of approx. 2 dB. Consequently, measurements with 80 dB SPL at the input of the remote microphone would approximately result in the same curves of shifted about 2 dB to higher levels. Hence, although acoustic transparency could not be reached, the 10-dB FM advantage with a tolerance of ±5 dB was reached for most subjects at frequencies around 1 kHz and 3 kHz.
The measurements of speech intelligibility () clearly demonstrate that also young normal-hearing listeners benefit from a WRMS. Even at the lowest noise level of 60 dB SPL an improvement in speech intelligibility (difference of the medians) of approx. 25 percentage points was reached. At 65 dB SPL an improvement of approximately 40 percentage points, and at 70 dB SPL of approximately 55 percentage points was noticed. Thus, the benefit increased with increasing noise level. Nevertheless, since the absolute value of speech intelligibility with and without WRMS decreases, it is expected that there is a maximum benefit at a certain noise level. Beyond this noise level the benefit may decrease.
General discussion
A comparison of measurements between the simplified setup and measurements in a meeting room showed no differences in speech intelligibility when using a WRMS, and only minor differences without WRMS, which verifies the design. The small difference of approximately 7.5 percentage points without WRMS means that the speech intelligibility was reduced in the classroom. For the simplified setup, the distance is simulated by a reduction in sound pressure level according to the distance law whereas the measurements in the meeting room also included effects of the room acoustics. Thus, the lower speech recognition score in the meeting room may be explained by effects of the room acoustics. Nevertheless, for old hearing-impaired and young normal-hearing listeners tested in noise levels between 60 dB SPL and 70 dB SPL a significant benefit with WRMS was shown. Thus, the user can experience the benefit, and the gain in speech intelligibility can be documented, e.g. to justify costs and get reimbursement. Moreover, it is possible to remark that the benefit would be a little higher in the reference situation (approximately 7.5 percentage points) than in the simplified setup.
From an audiological point of view, it is not only interesting to measure the benefit of a WRMS but also to compare the performance with and without WRMS to the performance of young normal-hearing listeners. For instance, if a hearing aid user would reach a speech intelligibility of 70% at 60 dB noise level and 65 dB speech level without WRMS, the performance is comparable to the performance of young normal-hearing listeners (). In this case, it is possible to conclude that hearing aids alone are sufficient to fully compensate for difficulties in this situation. However, older test subjects with a typical hearing loss of type N3 may never reach the performance of young normal-hearing listeners in a situation with speech from a distance, even if they use their hearing aids (). There are many different factors that may contribute to these differences, e.g. a limited temporal and spectral resolution of hearing, reduced cognitive abilities, or age (Füllgrabe et al. Citation2015). Beside these factors, one reason for differences is that people usually sit at a distance to the speaker that is larger than the critical distance of the room. Hence, the directional microphones of the hearing aids cannot help in this situation. Overall, the results suggest that older people with reduced hearing ability require not only hearing aids but also a WRMS to reach the same performance as young normal-hearing subjects while listening to speech from a distance in noise. Furthermore, for any other individual situation, e.g. with hearing aids, implants, with an auditory processing disorder (APD), it is now possible to measure the speech intelligibility without WRMS and compare it with the normative data of . If the speech intelligibility is significantly lower this may be an indication that a WRMS alone or in addition to other devices such as hearing aids or implants can help to compensate for deficits in this situation. Nevertheless, the comparison cannot be used for a detailed investigation of the underlying causes of the deficit, e.g. it is not possible to distinguish between effects of hearing loss and age.
In a next step, if a WRMS is considered as a potential support, it is important to verify the individual benefit. Improving audibility and SNR through the use of WRMSs might not help with all difficulties experienced while listening to speech from a distance in noise. Moreover, there are different WRMSs available and the user needs to find a system that best matches the individual needs. For both, the simplified setup can be used. The results of show that digital systems offer higher speech intelligibility compared to the analog system and differences become clearer at higher noise levels. Furthermore, in our experiment, subjective ratings show similar results as the speech test, which may suggest that they measure a similar or overlapping construct.
Conclusions
The results of three studies verify the design of the simplified measurement setup and demonstrate its capabilities. The simplified setup is designed in a way that important features of a meeting room or classroom situation are preserved, whereas the complexity is kept managable. This means standard audiological equipment such as a two-channel speech audiometer and an audiological test room of typical dimensions are required. Although the measurement setup for a WRMS is simplified, it realistically emulates a situation where people are listening to speech in noise from a distance, such as in a classroom or meetings. Since the setup has been incorporated into guidelines of the European Union of Hearing Aid Acousticians, detailed information for the realisation is freely available (EUHA 2017), e.g. for hearing -aid professionals, audiologists, ENT specialists, etc. The studies presented here demonstrate that the setup has various useful applications. First, it can be determined, if people have a deficit in terms of speech intelligibility compared to young normal-hearing listeners while listening to speech from a distance in noise. Second, it can be measured whether or not a WRMS can help to compensate for this deficit reaching the same speech intelligibility as young normal-hearing listeners in this situation. Third, the individual speech intelligibility benefit can be experienced by the user in clinical practice and documented, e.g. to health insurances to justify the costs. Fourth, different systems can be compared to each other in a realistic, yet reproducible spatial setting to select the most suitable system for the user. Fifth, the configuration and functionality of the system can be checked. Overall, an individual evaluation with the simplified setup can help that more people benefit from WRMSs.
Acknowledgements
The authors thank all the following people who have provided valuable inputs for the concept and design of the measurement setup. Names are listed in alphabetical order: Martin Blecker, Harald Bonsel, Josef Chalupper, Vincent Gansel, Beate Gromke, Dan Hilgert-Becker, Inga Holube, Thorsten Knoop, Steffen Kreikemeier, Thomas Lenck, Martin Lützen, Michael Quante, Reimer Rohweder, Katharina Roth, Torsten Saile, Rainer Schönweiler, Laurie Vietheer, Markus Westerheide, Thomas Wiesner. Special thanks also to the associate editor Christian Füllgrabe and to the anonymous reviewers for constructive valuable feedback that greatly improved the paper.
Disclosure statement
The authors report no conflicts of interest.
Notes
1 Throughout this work, significant effects are indicated with stars where “*” corresponds to p < .05, “**” to p < .01, and “***” to p < .001.
References
- AAA. 2011. Clinical Practice Guidelines: Remote Microphone Hearing Assistance Technologies for Children and Youth from Birth to 21 Years. American Academy of Audiology.
- ANSI/ASA S3.47. 2014. Specification of Performance Measurement of Hearing Assistance Devices/Systems. American National Standards Institute.
- ASHA Ad Hoc Committee on FM Systems. 2002. Guidelines for Fitting and Monitoring FM Systems. American Speech-Language-Hearing Association.
- Bagatto, M., J. DesGeorges, A. King, P. Kitterick, D. Laurnagaray, D. Lewis, P. Roush, D. P. Sladen, and A. Marie Tharpe. 2019. “Consensus Practice Parameter: Audiological Assessment and Management of Unilateral Hearing Loss in Children.” International Journal of Audiology 58: 805–815. doi:https://doi.org/10.1080/14992027.2019.1654620
- Benítez-Barrera, C. R, et al. 2019. “Remote Microphone System Use at Home: Impact on Child-Directed Speech.” Journal of Speech, Language, and Hearing Research 62 (6): 2002–2008. doi:https://doi.org/10.1044/2019_JSLHR-H-18-0325.
- Chisolm, T. H., C. M. Noe, R. McArdle, and H. Abrams. 2007. “Evidence for the Use of Hearing Assistive Technology by Adults: The Role of the FM System.” Trends in Amplification 11 (2): 73–89. doi:https://doi.org/10.1177/1084713807300879.
- Crandell, C., J. Smaldino, and C. Flexer. 2005. Sound Field Amplification: Applications to Speech Perception and Classroom Acoustics. Thomson Delmar Learning.
- Cruz, A. D. d, et al. 2019. “The Effects of Using Hearing Aids and a Frequency Modulated System on Listening Effort among Adolescents with Hearing Loss.” International Journal of Audiology 59: 117–123. doi:https://doi.org/10.1080/14992027.2019.1671992.
- Davis, D., and E. Patronis. 2014. Sound System Engineering. 3rd ed. Indianapolis, IN: Taylor & Francis.
- EUHA. 2017. Wireless remote microphone systems – configuration, verification and measurement of individual benefits [Online]. https://www.euha.org/content/uploads/2020/12/euha-guideline-04-06-en.pdf
- Fitschen, C., J. Tchorz, and H. Husstedt. 2017. Vergleich des Sprachverstehens bei verschiedenen drahtlosen Übertragungsanlagen (FM-Anlagen) [Comparison of Speech Intelligibility of Different Wireless Remote Microphone Systems (FM systems)]. Aalen, Germany: Deutsche Gesellschaft für Audiologie e.V.
- Fitzpatrick, E. M, et al. 2010. “Users’ Perspectives on the Benefits of FM Systems with Cochlear Implants.” International Journal of Audiology 49 (1): 44–53. doi:https://doi.org/10.3109/14992020903202512.
- Füllgrabe, C., B. C. J. Moore, and M. A. Stone. 2015. “Age-Group Differences in Speech Identification Despite Matched Audiometrically Normal Hearing: Contributions from Auditory Temporal Processing and Cognition.” Frontiers in Aging Neuroscience 6: 347. doi:https://doi.org/10.3389/fnagi.2014.00347.
- Griepentrog, S., M. Frenz, T. Jürgens, and H. Husstedt. 2019. “Comparison of the Individual Benefit of a Wireless Remote Microphone System in the Laboratory with the Situation in a Classroom.” Heidelberg, Germany: Deutsche Gesellschaft Für Audiologie e.V.
- Hahlbrock, K.-H. 1957. Sprachaudiometrie [Speech audiometry]. 1st ed. Stuttgart: Thieme.
- Holube, I., S. Fredelake, M. Vlaming, and B. Kollmeier. 2010. “Development and Analysis of an International Speech Test Signal (ISTS).” International Journal of Audiology 49 (12) : 891–903. doi:https://doi.org/10.3109/14992027.2010.506889.
- Hopkins, H., and N. Stryker. 1948. “A Proposed Loudness-Efficiency Rating for Loud-Speakers and the Determination of System Power Requirements for Enclosures.” Proceedings of the IRE 36 (3): 315–335. March, doi:https://doi.org/10.1109/JRPROC.1948.226221.
- Husstedt, H. 2016. Praxistaugliche und realitätsnahe Messung des Sprachverstehen für drahtlose Übertragungsanlagen [Practical and realistic measurement of speech intelligibility of wireless remote microphone systems]. Hannover, Germany: Deutsche Gesellschaft für Audiologie e.V.
- Husstedt, H., and C. Fitschen. 2018. Nutzens von drahtlosen akustischen Übertragungsanlagen bei Menschen ohne Hörbeeinträchtigung [Benefit of Wireless Remote Microphone Systems for People without Hearing Loss]. Halle, Germany: Deutsche Gesellschaft für Audiologie e.V.
- Husstedt, H., and J. Steinhauer. 2016. Practicability Study of a Setup for the Evaluation of Wireless Remote Microphone Technology. Phoenix, AZ, American Academy of Audiology.
- IEC 60118-15. 2012. Electroacoustics – Hearing Aids – Part 15: Methods for Characterising Signal Processing in Hearing Aids with a Speech-like Signal. International Electrotechnical Commission.
- IEC 60645-1. 2017. Electroacoustics – Audiometric equipment – Part 1: Equipment for Pure-Tone and Speech Audiometry. International Electrotechnical Commission.
- International Telecommunication Union (ITU). 1993. [Online]. Accessed April 12 2016. www.itu.int/rec/T-REC-G.227-198811-I/en
- ISO 21388. 2020. Acoustics – Hearing Aid Fitting Management (HAFM). International Organization for Standardization.
- ISO 8253-3. 2012. Acoustics – Audiometric Test Methods – Part 3: Speech Audiometry. International Organization for Standardization.
- Katz, J., M. Chasin, K. English, and L. Hood. 2014. Handbook of Clinical Audiology. 7th ed. Philadelphia, PA: Lippincott Williams & Wilkins.
- Kolderup, K. 2020. LE Audio and the Future of Hearing. Las Vegas, NV: Bluetooth Special Interest Group (SIG).
- Maidment, D. W., A. B. Barker, and J. Xia. 2018. “A Systematic Review and Meta-Analysis Assessing the Effectiveness of Alternative Listening Devices to Conventional Hearing Aids in Adults with Hearing Loss.” International Journal of Audiology 57 (10): 721–729. doi:https://doi.org/10.1080/14992027.2018.1493546.
- Metz, M. 2014. Sandlin’s Textbook of Hearing Aid Amplification: Technical and Clinical Considerations. Plural Publishing.
- Musiek, F. E., G. D. Chermak, D.-E. Bamiou, and J. Shinn. 2018. “CAPD: The Most Common ‘Hidden Hearing Loss’.” The ASHA Leader 23: 6–9. doi:https://doi.org/10.1044/leader.FMP.23032018.6.
- Nilsson, M., S. D. Soli, and J. A. Sullivan. 1994. “Development of the Hearing in Noise Test for the Measurement of Speech Reception Thresholds in Quiet and in Noise.” The Journal of the Acoustical Society of America 95 (2): 1085–1099. doi:https://doi.org/10.1121/1.408469.
- Schafer, E. C., and L. M. Thibodeau. 2006. “Speech Recognition in Noise in Children with Cochlear Implants While Listening in Bilateral, Bimodal, and FM-System Arrangements.” American Journal of Audiology 15 (2): 114–126. doi:https://doi.org/10.1044/1059-0889(2006/015).
- Schafer, E. C., J. Wolfe, T. Lawless, and B. Stout. 2009. “Effects of FM-Receiver Gain on Speech-Recognition Performance of Adults with Cochlear Implants.” International Journal of Audiology 48 (4): 196–203. doi:https://doi.org/10.1080/14992020802572635.
- Studebaker, G. A. 1985. “A "Rationalized" Arcsine Transform.” Journal of Speech, Language, and Hearing Research 28 (3): 455–462. doi:https://doi.org/10.1044/jshr.2803.455.
- Thibodeau, L. 2010. “Benefits of Adaptive FM Systems on Speech Recognition in Noise for Listeners Who Use Hearing Aids.” American Journal of Audiology 19 (1): 36–45. doi:https://doi.org/10.1044/1059-0889(2010/09-0014).
- Thibodeau, L. 2014. “Comparison of Speech Recognition with Adaptive Digital and FM Remote Microphone Hearing Assistance Technology by Listeners Who Use Hearing Aids.” American Journal of Audiology 23 (2): 201–210. doi:https://doi.org/10.1044/2014_AJA-13-0065.
- Valente, M., H. Hosford-Dunn, and R. Roeser. 2008. Audiology: Treatment. Thieme.
- Vroegop, J. L., J. G. Dingemanse, N. C. Homans, and A. Goedegebure. 2017. “Evaluation of a Wireless Remote Microphone in Bimodal Cochlear Implant Recipients.” International Journal of Audiology 56 (9): 643–649. 09 02, doi:https://doi.org/10.1080/14992027.2017.1308565.
- Vroegop, J. L., N. C. Homans, A. Goedegebure, and M. P. van der Schroeff. 2018. “A Directional Remote-Microphone for Bimodal Cochlear Implant Recipients.” International Journal of Audiology 57 (11): 858–863. doi:https://doi.org/10.1080/14992027.2018.1508896.
- Walker, E. A., M. Curran, M. Spratford, and P. Roush. 2019. “Remote Microphone Systems for Preschool-Age Children Who Are Hard of Hearing: Access and Utilization.” International Journal of Audiology 58: 200–207. doi:https://doi.org/10.1080/14992027.2018.1537523.
- Winkler, A., and I. Holube. 2018. “Einfluss des Störgeräuschs auf das Sprachverstehen von Einsilbern [Effect of Noise on Speech Recognition of Monosyllables].” Zeitschrift Für Audiologie 57: 138–147.
- Winkler, A., I. Holube, and H. Husstedt. 2019. “Der Freiburger Einsilbertest im Störschall [The Freiburg Monosyllabic Speech Test in Noise].” Zeitschrift Für HNO 68: 1–11. doi:https://doi.org/10.1007/s00106-019-00763-6.
- Zanin, J., and G. Rance. 2016. “Functional Hearing in the Classroom: Assistive Listening Devices for Students with Hearing Impairment in a Mainstream School Setting.” International Journal of Audiology 55 (12): 723–729. doi:https://doi.org/10.1080/14992027.2016.1225991.