
Abstract
Objective
The traditional method of recording electrically evoked compound action potentials (ECAPs), as implemented in the MAESTRO clinical software (standard ART), requires manual adjustments during threshold determination through a specialist. The “FineGrain” research tool (FineGrain RT) uses a continuous stimulation paradigm combined with automatic ECAP threshold determination. The aim of this study was to compare the FineGrain RT with standard ART.
Design
ECAPs were recorded with standard ART and the FineGrain RT in paediatric cochlear implant recipients. Different stimulation rates were used for FineGrain ECAP recordings (40, 60, and 76 Hz).
Study sample
Thirteen children (6 − 19 years) participated in this study - nine were bilaterally and four unilaterally implanted, resulting in a total of twenty-two implanted ears.
Results
ECAP threshold determination success rates were similar between the two approaches (92% and 89%) and ECAP thresholds correlated well (r: 0.94, p < 2.2e–16) with average ART thresholds being lower than FineGrain RT thresholds. FineGrain stimulation with different stimulation rates did not have a significant effect on ECAP thresholds but ECAP thresholds at medial and apical contacts were lower compared to basal contacts.
Conclusions
TheFineGrain research approach is a reliable replacement for standard ART in clinical practice.
1. Introduction
A cochlear implant (CI) is a surgically implantable electronic device that can restore hearing in cases of severe to profound hearing loss. To date, CIs are among the most successful neural prostheses in clinical use (Roche and Hansen Citation2015).
After surgically implanting a CI, the device is individually programmed for the new user in a process called fitting. Fitting includes adjusting settings on the CI for optimal sound quality. An important parameter for this is the maximum comfortable loudness (MCL) for each channel. Clinicians/audiologists use a combination of objective and subjective measures in designated fitting procedures.
Electrically evoked compound action potentials (ECAPs) are an objective measure that allows clinicians to evaluate the integrity of the electrode-neuron interaction (Brown, Abbas, and Gantz Citation1990). The most frequently used characteristic of ECAP recordings are thresholds, which are recorded by clinics intraoperatively and/or postoperatively in a process termed Auditory Response Telemetry (ART) (Vaerenberg et al. Citation2014). During an ECAP recording, the CI creates electric stimuli with increasing charge on one electrode contact and monitors the response (i.e. the compound action potentials) of the neuronal fibres in the cochlea at one or more other electrodes.
Stimulation levels used for ECAP recordings start from zero charge to a pre-defined maximum value or to the maximum intensity tolerated by the CI user. A standard ECAP response consists of a negative peak (N1) followed a maximum positive peak (P2) (Lai and Dillier Citation2000) and shows characteristics like amplitude and latency. Amplitude is normally measured as the difference between the N1 and P2 peaks of the ECAP curve and can be as large as 2 mV (Brown et al. Citation2000). The ECAP amplitude increasing with charge can be displayed as amplitude growth function (AGF) (Cohen Citation2009), which can be used to determine ECAP thresholds (the minimum stimulation charge that results in a detectable ECAP response). Most clinical software provide the possibility of displaying the AGF for each electrode contact at different stimulation levels and a method to determine the ECAP threshold.
Recording ECAPs of the auditory nerve provides numerous advantages for clinics: firstly, it enables the clinicians to evaluate the status of the auditory nerve, to monitor the integrity of the CI, and to confirm that electrical stimulation leads to an ECAP response. Secondly, ECAP recordings can be used to monitor peripheral auditory function over time. Thirdly, the signal does not depend on the consciousness or the active participation of the CI recipient and it can be measured intraoperatively or postoperatively. And finally, ECAP recordings are sometimes used for individual adjustment of parameters like the MCL during the CI fitting procedure. This is especially relevant in paediatrics or when CI users are not able to give perceptual feedback. It should be noted, however, that the ECAP threshold measure is not definitive evidence of a normally functioning auditory nerve. Good performing CI users can also lack usable ECAP responses or have responses that make it difficult to determine a threshold (Alvarez et al. Citation2010; Cullington Citation2000). It has been suggested that the reasons for such cases might be ECAP thresholds being higher than the maximum stimulation levels tolerated by CI users (Alvarez et al. Citation2010; Cullington Citation2000) or due to poor synchronisation of responses by activated neurons (Alvarez et al. Citation2010).
Other data from ECAP recordings, like the AGF slope and latency of the response, are likely to become more relevant in the future as they might allow monitoring of cochlear health (Ramekers et al. Citation2014).
Improving the accuracy and robustness of ECAP recordings as well as standardising the procedure through automatisation is of high interest for both clinicians and researchers. Replacing manual evaluation of the AGF by an automatic procedure has also been shown to reduce time of the recording procedure in clinical practice (Garrido et al. Citation2018).
In this study, we tested two approaches for ECAP recordings and threshold determination: the standard ART feature of the Clinical Software MAESTRO 6 and a research software with an alternative stimulation/recording paradigm and algorithm for threshold determination (i.e. the FineGrain Research Tool). Standard ART gives a crude estimate of the ECAP threshold but requires a manual confirmation of the presence of the ECAP response by an experienced clinician while the FineGrain Research Tool (FineGrain RT), automatically determines the threshold without the need for manual adjustment. It should be noted that part of the FineGrain RT has been implemented in the AutoART feature of MAESTRO 7 (Strahl et al. Citation2018), however, final AutoART was not assessed in this study. The FineGrain RT, as tested in this study, differed from AutoART in the following aspects: the tool was split in two parts, namely the FineGrain recording where the measurements were collected and stored and a separate analysis script that applied the algorithms to the recorded measurements for determining the ECAP threshold. Those algorithms for ECAP threshold determination were, in their core, the same as what has been implemented in AutoART later. However, the default settings for the FineGrain recording differed from AutoART, as stimulation in FineGrain required a manual stop by the clinician upon loudness discomfort for the study participant. In the default setting of AutoART, stimulation stops automatically once a stable estimate for the ECAP threshold is being reached (of course a manual stop by the clinician is always possible if there is loudness discomfort).
When recording an ECAP, various settings can be adjusted, e.g. the phase duration of the stimulation pulses or the frequency of the stimulation rate. Early research on ECAPs demonstrated that at higher stimulation rates the number of valid ECAP responses, the amplitude, and the quality of the response decreases (Charasse et al. Citation2004), particularly when comparing rates of 20 and 80 Hz to rates ≥150 Hz (Charasse et al. Citation2004). FineGrain is a unique stimulation paradigm where intensity is increasing over quasi-continuous steps and moving averages over responses of approximately identical stimulation levels are computed. In the ART stimulation paradigm, intensity increases stepwise, with gaps in between, and responses are averaged over repetitions of identical stimulation levels. If sound of a particular frequency is continuously stimulating a particular set of neurons, the decrease in neural activities because of continuous stimulation could be due to refractoriness and adaption. FineGrain is the first continuously stimulating paradigm for ECAP recordings, therefore we explored if uninterrupted stimulation during the recording has any measurable effect on the ECAP responses at rates below 100 Hz. We choose three frequencies at 100% (40 Hz), 150% (60 Hz), and 190% (76 Hz) of the presentation frequency used for blocked stimuli in the compared ART task. The phase duration was kept constant at 40 µs throughout the study, but since the maximum stimulation intensity is crucial for ECAP success we opted for an increase of phase duration up to 50 µs in cases where the intended stimulation intensities would have not been reached otherwise.
The primary objective of this study was to evaluate the two ECAP recording approaches, standard ART and the FineGrain RT, in terms of threshold determination success and comparability. With the FineGrain RT, we also aimed to investigate the influence of different stimulation rates and contact sites on ECAP thresholds.
2. Materials and methods
2.1. Participants
Thirteen CI users participated in this study, nine were bilaterally implanted and four were unilaterally implanted, resulting in a total of twenty-two implanted ears. The age range of the participants was 6 to 19 years. The usage time of the implant among the participants was between 1 and 10 years. Detailed demographic information is available in .
Table 1. Details on the demographic of the study participants. All implants were manufactured by MED-EL (Innsbruck, AUSTRIA).
All participants had prelingual deafness and were implanted with a CI from MED-EL GmbH (Innsbruck, Austria). In terms of aetiology of deafness, six were unknown, one had hyperbilirubinemia, one had hereditary hearing loss, two were premature births, one had an infection, and two had Waardenburg Syndrome.
All participants were part of the CI program of the Fundación Arauz (Buenos Aires, ARGENTINA), which involves regular follow-up visits for CI evaluation and fitting. Written informed consent for study participation was obtained from the participant’s parents.
2.2. Hardware & software for ECAP recordings
A standard clinical setup was used for ECAP recordings involving a MAX Programming Interface and a PC with MAESTRO 6.0.1 clinical software and the FineGrain RT software developed for research purposes only, from MED-EL GmbH (Innsbruck, Austria).
The FineGrain RT enabled a quasi-continuous stimulation intensity growth, whereby the stimulation rate of single pulses and the stimulation intensity growth per second could be adjusted. For both ECAP recording paradigms, alternating polarity and signature subtraction were used to reduce artefacts (Miller et al. Citation1998). For the standard ART analysis, an alternative selection of a sub-threshold recording with a stimulation intensity >0 was used as signature recording. For standard ART AGFs, clinical specialists manually selected traces that showed neural responses.
The key differences between both approaches lie within the intensity growth of the AGF and the ECAP threshold determination. When recording the AGF of ECAPs with standard ART, the stimulation intensity increases in discrete, predefined steps and averages over a set number of iterations at the same intensity to reduce measurement noise. The FineGrain method uses a much smaller step size compared to ART: 0.3 qu versus 2.1 qu, respectively. The necessary iterations to reduce noise were obtained by averaging responses (including noise) over recordings of sequential stimuli within a small range of intensities (0.96 qu for 76 Hz up to 1.8 qu for 40 Hz) (Gärtner, Lenarz, and Buchner Citation2018). Consequently, the resolution of the FineGrain AGF is higher, which, as has been shown earlier (Garrido et al. Citation2018), can improve accuracy of threshold determination.
In terms of ECAP threshold determination, both methods apply a fit to the amplitude growth function: for standard ART a linear fit is used and above-threshold amplitudes are manually (de)selected by the clinician yielding in an ECAP threshold – this was representative of standard clinical practice (with the MAESTRO Software). The FineGrain method works fully automatic by applying the parameters of a sigmoid function and derives the threshold through linear extrapolation from the inflection point of the sigmoid and the baseline (Strahl et al. Citation2018). Manual (de)selection of AGF-datapoints by the clinician is not needed with the FineGrain approach. Linear extrapolation from the AGF (as in ART), has been used historically to determine the ECAP threshold from the AGF. However, the whole AGF is in fact not linear but is best characterised by a sigmoidal shape (s-shape) and using the entire shape of the FineGrain AGF (which contains more ECAP amplitude recordings) promises a more robust slope and ECAP threshold (Strahl et al. Citation2018).
2.3. Settings ECAP recordings
Postoperative ECAP recordings were collected from 22 implanted ears with the standard ART with MAESTRO 6.0.1 and the FineGrain RT. All recordings were performed within one session. The recording parameters are shown in . The stimulating contacts for both approaches (ART and FineGrain) were 2, 6 and 10. The default recording contact selection was used in both approaches: ART selects the adjacent contact (S2 – R1, S6 – R5, S10 – R9) while the FineGrain RT records up to two neighbouring apical and up to two neighbouring basal contacts and selects automatically the best stimulating/recording contact pair (Strahl et al. Citation2018). The selection of the best contact is based mainly on whether the contact shows a sigmoidal shaped AGF of sufficient quality (e.g. noise, r2) and whether the threshold is representative among the contacts (i.e. closest to median of the selected AGFs among recording contacts). The quality determination of the AutoART algorithm is based on an automatic system, where all determined parameters of the AGF-fitting function affect the quality limits of each other. Due to physiological considerations, the ECAP thresholds are expected to remain constant for different recording contacts. Therefore, we took (with the median) a non-parametric estimator for ECAP threshold.
Table 2. Recording parameters and settings for standard ART and FineGrain approaches.
2.4. Data Analysis
Data analysis was performed using R programming language and statistical environment version 1.1.419 (R Core Team Citation2018; RStudio Citation2018) and Microsoft Excel.
Recordings with the different stimulation rate settings and electrode contacts were performed in randomised fashion.
For analysing ECAP threshold differences between stimulation rates and electrode contacts, a linear mixed-model approach was chosen over a 2-way ANOVA as the occasional missing value does not pose a problem for linear mixed models. The statistical analysis had two aims: first, to investigate whether ECAP thresholds are affected by different stimulation rates and second, to investigate whether stimulus contact location is affecting ECAP thresholds. The analysis was modelled using EarID as a random variable and the independent variables, stimulation rate and electrode contact, as fixed variables. The statistical significance was confirmed by post-hoc pair-wise testing of means, where the p-values were adjusted for multiple comparisons according “Tukey”. The packages “lmerTest” (Kuznetsova, Brockhoff, and Christensen Citation2017) and “lme4” (Bates et al. Citation2015), function “lmer” were used for the linear mixed model and “multcomp” (Hothorn, Bretz, and Westfall Citation2008), function “glht” for the multiple comparisons.
3. Results
3.1. Standard ART and FineGrain were similarly successful in ECAP threshold determination and ECAP thresholds correlated
To judge the applicability of the FineGrain approach as a replacement for standard ART, ECAP thresholds obtained using both methods and their overall success rates were compared. Per participant, we recorded ECAPs at three intra-cochlear electrode contacts that were representative of the different regions of the cochlea: basal – contact 10, middle – contact 6, and apical – contact 2 (Supplementary Figure 1).
The success of ECAP threshold determination was defined as obtaining valid and recognisable nerve responses together with the AGF allowing for threshold determination. For this calculation, we simply took all the stimulating contacts where a measurement has been performed in both ART and FineGrain RT (or FineGrain at the three stimulation rates), and checked whether a threshold could be determined (success) or not (no success) using the respective method. The purpose of the success measure in this study was to understand if the FineGrain research software as a method can deliver a comparable amount of ECAP thresholds as the normal ART approach in a clinical setting. Similarly high success rates were obtained for both recording methods, namely 92% for FineGrain RT and 89% for standard ART. These rates were in accordance with previously published literature, which reported approximately 80% success with their ECAP recordings (Brill et al. Citation2009).
A correlation analysis was performed on the automatically determined ECAP thresholds of FineGrain RT and the manually adjusted ones from standard ART and a good correlation was found with a Pearson’s r of 0.94 [; H0: r = 0 was rejected; p < 2.2e–16]. Standard ART thresholds were significantly lower than FineGrain RT thresholds [(t(47) = −11.8, p = 1.22e–15); ] with the mean of the differences being −1.9 qu.
Figure 1. (A) Correlation analysis of ECAP thresholds determined with the FineGrain RT approach and standard ART. Pearson correlation coefficient (R) and the corresponding p value are shown. (B) Comparison of average ECAP thresholds determined with the FineGrain RT and standard ART. ECAP thresholds from all contacts were pooled. Grey diamond and number indicate the respective mean. The p value indicated on top is the result from a paired T test. qu = charge units (1 qu ≈ 1 nC).
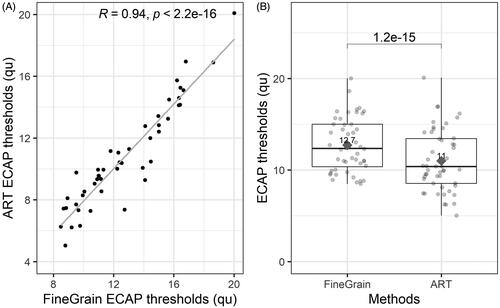
In short, the automatic approach of FineGrain RT and the manual approach of standard ART were similar in terms of success and ECAP thresholds were correlated, which means that even though the exact ECAP threshold value was different between the two methods, there was a strong association between the ECAP threshold profile across the electrode array recorded with the two methods.
3.2. FineGrain ECAP recording results were not affected by different stimulation rates but were affected by site of stimulation
To evaluate the FineGrain RT further, the effect of variations of stimulation rate on ECAP thresholds was tested. ECAPs were recorded at contacts 2, 6, and 10 with stimulation rates of 40, 60, and 76 Hz. The success rates across the different stimulation rates were similar with 92% at 40 Hz, 82% at 60 Hz, and 90% at 76 Hz. The ECAP thresholds per electrode contact and stimulation rate are shown in Supplementary Figure 2 and a linear mixed effects model (LMM) was used to assess statistically relevant differences. Stimulating electrode contact (factor with 3 levels) and stimulation rate (factor with 3 levels) were treated as fixed effects and EarID was treated as random effect. Individual ears (EarID) were used as random term rather than individual subject, due to some participants being bilaterally implanted. The approach was to construct several models sequentially: a model without fixed effects (Null-Model), followed by a model with stimulating electrode channel as fixed effect with contact 6 as reference group for the other two contacts (Electrode-Model) (Supplementary Table 1). Contact 6 was chosen due to its medial location in the electrode array. For the Electrode-Model, there was a statistically significant change in logLikelihood (Δχ2 = 41.1 with a Pr(>Chisq) of 1.7*10−9), improving the goodness of fit (Supplementary Table 1). The third model included both electrode channel and stimulation rate as fixed effects (Electrode-Rate-Model), whereby the stimulation rate of 60 Hz was used as reference group as it represents the default setting of the FineGrain Research Tool Software. The Electrode-Rate-Model did not significantly improve the goodness of fit (Supplemental Table 1). The fourth model included, in addition to electrode channel and stimulation rate, the interaction between those two factors but, again, did not improve the prediction significantly, resulting in the conclusion that the Electrode-Model was the best fit for the data. The estimated differences between ECAP thresholds across the contacts and the 95% confidence intervals are shown in (and Supplementary Table 2). The predicted ECAP thresholds display statistically significant differences at all three stimulating electrodes monitored: Thresholds recorded at contact 6 are lower than at contact 2 and 10 [, Supplementary Table 2]. Thresholds from contact 10 were higher than at contact 2, however, this difference was less pronounced than between contacts 6 and 10 and 6 and 2 [, Supplementary Table 2]. Assumptions for linear mixed model (normality, homoscedasticity and linearity of residuals) were assessed and confirmed validity of this model (data not shown).
Figure 2. Results from the linear mixed model analysis on the effect of contact position onto ECAP thresholds. Point estimates of the ECAP threshold differences between contacts are shown with their respective confidence interval. Y-axis labels are the compared contacts with the second number being the reference point indicated as dotted line at 0. E.g. 6 – 2 refers to the differences between contacts 6 and 2, with contact 2 as reference point and indicates that contact 6 has lower ECAP thresholds than 2. This difference is significant as the confidence interval of the point estimate does not comprise the reference value. Exact values are shown in . qu = charge units (1 qu ≈ 1 nC).
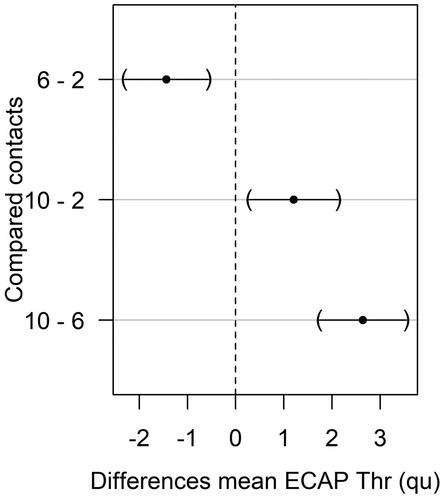
In conclusion, the different stimulation rates tested here did not affect ECAP thresholds while position of the stimulating contact did: the lowest thresholds were found at the medial contact (6), and highest thresholds at the basal contact (10).
3.3. Fair correlation between FineGrain thresholds and maximum comfortable levels in the apical region
As we found a significant effect of stimulation site on ECAP thresholds, we wanted to investigate if there are differences between electrode contacts in terms of correlation between ECAP thresholds and MCLs.
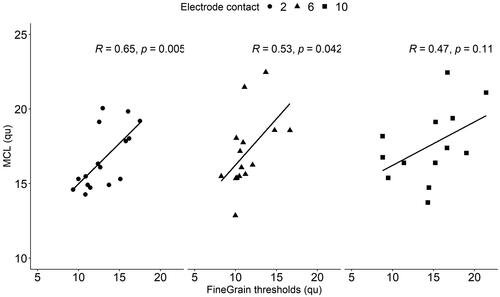
Fair and statistically significant correlations between MCLs and ECAP thresholds (measured at 60 Hz Stimulation rate) were found at contact 2 (; Pearson’s r = 0.65; p = 0.005) and 6 (; Pearson’s r = 0.53; p = 0.042). At the basal contact 10, no statistically significant correlation could be found.
Figure 3. Correlation analysis of maximum comfort levels (MCLs) with ECAP thresholds determined with the FineGrain RT approach (at a stimulation rate of 60 Hz). Pearson corr. coefficient (R) and corresponding p value are indicated on top of each panel. qu = charge units (1 qu ≈ 1 nC).
4. Discussion
In this study, we compared a novel method (FineGrain RT) for ECAP measurements in with standard ART. For FineGrain RT, we tested further if different stimulation rates and contact position affected ECAP thresholds and we explored correlation of thresholds with MCLs per cochlear region.
4.1. Performance of the two ECAP recording approaches
The measurement success from the FineGrain RT was comparable with standard ART, whilst circumventing the need for a manual adjustment step during ECAP threshold determination. We believe that to be a substantial advantage as it will eliminate biases caused by different clinical specialists doing these manual adjustments within and across clinics. While the correlation between the pooled ECAP thresholds determined with FineGrain RT and standard ART was good, several individual thresholds did not seem to correlate. Similar results were observed in another study using the FineGrain approach, where those discrepancies were attributed to a more thorough computation of the noise floor, which is fitted as a parameter within the sigmoid, as has been described earlier (Gärtner, Lenarz, and Buchner Citation2018; van de Heyning et al. Citation2016). Also, the intrinsic properties of the FineGrain threshold determination: for instance, the higher resolution of the FineGrain AGF compared to the standard ART AGF and the sigmoid fitting approach (Strahl et al. Citation2018) appeared to increase the precision of ECAP threshold determination (Garrido et al. Citation2018).
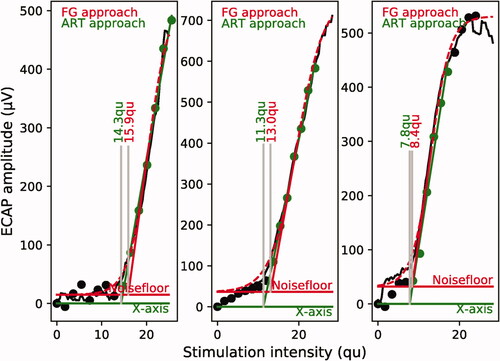
In this study, FineGrain thresholds were (significantly) higher than standard ART thresholds [], one possible reason for this are methodical differences in the ECAP threshold determination process: for ART a linear fit was applied manually through the steepest portion of the AGF while FineGrain RT fits a sigmoid to the AGF together with linear extrapolation from the inflection point of the sigmoid to the baseline (Strahl et al. Citation2018). To illustrate the methodical differences in threshold determination, we show three examples in , where the standard ART approach is displayed together with the respective FineGrain RT approach. The examples illustrate a) that the FineGrain approach results in a higher resolution of the response as there is enough data to display the AGF as a line (rather than single dots as with ART) and b) that linear extrapolation can result in lower thresholds due to extrapolation towards the x-axis even if an elevated noise level is recorded.
Figure 4. Three examples of ECAP amplitude growth functions recorded with ART and FineGrain. Stimulating contacts were 2, 6 and 10 from left to right. FG stands for FineGrain RT. Individual amplitudes are shown in black, as single dots for ART and single dots appearing as line for FineGrain. For ART, the amplitudes that were included for the linear fit by the expert are shown in green. Determined ECAP thresholds are indicated with the respective colour. qu = charge units (1 qu ≈ 1 nC).
While, historically, a linear fit to the AGF has been used to determine ECAP thresholds (Brown, Abbas, and Gantz Citation1990; Kim et al. Citation2010; Schvartz-Leyzac and Pfingst Citation2016), a number of earlier studies used a sigmoidal regression function instead (Ramekers et al. Citation2014; He et al. Citation2018; He et al. Citation2020), as it is thought to better characterise the well-known S-shape of the AGF (Miller, Abbas, and Rubinstein et al. Citation1999). One of the first approaches that used a sigmoidal fit to determine slope from ECAPs was done on data from guinea pigs (Ramekers et al. Citation2014). In animal experiments the S-shape of the AGF can be observed more frequently, as stimulation can run more readily into saturation. We believe in humans there are cases where saturation of the AGF cannot be reached due to loudness discomfort. In such cases, part of the sigmoid shape may not perfectly fit the AGF, however, the algorithm usually can still define an inflection point from where a line is extrapolated to define the ECAP threshold. The benefits over traditional linear extrapolation methods remain (i.e. automatic computation of noise floor, higher resolution of the AGF with FineGrain stimulation, automatic determination of the inflection point and linear part of the AGF), even though the fit might be a little less exact due to not reaching complete saturation.
We also evaluated stimulation duration of the two approaches and found the FineGrain RT to be approximately 2.5 times faster than standard ART, with mean recording times of 17 sec/stimulating contact and 42 sec/stimulating contact. Notably, standard ART records the response on a single recording contact while FineGrain RT uses four recording contacts and subsequently selects the best one (Strahl et al. Citation2018; Gärtner, Lenarz, and Buchner Citation2018). However, duration of threshold determination approaches (automatic for FineGrain RT and manual evaluation by eye for standard ART) were not included here but have been evaluated in more detail elsewhere (Garrido et al. Citation2018).
4.2. Effects of stimulation rate and site of stimulation on ECAP thresholds
Recordings of ECAPs are generally performed at low stimulation rates (35 − 80 Hz) while behavioural fitting levels are measured at high rates (250 − 3500 Hz). Earlier research demonstrated that the correlation between ECAP and behavioural thresholds (like MCLs) is best at equal stimulation rates (Brown, Abbas, and Gantz Citation1998; Franck and Norton Citation2001). On the other hand, it was also shown that higher stimulation rates (≥150 Hz) result in a decrease in the number of valid ECAP responses, their amplitude, and quality (Charasse et al. Citation2004). Two potential reasons for this effect have been suggested: (i) auditory neurons involved in the electrical response would act less synchronous at higher frequencies and (ii) more neurons are in a refractory state at higher frequencies, resulting in fewer neurons contributing to the neural response (Charasse et al. Citation2004).
We found no evidence for any effect of the three studied stimulation rates (40, 60 and 76 Hz) on ECAP thresholds using the quasi-continuous FineGrain stimulation paradigm (Gärtner, Lenarz, and Buchner Citation2018).
Stimulation site, on the other hand, had a substantial effect on ECAP thresholds determined with the FineGrain RT. This concerned especially the middle region of the cochlea where thresholds were significantly lower than for the basal and apical regions. This is in line with earlier research (using traditional stimulation paradigms) that demonstrated a significant threshold decrease towards the apex (Brill et al. Citation2009; Christov et al. Citation2019) or the middle region of the cochlea (van de Heyning et al. Citation2016) and indicates that those effects are independent of stimulation paradigm and threshold determination approach. It has been argued that the reasons for these position effects is the increasing proximity between the recording electrode and the surrounding tissue from basal to apical region and generally a greater density or survival of excitable neurons in the apex (Brill et al. Citation2009; van de Heyning et al. Citation2016). It should be noted that most participants of this study have been implanted with very long lateral wall electrode arrays (Standard with 31.5 mm and FLEX28 with 28 mm) allowing for insertions deep enough to reach the apical turn (Dhanasingh and Jolly Citation2017).
4.3. ECAP thresholds and MCLs
Loudness assessment for setting MCLs requires subjective responses from the CI users and sophisticated listening tasks. This part of the fitting process can be tiring, especially for children who often lack the listening experience, language or cognitive development which are required for determining MCLs (Souliere, Quigley, and Langman Citation1994).
ECAP thresholds are well accepted in clinical practice and have been suggested as starting points for programming loudness settings for new CI users. The direct use of ECAP thresholds for CI fitting is controversial as has been recently reported in a meta-analysis based on a large set of publications (published between 1995–2015), which analysed the correlation between ECAP thresholds and MCLs (Vos et al. Citation2018). The authors found that the Pearson’s r values were very varied across the 37 studies analysed, with poor correlations reported in some studies and fair correlations in others (Vos et al. Citation2018). It has been suggested that the biases that exists in various studies (i.e. subject selection, measurement collection, fitting strategies, or CI manufacturer) could have played a role here (Vos et al. Citation2018). It is possible that having a more accurate and standardised approach to measuring ECAPs, such as that provided by the FineGrain RT, could reduce some of the bias. We found that the correlation between MCLs and thresholds from an apical and medial contact was better compared to thresholds from a basal contact. This is interesting because the apex was proposed to have a higher neuron density and/or more neural cell survival compared to other regions of the cochlea (Brill et al. Citation2009; van de Heyning et al. Citation2016). Narrower distance between electrode and stimulating tissue or stimulating and recording contact could also be a factor here. For more definite statements, we would suggest recording FineGrain ECAPs along the complete electrode array in future studies. This would also allow to study correlation between MCLs and thresholds on an individual level, as was previously proposed in literature (Vos et al. Citation2018).
One factor that should be considered with the FineGrain RT is, that it records responses at several contacts and chooses the result from the “best” recording contact to display. Therefore, it is possible that different recording contacts have been chosen for each individual and measurement, which might affect the presented results. We did integrate also recording contact as a fixed factor in our linear mixed model and found no significant effect on the ECAP thresholds (data not shown). However, the current dataset was perhaps not ideal to provide a definite answer to that question, due to consisting only of three recordings per array.
In conclusion, our study showed that the FineGrain RT, an automatised research software for ECAP recordings, showed similar success rates as standard ART for ECAP threshold determination. The correlation between the thresholds from the compared approaches was high indicating that, in clinical practice, FineGrain RTand standard ART appear to result in similar ECAP threshold profiles over the electrode array. FineGrain ECAP thresholds were on average higher (1.9 qu) than ART thresholds - whether this difference is clinically relevant or not will largely depend on the application. In our opinion, for most current applications of ECAP thresholds, the profile is more relevant than the exact value of the threshold. We found no measurable effect of different stimulation rates on ECAP thresholds or quality and suggest that either of the rates can be applied in clinical practice. Furthermore, as has been previously demonstrated with standard ART, the thresholds were influenced by site of stimulation in recordings with FineGrain RT.
In summary, we believe that the FineGrain RT would be beneficial in clinical use due to several key benefits, namely standardisation and automatisation of ECAP threshold determination. Such improvements simplify the ECAP recording process in clinical practice and ultimately make recording outcomes more comparable across clinics.
Ethics approval and consent to participate
The study protocol was approved by the Ethics Committee of Fundación Arauz (Tte. Gral. J. D. Perón 2238, 2do piso, Buenos Aires, C1040AAH, ARGENTINA). Written informed consent for study participation was collected from participant’s parents. Written informed consent for publication was collected from the parents of all participants.
Author contributions
P.E., A.S., A.K. and K.S. conceived and designed the study. P.E., A.S. and A.K. collected the data. S.L.A. provided materials and guidance. K.L. performed data analysis. P.E., A.S., K.L., and K.S. wrote the manuscript. All authors read and approved the manuscript.
Acknowledgements
We would like to thank the study participants for their time and effort. Further, we would like to thank Laura Kerr (MED-EL) for language editing a version of this manuscript and the reviewers for helpful suggestion on the manuscript.
Disclosure statement
P.E. and A.S. declare that they have no competing interests. A.K., K.L., and K.S. are employed by MED-EL Medical Electronics (Innsbruck, Austria).
Data availability statement
The data that support the findings of this study are available on request from the corresponding author, P.E.
References
- Alvarez, I., A. Torre, M. Sainz, C. Roldán, H. Schoesser, and P. Spitzer. 2010. “Using Evoked Compound Action Potentials to Assess Activation of Electrodes and Predict C-Levels in the Tempo + Cochlear Implant Speech Processor.” Ear and Hearing 31 (2): 134–145. doi:https://doi.org/10.1097/AUD.0b013e3181bdb88f.
- Bates, D., M. Mächler, B. Bolker, and S. Walker. 2015. “Fitting Linear Mixed-Effects Models Using lme4.” Journal of Statistical Software 67 (1): 1–48. doi:https://doi.org/10.18637/jss.v067.i01.
- Brill, S., J. Müller, R. Hagen, A. Möltner, S.-J. Brockmeier, T. Stark, S. Helbig, et al. 2009. “Site of Cochlear Stimulation and Its Effect on Electrically Evoked Compound Action Potentials Using the MED-EL Standard Electrode Array.” Biomedical Engineering Online. 8 (12): 40. doi:https://doi.org/10.1186/1475-925X-8-40.
- Brown, C. J., M. L. Hughes, B. Luk, P. J. Abbas, A. Wolaver, and J. Gervais. 2000. “The Relationship between EAP and EABR Thresholds and Levels Used to Program the Nucleus 24 Speech Processor: data from Adults.” Ear and Hearing 21 (4): 151–163. doi:https://doi.org/10.1097/00003446-200004000-00009..
- Brown, C. J., P. J. Abbas, and B. Gantz. 1990. “Electrically Evoked Whole-Nerve Action Potentials: Data from Human Cochlear Implant Users.” Journal of the Acoustical Society of America. 88 (9): 1385–1391. doi:https://doi.org/10.1121/1.399716.
- Brown, C. J., P. J. Abbas, and B. J. Gantz. 1998. “Preliminary Experience with Neural Response Telemetry in the Nucleus CI24M Cochlear Implant.” American Journal of Otology 19 (5): 320–327.PMID: 9596182.
- Charasse, B., J. M. Chanal, C. Berger-Vachon, and L. Collet. 2004. “Influence of Stimulus Frequency on NRT Recordings.” International Journal of Audiology 43 (43): 236–244. doi:https://doi.org/10.1080/14992020400050032.
- Christov, F., M. Gluth, S. Hans, S. Lang, and D. Arweiler-Harbeck. 2019. “Impact of Cochlear Tonotopy on Electrically Evoked Compound Action Potentials (ECAPs).” Acta Oto-Laryngologica 139 (1): 22–25. doi:https://doi.org/10.1080/00016489.2018.1533993.
- Cohen, L. 2009. “Practical Model Description of Peripheral Neural Excitation in Cochlear Implant Recipients: 1. Growth of Loudness and ECAP Amplitude with Current.” Hearing Research 247 (2): 87–99. doi:https://doi.org/10.1016/j.heares.2008.11.003.
- Cullington, H. 2000. “Preliminary Neural Response Telemetry Results.” British Journal of Audiology 34 (3): 131–140. doi:https://doi.org/10.3109/03005364000000123.
- Dhanasingh, A., and C. Jolly. 2017. “An Overview of Cochlear Implant Electrode Array Designs.” Hearing Research 356 (12): 93–103. doi:https://doi.org/10.1016/j.heares.2017.10.005.
- Franck, K. H., and S. J. Norton. 2001. “Estimation of Psychophysical Levels Using the Electrically Evoked Compound Action Potential Measured with the Neural Response Telemetry Capabilities of Cochlear Corporation's CI24M Device.” Ear and Hearing 22 (8): 289–299. doi:https://doi.org/10.1097/00003446-200108000-00004
- Garrido, L. C., K. Schwarz, K. Lauss, C. Paula Vernetta, A. Kontides, M. D. Gomez, A. G. Calvete, and M. A. Carceller Department of ENT, La Fe University and Polytechnic Hospital, Valencia, Spain 2018. “Comparison of a Traditional and Novel Evoked Compound Action Potentials Recording Approach and Evoked Auditory Brainstem Responses in Pediatric Cochlear Implants Users.” The Journal of International Advanced Otology, 14 (3): 353–358. doi:https://doi.org/10.5152/iao.2018.5591.
- Gärtner, L., T. Lenarz, and A. Büchner. 2018. “Fine-Grain Recordings of the Electrically Evoked Compound Action Potential Amplitude Growth Function in Cochlear Implant Recipients.” BioMedical Engineering OnLine 17 (1): 140. doi:https://doi.org/10.1186/s12938-018-0588-z.
- He, S., B. S. Shahsavarani, T. C. McFayden, H. Wang, K. E. Gill, L. Xu, X. Chao, J. Luo, R. Wang, and N. He. 2018. “Responsiveness of the Electrically Stimulated Cochlear Nerve in Children with Cochlear Nerve Deficiency.” Ear and Hearing 39 (3): 238–250. doi:https://doi.org/10.1097/AUD.0000000000000467.
- He, S., L. Xu, J. Skidmore, X. Chao, W. J. Riggs, R. Wang, C. Vaughan, J. Luo, M. Shannon, and C. Warner. 2020. “Effect of Increasing Pulse Phase Duration on Neural Responsiveness of the Electrically Stimulated Cochlear Nerve.” Ear and Hearing 41 (6): 1606–1618. doi:https://doi.org/10.1097/AUD.0000000000000876.
- Hothorn, T., F. Bretz, and P. Westfall. 2008. “Simultaneous Inference in General Parametric Models.” Biometrical Journal 50 (3): 346–363. doi:https://doi.org/10.1002/bimj.200810425.
- Kim, J.-R., P. J. Abbas, C. J. Brown, C. P. Etler, S. O'Brien, and L.-S. Kim. 2010. “The Relationship between Electrically Evoked Compound Action Potential and Speech Perception: A Study in Cochlear Implant Users with Short Electrode Array.” Otology and Neurotology 31: 1041–1048. doi:https://doi.org/10.1097/MAO.0b013e3181ec1d92.
- Kuznetsova, A., P. B. Brockhoff, and R. H. B. Christensen. 2017. “lmerTest Package: Tests in Linear Mixed Effects Models.” Journal of Statistical Software 82 (13): 1–26. doi:https://doi.org/10.18637/jss.v082.i13.
- Lai, W. K., and N. Dillier. 2000. “A Simple Two-Component Model of the Electrically Evoked Compound Action Potential in the Human Cochlea.” Audiology & Neuro-Otology 5: 333–345. doi:https://doi.org/10.1159/000013899.
- Miller, C. A., P. J. Abbas, and J. T. Rubinstein. 1999. “An Empirically Based Model of the Electrically Evoked Compound Action Potential.” Hearing Research 135 (1-2): 1–18. doi:https://doi.org/10.1016/S0378-5955(99)00081-7.
- Miller, C., P. Abbas, J. Rubinstein, B. Robinson, A. Matsuoka, and G. Woodworth. 1998. “Electrically Evoked Compound Action Potentials of guinea Pig and Cat: responses to Monopolar, Monophasic Stimulation.” Hearing Research 119: 142–154. doi:https://doi.org/10.1016/S0378-5955(98)00046-X.
- R Core Team 2018., "R: A Language and Environment for Statistical Computing," Vienna,
- Ramekers, D., H. Versnel, S. B. Strahl, E. M. Smeets, S. F. L. Klis, and W. Grolman. 2014. “Auditory-Nerve Responses to Varied Inter-Phase Gap and Phase Duration of the Electric Pulse Stimulus as Predictors for Neuronal Degeneration.” Journal of the Association for Research in Otolaryngology 15 (1): 187–202. doi:https://doi.org/10.1007/s10162-013-0440-x.
- Roche, J. P., and M. R. Hansen. 2015. “On the Horizon: Cochlear Implant Technology.” Otolaryngology Clinics of North America 48 (6): 1097–1116. doi:https://doi.org/10.1016/j.otc.2015.07.009.
- RStudio, 2018. "RStudio - Open source and enterprise-ready professional software for R," RStudio, Inc., [Online]. Available: http://www.rstudio.com/. [Accessed 20 04 2018].
- Schvartz-Leyzac, K. C., and B. E. Pfingst. 2016. “Across-Site Patterns of Electrically Evoked Compound Action Potential Amplitude-Growth Functions in Multichannel Cochlear Implant Recipients and the Effects of the Interphase Gap.” Hearing Research 341: 50–65. doi:https://doi.org/10.1016/j.heares.2016.08.002
- Souliere, J. C. R., S. M. Quigley, and A. W. Langman. 1994. “Cochlear Implants in Children.” Otolaryngologic Clinics of North America 27 (3): 533–556. doi:https://doi.org/10.1016/S0030-6665(20)30668-X.
- Strahl, S., A. Dierker, P. Spitzer, and K. Schwarz. 2018. “AutoART – a System for Automatic Determination of eCAP Thresholds.” in 21. Jahrestagung Der Deutschen Gesellschaft Für Audiologie. https://www.dga-ev.com/fileadmin/dga2018/site/data/final/0040.pdf
- Vaerenberg, B., C. Smits, G. De Ceulaer, E. Zir, S. Harman, N. Jaspers, Y. Tam, et al. 2014. “Cochlear Implant Programming: A Global Survey on the State of the Art.” The Scientific World Journal 2014: 1–12. doi:https://doi.org/10.1155/2014/501738.
- van de Heyning, P., S. L. Arauz, M. Atlas, W.-D. Baumgartner, M. Caversaccio, R. Chester-Browne, P. Estienne, et al. 2016. “Electrically Evoked Compound Action Potentials Are Different Depending on the Site of Cochlear Stimulation.” Cochlear Implants International 17 (6): 251–262. 11 doi:https://doi.org/10.1080/14670100.2016.1240427.
- Vos, J. J., J. D. Biesheuvel, J. J. Briaire, P. S. Boot, M. J. Gendt, O. M. Dekkers, M. Fiocco, and J. H. M. Frijns. 2018. “Use of Electrically Evoked Compound Action Potentials for Cochlear Implant Fitting: A Systematic Review.” Ear and Hearing 39 (3): 401–411. doi:https://doi.org/10.1097/AUD.0000000000000495.