
Abstract
Objective
We investigated whether contrasts between situations of good and difficult listening experiences could be identified in objective hearing aid (HA) data, with the aim to use these insights for personalisation of hearing care.
Design
The participants were asked to fill out an ecological momentary assessment (EMA) report every time they encountered a good or difficult listening experience for a period of two weeks. During EMA reporting, the participants described their listening environment and why it was difficult while objective HA data describing the sound environment, activated HA features and gain were logged.
Study sample
Sixteen experienced HA users completed the study.
Results
The group level objective HA data indicated that participants experienced difficulties in typical speech in noise environments. Data from 14/16 participants showed individual contrasts that were not seen on the group level, indicating that hearing challenges do not manifest themselves the same across persons.
Conclusions
The objective data from real-life experiences add to our understanding of the difficulty of the situation. The fact that data between individuals varied so much emphasises the importance of considering each person as an individual when treating their hearing loss.
Introduction
According to the World Health Organisation, the prevalence of hearing loss in adults is 15%. However, recent estimates suggest that only 17% of those who could benefit from a hearing aid (HA) actually use one (WHO 2020). Some of the key reasons for insufficient HA uptake are poor fit and lack of benefit from HA (McCormack and Fortnum Citation2013). This is likely because the standard HA fitting procedure is based merely on the individual’s audiogram followed by several fine-tuning attempts (Dillon Citation2012) – a procedure which comes with the caveat that the prescription based on the audiogram is “one-size-fits-all”. Yet, as moments of hearing struggles manifest themselves differently for different people with hearing loss, the predefined prescriptions are not always optimal for each user, and different people may have vastly different experiences and expectations of a HA. Therefore, the HA fitting should take into account the individual’s lifestyle and hearing challenges that are specific for that individual. However, it can be difficult for the user to formulate their hearing needs and the descriptions given are often vague recollections of past experiences (Høydal, et al. Citation2020; Johansen et al. Citation2017). This often leaves the hearing care professional to guess the right thing to do. The wrong decision could end up with a frustrated user leaving the HA in a drawer and not getting the necessary help.
Today’s HAs hold substantial personalisation potential, with the ability to log information about the environment and adaptive HA features. The sophistication of HAs together with Bluetooth connectivity, smartphone and smartwatch technologies, make it possible to access these data at any given moment. HA logs are already being utilised to gain insight into HA usage time, need for special programs or adjusting the gain based on volume control (Gaffney Citation2008; Kuvadia and Camacho Citation2017) – all based on the overall behavioural patterns of the user. Moreover, there are ongoing studies looking into use of objective HA data to understand the individual’s hearing journey in order to tailor hearing care to their needs (Pontoppidan and Christensen Citation2019). Pontoppidan and colleagues (Pontoppidan, et al. Citation2018) propose that these type of time-stamped log data – where the user’s volume and program change patterns are observed – can be used to understand in what situations the user prefers certain programs, and which should be the default program. Although these data provide valuable insights into the users’ auditory reality, knowledge on what happens in the HA during specific subjectively defined moments of both hearing difficulty and success is lacking. For hearing care purposes, it would be beneficial to collect HA data – which could span everything from sound level, environment classification and gain, to noise reduction algorithms and microphone directionality – during these moments. An example could be the advanced adaptive features of modern HAs which are rarely taken into consideration during fitting, and which, without appropriate control, could interfere with the intended effect (Korzepa, et al. Citation2018). The adaptive features modify the gain depending on the sound environment, so when a user complains that it is, for example, too loud in certain situations – it could be that this user needs an adjustment in how different adaptive features are activated and not an overall gain reduction.
Contrasts in HA data between good and difficult situations could give an understanding of why some experiences are more difficult than others. Moreover, these data have the potential to give insight into how HA settings could be modified to address the hearing difficulties that the user experiences, while not compromising experiences which are already good.
Ecological Momentary Assessment (EMA) is a questionnaire method that can facilitate collection of HA data during moments of good and difficult hearing experiences. EMA involves repeated assessments of a person’s everyday experiences and has been used widely in audiology research to understand auditory dynamics, demands and HA outcomes (Holube, von Gablenz, and Bitzer Citation2020; Glista et al. Citation2020). The main advantages of the EMA method are that it overcomes the challenges with memory bias associated with retrospective reporting and provides context sensitive information based on real-life events. Importantly, recent technological advances allow for simultaneous collection of subjective EMA reports with objective HA data via mobile applications (Schinkel-Bielefeld et al. Citation2020; Jensen et al. Citation2019c).
We hypothesised that, by logging HA data every time the user reports a difficult or good listening experience, we could identify actionable contrasts between the two types of situations and that the individual contrasts would not always be seen on the group level. Hence, the participants were asked to report – via an app – every time they encountered a good or difficult listening experience over a period of two weeks. During the reporting, they provided their subjective description of the experience together with time-stamped objective HA data during that moment. The aims of this study were to (1) investigate whether contrasts between good and difficult listening experiences in HA data can be identified on group and individual levels and (2) assess whether the contrasts on individual level deviate from the group level – stressing the need for personalisation and going away from “one-size-fits-all” solutions.
Methods
The study was conducted at the laboratories in WSA HQ, Lynge, Denmark. Ethical clearance for conducting the study was obtained from the Research Ethics Committee of the Capital Region of Denmark (case no. H-18056647).
Participants
Twenty experienced HA users were enrolled in the study (12 males and 8 females) with an average age of 69 (SD: 6 years, range: 55–77 years) and 12 years of experience with hearing aids (SD: 10 years, range: 2–40 years). The inclusion criteria were: 18–80 years of age, Widex bilateral HA user, mild to severe hearing loss (acceptable four-frequency PTA range within 26–80 dB in the better ear), smartphone user, and must be able to travel to the lab during the trial period. The participants were recruited through an internal database of participants (Noah 4.9.1) via phone or e-mail. The participants were informed orally and in writing. Before the trial commenced, the participants gave their informed consent in writing.
Experimental design
This was a longitudinal study where the participants were asked to report on listening experiences that they found difficult or exceptionally good over a period of two weeks. The participants who fit the inclusion criteria came to the lab for the first visit where the consent was obtained. This was followed by measuring the audiogram, conducting start-of-trial interview, and fitting and fine-tuning of the HAs (as described in the next sections). The participants were then instructed about the field task as follows: “Please complete a questionnaire via the app on the phone when you are either experiencing an exceptionally good listening experience, or in situations where you are experiencing difficulties with your hearing. We are interested in your overall listening experience, and not interested in whether your hearing aids work well or poorly in the situation. Although we ask you to report both from good listening experiences, and from situations you find difficult, this does not mean that you must report everything. Most of the time, you will probably find yourself in situations where your hearing is just okay. Do not report from these situations. We are interested in all types of difficulties, both those where you cannot understand what people are saying and those where you cannot hear the music properly, or the situations where the noise becomes tiring, as well as all the other types we have not mentioned here.” These instructions were printed out for them to take home and refer to if needed. If it was unclear what constituted good or difficult situations, these were the examples given: difficult listening experiences constitute subjectively perceived hearing challenges (i.e. difficulty in understanding speech, annoyance with certain sounds or other types of situations where your hearing is noticeably difficult), whereas especially good listening experiences constitute situations where the hearing experience is noticeably good (i.e. great communication at a party, hearing the sounds of crickets in the forest, or other types of situations where your hearing is noticeably good).
Then, the equipment was handed out, the participant was instructed how to use it and troubleshoot in case of connection issues. Afterwards, the participants went through the questionnaire a few times to get accustomed to the equipment and EMA reporting. The participants were then sent home and the field trial commenced. In the cases where the participant was in a situation they would like to report, but it was challenging, they were allowed to start the report and come back to the questionnaire when it was more convenient within the next ∼30–60 minutes. This was done in order to assure the objective HA data capture of the critical moment.
It should be noted that, although an EMA-app was used as a tool to report good and difficult experiences, this is not an EMA study in the context of traditional EMA. The purpose was not to understand everyday dynamics and hence data were not sampled throughout the day several times per day. The participants were expected to report when they experienced a good or a difficult listening situation – if they did not experience such a situation during the day, it was desired that they do not report just for the sake of reporting.
During the two-week home trial, the responsible audiologist followed up with the participant at least twice over the phone, to find out how the participant was doing and whether any challenges took place. In the rare case that the participant could not be reached via the phone, e-mail communication took place. After the two-week field trial, the participant came back for the second visit, where the exit interview was conducted, and the equipment was collected.
Fitting and fine-tuning
An experienced audiologist performed the fittings. Widex Evoke 440 FS receiver-in-canal (RIC) HAs were fitted to the participant’s hearing loss using Compass GPS (v. 3.4.4062) according to the fitting recommendations (Schmidt Citation2018). Receivers and ear tips were selected based on the fitting software’s recommendation. Fine-tuning, if needed, was done based on the audiologist’s clinical experience, but the overall fine-tuning of gain was not permitted to exceed ± 6 dB and fine-tuning in specific frequency bands was not permitted to exceed ± 3 dB. These limits are within the range of acceptable deviation from fit-to-target (British Society of Audiology Citation2018) and were set to allow some finetuning, but not deviate too much from what’s prescribed. The feature settings were default and no special programs were added. Finally, a MATLAB script was used to modify the HA by enabling the expanded logging functionality (termed Eventlog throughout this article).
The EMA app setup
The EMA procedure was administered via an internally developed EMA app (Jensen et al. Citation2019c). The app was installed on iPhone 7 smartphones which were given to participants to be used during the trial. When the app was initiated by the participant, the Eventlog started logging the HA parameters and the participant was asked to press on a happy or sad smiley indicating whether it was a good or a difficult listening experience that prompted them to start the questionnaire. Then, they were prompted to describe their listening experience in their own words and if it was a difficult experience, why so. The descriptions are given by typing them in via a text box in the app. While the participant was answering the questionnaire, the Eventlog was recording one sample every two seconds for a maximum of 70 samples. If the participant took longer than 140 seconds to answer the questionnaire, only the first 140 seconds of the Eventlog were saved. Once the questionnaire was completed, the report together with the time-stamped Eventlog data were sent to a secure cloud server. The flow of the app is depicted in Supplemental Figure 1. In order for the app to communicate with the HA, a wireless connection was established using a Widex ProLink device that the participants wore around the neck during reporting. The ProLink allowed communication with the smartphone via Bluetooth, while communication with the HA used a proprietary digital radio-frequency transmission technology (WidexLink).
Below is the description of the logged HA parameters. The parameters which were logged for this study constitute a small subset of the HA features and environmental estimators operating in the HA.
Sound level in 15 frequency bands. The centre frequencies are: 125 Hz, 250 Hz, 350 Hz, 500 Hz, 630 Hz, 800 Hz, 1000 Hz, 1250 Hz, 1600 Hz, 2000 Hz, 2500 Hz, 3200 Hz, 4000 Hz, 6000 Hz, 8000 Hz.
Speech detection in the input signal (binary variable – yes or no).
Transient activity in the input signal (binary variable – yes or no).
The detected sound class corresponding to those available in the test HAs (Kuk et al. Citation2015). The HAs in this study have 12 sound classes: Quiet, Quiet with speech, Urban, Urban with speech, Transport, Transport with speech, Music (classic), Party, Party with speech, Social, Social with speech, Music (rock/pop/folk).
Insertion gain in 15 frequency bands.
High level noise reduction (HLNR) activity (binary variable – yes or no).
Low level noise reduction (LLNR) activity (binary variable – yes or no).
Wind noise reduction (WNR) activity (binary variable – yes or no).
Visit 1 & 2 interviews
Structured start of trial and exit interviews were conducted to understand the participants’ experiences with hearing in general. The relevant questions – presented below – will be discussed. With the participants’ permission, the interviews were audio recorded.
Start Interview Questions:
In which situations do you find it difficult to hear?
Are there any situations you avoid due to your hearing loss?
Exit Interview Questions:
Can you name some situations where you had difficulties hearing?
Do you experience the same difficulties with your own hearing aids as with the test hearing aids?
Were there situations that you avoided due to your hearing loss during the trial?
Can you name some situations where you had good hearing experiences?
Statistical analysis
The sample size of 15–20 is in line with previous research using similar methodology for real-life explorative studies (Holube, von Gablenz, and Bitzer Citation2020). Moreover, this sample size is sufficient to give an indication of group trends in the sample, as well as, to show that important data from some individuals are not represented in this average.
The primary endpoint of this study was to evaluate whether contrasts in objective HA data between good and difficult listening experiences could be identified on group and individual levels. The secondary endpoint was to evaluate whether the momentary subjective reports provided better descriptions of difficulty in comparison to retrospective recollections at the exit interview. Continuous data are presented as mean ± standard error, unless otherwise noted. For objective EMA data which included multiple reports per participant, the standard error of the mean was computed based on the combined mean and standard deviation (Higgins, et al. Citation2019).
The continuous HA data (i.e. sound level and gain) on group level were analysed using mixed-effects linear regression with random effect for participant. These data were averaged across the total samples (up to 70) per individual report for each participant for the analysis. For sound level, Difficulty (binary variable indicating a sad or happy smiley) was the explanatory variable, whereas for gain, the three-way interaction between Difficulty, Sound Level and Frequency was of interest. In order to reduce the dimensionality of the gain data for the statistical analysis, the dimension of frequencies was reduced into low (bands 1–5), mid (bands 6–12), and high (bands 13–15). The continuous sound level variable was furthermore categorised into soft (<50 dB SPL), normal (50–70dB SPL) and loud (>70dB SPL) sound levels.
Categorical objective HA data (i.e. speech detection, transient detection, adaptive directionality, HLNR, LLNR, WNR and sound class activity) on a group level were analysed using multilevel mixed-effects ordered logistic regression with random effect for participant, and Difficulty as the explanatory variable. The HA activity detection data (speech detection, transient detection, adaptive directionality, HLNR, LLNR, WNR) were first calculated as percent of detected activity relative to the total number of samples (up to 70) per individual report for each participant. Then, these variables were converted to categorical variables where 0 = 0% occurrence per report (no activity), 1 = <50% occurrence per report (some activity) and 2 = ≥50% occurrence per report (a lot of activity). This was done such that the highly skewed percentage data could be analysed using multilevel mixed-effects logistic regression.
A total of 15 group level statistical tests were conducted. No adjustments for multiple comparisons were done; the Althouse guidelines were followed instead (Althouse Citation2016).
Data on individual level were analysed descriptively – by looking at the overall contrasts between good and difficult listening experiences – for each of the objective parameters. Difference of 20% between two types of experiences for each logged HA parameter for each participant was considered substantial – this number is large enough to indicate a clear difference and conservative enough to exclude smaller differences which could be up for discussion. Qualitative data were evaluated by reading through the participants’ descriptions of reported moments and grouping the similar reports into individual descriptors for each participant. The number of reports attributed to each descriptor are reported.
Quantitative descriptive analyses were done in MATLAB (version R2019b, MathWorks Inc., Natick, Ma, USA) and significance testing was performed in Stata (v. 15, StataCorp, College Station, TX, USA). For all statistical tests, P < 0.05 was considered significant.
Results
Sixteen out of twenty participants were included in the final analysis (10 males and 6 females) with an average age of 69 (SD: 6 years, range: 55–77 years) and 13 years of experience with HAs (SD: 9 years, range: 2–40 years). Four of the participants were excluded because they either filled in the reports retrospectively or whenever a new moment presented itself, regardless of whether it was especially good or difficult – as made evident at the exit interview. The retrospective reports could not be used because the momentary time-stamped objective data aligned with the report were not representative of the experienced good or difficult situation. That participants could misunderstand the instruction to this degree was an unforeseen problem, and the exclusion criteria was thus, updated after the testing period.
Start and exit interviews
At the initial interview, the primary type of situation that was reported as difficult was “large gatherings”, recounted by 14 out of 16 participants. Five participants reported that they struggle with understanding children/high-pitched voices and when traffic noise is present. Three participants experience difficulties when watching TV, in wind noise and due to poor acoustics. Two participants expressed that they encounter difficulties in the cinema, and single cases included difficulties when people are talking from a distance and during telephone conversations.
One participant reported that he avoids phone conversations even with streaming devices – especially with people he does not know. The remaining fifteen participants did not report avoiding certain situations due to their hearing loss.
At the exit interview, the most frequently recounted hearing difficulty remained in large gatherings (see Supplemental Table 1a). Seven participants reported that they experienced the same hearing difficulties with their own HAs as with the test HAs, six participants reported that they experienced more difficulties with their own HAs, whereas three participants reported that they did not experience the same hearing difficulties with their own HAs.
When asked if any situations were avoided during the trial period, one participant reported that he did not go to a reception and a Christmas lunch because these situations would have been too demanding. Another participant reported that if there were situations with many people and a lot of background noise, he would ask the person he wanted to speak to if they could go outside and talk because it was too difficult in the noisy environment.
Remarkably, most of the participants could recount a number of situations where they were pleased with their hearing during the trial period (see Supplemental Table 1b) and these situations often overlapped with difficult ones.
EMA reports
In total, 410 EMA reports were submitted. Questionnaires that took longer than 60 minutes to complete were removed from the analysis lest the subjective response was retrospective and consequently not aligned with the objective data. This resulted in 396 reports included in the final analysis (301 good and 95 difficult), with an average of 27 total reports per participant (SD: 17 reports) − 97% of reports were completed within 15 minutes and 81% within 5 minutes.
Contrasts on the group level
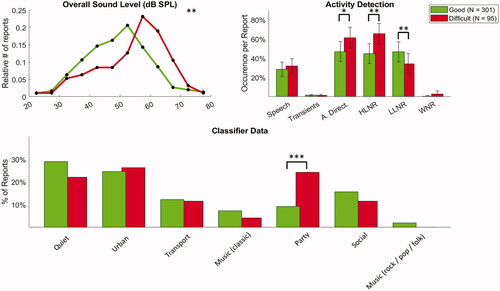
For group level analysis, the 12 sound classes were reduced to 7: Quiet (Quiet + Quiet with speech), Urban (Urban + Urban with speech), Transport (Transport + Transport with speech), Music (classic), Party (Party + Party with Speech), Social (Social + Social with speech), and Music (rock/pop/folk). The objective data showed that sound levels were higher, adaptive directionality and high level noise reduction were more active, low-level noise reduction was less active and the Party sound class was detected more often in situations reported as difficult (all p < 0.05) – see Supplemental Table 2 for detailed statistics and . There were no significant contrasts in the gain matrix.
Figure 1. Contrasts in objective HA data on a group level. In the top left figure, it can be seen that there are relatively more good reports in soft to normal sound levels, whereas there are relatively more difficult reports in normal to loud sound levels. In the bottom part of the figure, the y-axis indicates the percentage of total reports. A. Direct.: adaptive directionality; HLNR: high level noise reduction; LLNR: low level noise reduction; WNR: wind noise reduction. *p < 0.05; **p < 0.01; ***p < 0.001.
Contrasts on individual level
The overview of distribution of individual reports is shown in . The number of reports varied between individuals, and most of the participants mainly reported good listening experiences. More than half of the participants’ exit interview recollections of difficult situations did not fully align with EMA reports – i.e. at least some of the situations described in EMA reports were not reflected at exit interviews or at least not in as much detail. This suggests that additional, more concrete insights are gained through momentary reports of difficulties, and that information could be lost if relying on retrospective reports of experiences. shows individual contrasts in the sound environment, HA adaptive features and sound classes. It can be seen that 13 out of 16 participants showed contrasts – between good and difficult listening experiences – in objective HA data which were not detected on the group level. Moreover, shows that contrasts in the gain matrix could be seen for nine participants and that in most cases these contrasts were confined to specific HA sound classes. In other words, they were environment specific. This finding is especially noteworthy as contrasts in the gain matrix were not observed on the group level. However, these data provide valuable insights into why a certain listening experience is good in some situations, while difficult in others. For example, participant 7 received more amplification for normal sound levels in low-mid frequency range in difficult in comparison to good listening experiences. This increase in gain was confined to the Urban sound class. The Urban sound class is flagged in situations with very varied and diverse sounds, such as supermarket, city area or a noisy workplace. Hence, one explanation for the experienced difficulty could be too much amplification in the low-mid frequency range for normal sound levels in these types of environments.
Table 1. Individual data depicting the number of reports per person and subjective descriptions of difficulties.
Table 2. Objective HA data contrasts for individual participants.
Table 3. Gain contrasts between difficult and good listening experiences in specific frequency ranges.
Altogether, data from 14 out of 16 participants exhibited contrasts which were not seen on the group level.
Discussion
In this study, we set out to investigate whether meaningful contrasts between good and difficult listening experiences could be identified in objective HA data, and whether the contrasts seen on an individual level deviated from the group level. The group level data indicate, that on average, the participants experienced difficulties in louder and noisy environments. These types of situations are known to be difficult for HA users and in this study where we specifically asked our participants to report in difficult situations, we were able to capture these critical moments which have been under-represented in previous EMA studies based on triggered sampling (Schinkel-Bielefeld et al. Citation2020). On an individual level, contrasts that deviated from the group level were observed in 14 out of 16 participants – indicating the importance of looking at each person as an individual when treating their hearing loss.
Hearing aids and personalization
The usual HA fitting procedure involves fitting of the HA according to the individual’s gain prescription followed by fine-tuning either immediately after the fitting or following real-life listening experiences. The user may come back to the clinic after the initial fitting procedure with complaints of poor sound quality and speech understanding in specific situations, loudness level, own voice perception, etc. To transfer these verbal descriptions into meaningful HA adjustments is often difficult for the hearing care professional (Jenstad, Van Tasell, and Ewert Citation2003) – especially considering the complexity of today’s HAs where a multitude of options to optimise one’s hearing experience exist. Moreover, it is not always easy for the person with hearing loss to accurately recall and describe the experiences of difficulty over the past weeks or months (Jenstad, Van Tasell, and Ewert Citation2003). This is confirmed in the current study, where after only two weeks of paying attention to difficult listening experiences, most of the participants could not completely recollect them at the exit interview. When the descriptions were so ambiguous in this study, one can only imagine how imprecise they could be after several weeks of not necessarily systematically focusing on difficult situations.
Today’s HAs allow for logging of the objective information about the environment and activated HA features in specific situations that the user finds troublesome. These insights have the potential to bridge the gap in communication between the user and hearing care professional, as well as to personalise the HAs to individual’s needs. Despite such big personalisation potential, the objective HA insights are rarely used for improvement of hearing experiences. In the current study, there was an overlap of subjectively described good and difficult experiences. The objective HA data during such moments could provide insight into why the same situation is good at some time points and difficult at others. These results produce contrasts that have the potential to be used for optimisation of HAs to address the difficult situations, while not compromising the situations which are already good. The contrasts varied between participants, emphasising the need for tailored hearing care. Different amplification preferences between users – in the same sound scenario and listening intent – have been observed before (Jensen et al. Citation2019a). The authors interpreted this as evidence that the individual user needs cannot always be addressed with the gain prescribed by one given fitting rationale. Acquiring momentary data about good and difficult listening experiences would give the insight needed to tailor the hearing care to that individual and improve the hearing by finetuning the HA features that need to be optimised specifically for that user.
This could be particularly useful for first-time users who do not know what to expect from a HA or may not know how to formulate the struggles they experience. The first few weeks following the initial HA fitting is a critical period during which fixable issues can become problems that lead to HA rejection. After the user is fitted with HAs, they could be sent home with an app through which they report their difficulties and good listening experiences. The objective HA data representing these moments could then be used to drive the dialogue between the user and clinician in order to find a solution that works. As one of our participants eloquently put it at the exit interview: “I thought this is really good – especially when one gets hearing aids for the first time and doesn’t know what to expect. It can be difficult to define what the problem is. But when one has an app where they can report moments of difficulties, this can help the audiologist understand what the problem is so they can optimise the hearing aid and have a conversation based on my reports of difficult and good listening experiences. It is also great that I can report good situations because I wouldn’t want the audiologist to do anything about the situations which are already good for me.”
The challenge in today’s hearing care is not only to comprehend the problem that the user faces, but also to identify, once the problem is clear, what solution will yield the highest benefit. In cases where actionable contrasts in objective data are clear, a recommendation for fine tuning in the fitting software could be made, such as an adjustment to gain, feature settings, or sound classes. The hearing care professional could then decide whether to apply the changes to the fitting. For example, participant 13 received less gain in mid-frequency range for normal sound levels in difficult in comparison to good experiences. This contrast was confined to the Urban sound class (i.e. varied and diverse sounds, such as supermarket, city area or a noisy workplace). In addition, the adaptive directionality and high-level noise reduction were more active. Her subjective descriptions indicate difficulties in separating words and understanding sounds from different directions. Hence, this participant could likely benefit from a decrease in the adaptive directionality to that of good experiences for the Urban sound class.
In cases where objective contrasts are not clear or there is not enough objective data to drive a clinical decision, these data could be presented together with subjective descriptions of difficulties for empowered data-driven dialogue between user and hearing care professional. Although it was not the primary aim of the study, we observed that the momentary subjective inputs complemented the objective data well and gave more concrete descriptions of difficult moments than the ones received at exit interviews. It has been previously reported that hearing difficulties described at a clinic can be imprecise, and the given advice is to ask the patient to provide more details (Jenstad, Van Tasell, and Ewert Citation2003). Such details can be tricky to remember, yet easier to describe in the moment the situation occurs, provided clear instruction on app usage and patient’s motivation are in place. While it may not be immediately clear how to adjust the HA from subjective inputs, they can serve as a counselling tool and to understand whether a special HA program could add benefit. For example, participant 16 complained that the noise in her ears was stressing and too much. However, she reported more good listening experiences than difficult ones and there were no contrasts in the gain matrix which indicated where adjustments could be made. Based on her subjective descriptions, she likely could benefit from a Comfort program (Jensen et al. Citation2019b) – which dampens the sound levels to more comfortable – to be used in those specific difficult situations.
Study considerations
In this study, we showed that contrasts in the objective HA data between good and difficult listening experiences can be seen and these contrasts existed for all the participants who reported some situations in each group. However, the appropriate number of listening experiences that need to be reported, before the data are clinically actionable is up for debate and should be investigated further.
It is noteworthy that majority of participants reported mostly good listening experiences. One reason could be that only experienced HA users, who may have developed coping strategies, were included. The choice of experienced users was made for practical reasons: to not have the variable of experience in the limited sample size and because first-time users for a study like this are difficult to recruit. As the main goal was to see whether actionable contrasts in objective HA data could be identified at all, we found it sufficient to include only experienced users. Another reason for mostly good reports could be a better fit or upgrade of HAs. We included only Widex HA users such that the change in HA sound would not affect the individual assessment of the listening experience. Nonetheless, at the exit interview, six participants reported that they experienced more difficulties with their own HAs in comparison to test HAs. A third reason could be that in the presence of a challenging situation, the user likely would not be keen on taking out the smartphone, putting the ProLink around the neck, and then filling in the reports. A number of reports are possibly not submitted due to inconvenience of all the equipment that needed to work together. For a solution like this to work in the real world, a more accessible setup should be implemented, i.e. a standalone app that can communicate with HAs or a Smartwatch interface. One of the participants stated at the exit interview: “I’m supposed to report troublesome situations – that could be noise, another one is difficulty in understanding people. I’m overreporting noise because the other problems when I find it hard to understand people, it’s often people I don’t know, new people in stressing situations … In really demanding situations when I would really like to stop time and report what is the problem here and then get back to this guy, it is not possible. One thing that would be possible is, if the only thing required of me is to say to this guy ‘sorry I’m hard of hearing I have to report’, press the button ‘start’ then it will record what’s going on and then after the situation, within maybe the next 5 minutes, I do the reporting.” A fourth, and likely, reason could be that people generally spend most time in easy situations (Schinkel-Bielefeld et al. Citation2020; Jensen et al. Citation2019c) and hence there is a substantially higher number of these types of situations in comparison to difficult ones.
Finally, we’ve recruited our participants from an in-house participant database, and it must be acknowledged that they may not be representative of an average HA user. The experienced participants are likely better at qualitatively describing their listening experiences and could be more satisfied than an average user. We demonstrated that we could observe contrasts between good and difficult listening experiences in objective HA data, and this is transferable to other types of users if they provide enough reports. However, further studies should be conducted to understand how naive users, and especially first-time HA users, would interact with this concept, and if individual contrasts could also be observed in these participants.
Conclusion
Contrasts between good and difficult listening experiences were identified in objective HA data on group and individual levels. Data from most participants showed contrasts that were not seen on the group level and these contrasts varied – stressing the importance of considering each person as an individual when treating their hearing loss. The objective data from real-life experiences add to our understanding of the difficulty of the situation. The insights have the potential to provide a powerful counselling tool to drive a data-driven dialogue between the hearing care professional and the user. Looking ahead, these insights could be used to personalise the HAs by adjusting the overall gain, compression ratios, activity of noise reduction algorithms, or adding special programs to address the user’s listening intent.
Interested readers can access the supplementary material at http://tandfonline.com/doi/suppl
TIJA-2020-12-0621-File005.docx
Download MS Word (61.5 KB)Acknowledgements
The authors would like to thank Christina Johansson Folgeroe for her contribution to the protocol discussions and initial help with handling of participants. Furthermore, we would like to thank Niels Soegaard Jensen and Laura Winther Balling for their valuable input on the manuscript.
Disclosure statement
No potential conflict of interest was reported by the author(s). All authors are employees of WS Audiology
Correction Statement
This article has been republished with minor changes. These changes do not impact the academic content of the article.
References
- Althouse, A. D. 2016. “Adjust for Multiple Comparisons? It’s Not That Simple.” The Annals of Thoracic Surgery 101 (5): 1644–1645. doi:https://doi.org/10.1016/j.athoracsur.2015.11.024.
- British Society of Audiology. 2018. “Guidance on the verification of hearing devices using probe microphone measurements.” Available at: https://www.thebsa.org.uk/wp-content/uploads/2018/05/REMS-2018.pdf-
- Dillon, H. 2012. Hearing Aids. 2nd ed. New York: Thieme.
- Gaffney, P. 2008. “Reported Hearing Aid Use versus Datalogging in a VA Population.” Hearing Review 6 (42): 46–47.
- Glista, D., R. O’Hagan, M. Van Eeckhoutte, Y. Lai, and S. Scollie. 2020. “The Use of Ecological Momentary Assessment to Evaluate Real-World Aided Outcomes with Children.” International Journal of Audiology 60 (sup1): S68–S78. doi:https://doi.org/10.1080/14992027.2021.1881629.
- Higgins J. P. T, J. Thomas, J. Chandler, M. Cumpston, T. Li, M. J. Page, and V. A. Welch. editors. 2019. Cochrane Handbook for Systematic Reviews of Interventions Version 6.0. Cochrane. Available at: www.training.cochrane.org/handbook.
- Holube, I., P. von Gablenz, and J. Bitzer. 2020. “Ecological Momentary Assessment in Hearing Research: Current State, Challenges, and Future Directions.” Ear & Hearing 41 (Supplement 1): 79S–790. doi:https://doi.org/10.1097/AUD.0000000000000934.
- Høydal, H., R. L. Fischer, V. Wolf, E. Branda, M. Aubreville 2020. “Empowering the Wearer: AI-Based Signia Assistant Allows Individualized Hearing Care.” Hearing Review 27 (7): 22–26.
- Jensen, N. S., O. Hau, J. B. B. Nielsen, T. B. Nielsen, S. V. Legarth. 2019a. “Perceptual Effects of adjusting hearing-Aid Gain by Means of a Machine-Learning Approach Based on Individual User Preference.” Trends in Hearing 23: 1–23.
- Jensen, N. S., A. K. Pedersen, E. B. Petersen, J. Theill. 2019b. “When One Size Does Not Fit All: Special Hearing Solutions for Special Occasions.” Hearing Review 26 (8): 22–26.
- Jensen, N. S., O. Hau, D. Lelic, P. Herrlin, F. Wolters, K. Smeds. 2019c. “Evaluation of Auditory Reality and Hearing Aids Using an Ecological Momentary Assessment (EMA) Approach.” Proceedings of the 23rd International Congress on Acoustics in Aachen, Germany.
- Jenstad, L. M., D. J. Van Tasell, and C. Ewert. 2003. “Hearing Aid Troubleshooting Based on Patients’ Descriptions.” Journal of the American Academy of Audiology 14 (07): 347–360. doi:https://doi.org/10.1055/s-0040-1715754.
- Johansen, B., M. Petersen, M. Korzepa, J. Larsen, N. Pontoppidan, and J. Larsen. 2017. “Personalizing the Fitting of Hearing Aids by Learning Contextual Preferences from Internet of Things Data.” Computers 7 (1): 1–21. doi:https://doi.org/10.3390/computers7010001.
- Korzepa, M. J., B. Johansen, M. K. Petersen, J. Larsen, J. E. Larsen, N. H. Pontoppidan. 2018. “Modeling User Intents as Context in Smartphone Connected Hearing Aids.” In 26th Conference on User Modeling, Adaptation and Personalization Adjunct. Singapore: ACM.
- Kuk, F, E. Schmidt, A. H. Jessen, M. Sonne. 2015. “New Technology for Effortless Hearing: A “Unique” Perspective.” Hearing Review 22 (11): 32–36.
- Kuvadia, S., and L. F. Camacho. 2017. Data Logging - Hearing Aid Behavior in the Real World. AudiologyOnline, Article 20258. Retrieved from www.audiologyonline.com
- McCormack, A., and H. Fortnum. 2013. “Why Do People Fitted with Hearing Aids Not Wear Them?” International Journal of Audiology 52 (5): 360–368. doi:https://doi.org/10.3109/14992027.2013.769066.
- Pontoppidan, N. H., X. Li, L. Bramsløw, B. Johansen, C. Nielsen, A. Hafez, M. K. Petersen. 2018. “Data-Driven Hearing Care with Time-Stamped Data-Logging.” Proceedings of the International Symposium on Auditory and Audiological Research, p. 6.
- Pontoppidan, N. H., and J. H. Christensen. 2019. “User Behaviour with EVOTION Hearing Aids.” Proceedings of the 23rd International Congress on Acoustics in Aachen, Germany,
- Schinkel-Bielefeld, N., P. Kunz, A. Zutz, and B. Buder. 2020. “Evaluation of Hearing Aids in Everyday Life Using Ecological Momentary Assessment: What Situations Are We Missing?” American Journal of Audiology 29 (3S): 591–609. doi:https://doi.org/10.1044/2020_AJA-19-00075.
- Schmidt, E. 2018. The Widex Fitting Rationale for Evoke. Vol. 38. WidexPress. Available at: http://webfiles.widex.com/WebFiles/9%20502%204866%20001%2001.pdf
- World Health Organization. 2020. Deafness and Hearing Loss. Available at: https://www.who.int/health-topics/hearing-loss#tab=tab_1