
Abstract
Objectives
To examine the effects of web-based SUpport PRogram (SUPR) for communication partners (CPs) of persons with hearing loss (PHLs) in a HA dispensing setting.
Design
Cluster randomised controlled trial (cRCT) with two arms (SUPR: Booklet, online videos; care as usual: no support) plus process evaluation. Measurements: baseline, and immediately-, six, and 12 months post-intervention. Outcomes: Significant Other Scale for Hearing Disability (SOS-HEAR), International Outcome Inventory for HAs/Alternative Interventions for Significant Others (IOI-HA/AI-SO). Process evaluation: dose-received, satisfaction, and benefit.
Study sample
The cRCT included 73 (SUPR) and 57 (care as usual) CPs. In the process evaluation study, 41 CPs (SUPR) participated.
Results
There were no significant effects of SUPR for third-party disability (SOS-HEAR), the proxy report (IOI-HA-SO item “use”), and third-party disability (IOI-HA-SO items “satisfaction”, and “quality of life”). SUPR-videos were watched by 15-22% of the CPs. SUPR materials were rated as moderately beneficial and useful.
Conclusions
Low baseline disability (floor effect) and low intervention dose-received may explain the findings. Directly targeting CPs rather than via their PHLs and providing intervention materials specifically for CPs may improve their engagement and contribute to SUPR’s value supplementary to standard HA care.
Introduction
Hearing loss can negatively impact a person’s wellbeing and quality of life due to activity limitations and participation restrictions that may be experienced (Chisolm et al. Citation2007; Lin, Yen, and Liao Citation2019). People who frequently interact with a person with hearing loss (PHL) are defined as their communication partners (CPs). The CP often concerns the spouse or partner, but can also be a child, friend, or neighbour (Kamil and Lin Citation2015). CPs may experience difficulties due to their loved one’s hearing loss (Kamil and Lin Citation2015; Scarinci, Worrall, and Hickson Citation2008; Vas, Akeroyd, and Hall Citation2017). These may relate to maintaining face-to-face conversations with the PHL (Scarinci, Worrall, and Hickson Citation2008; Schulz et al. Citation2017; Stark and Hickson Citation2004) or performing everyday activities such as watching television and telephone conversations (Brooks, Hallam, and Mellor Citation2001; Scarinci, Worrall, and Hickson Citation2008; Scarinci, Worrall, and Hickson Citation2009a; Stark and Hickson Citation2004). In addition, CPs may experience decreased social interaction (Brooks, Hallam, and Mellor Citation2001; Scarinci, Worrall, and Hickson Citation2009a; Wallhagen et al. Citation2004) and relationship conflicts (Hetu, Jones, and Getty Citation1993; Scarinci, Worrall, and Hickson Citation2008; Scarinci, Worrall, and Hickson Citation2009a). CPs may also experience feelings of frustration and anxiety (Brooks, Hallam, and Mellor Citation2001; Preminger, Montano, and Tjornhoj-Thomsen Citation2015; Scarinci, Worrall, and Hickson Citation2008; Stark and Hickson Citation2004) and poor psychosocial wellbeing (Wallhagen et al. Citation2004) due to the PHLs’ hearing loss. The negative effect of hearing loss on others is referred to as ‘third-party disability’ (World Health Organization Citation2001).
Although the provision of hearing aids (HAs) has been shown to reduce negative effects of hearing loss for both the PHL and the CP, residual activity limitations and participation restrictions often remain (Brooks, Hallam, and Mellor Citation2001; Stark and Hickson Citation2004). Many PHLs possessing HAs do not use them (3–24%) or use them sub-optimally, increasing residual disability for the PHL and their CPs (Aazh et al. Citation2015; Abrams and Kihm Citation2015; Bertoli et al. Citation2009; Hartley et al. Citation2010; Kaplan-Neeman et al. Citation2012; Solheim and Hickson Citation2017). Commonly reported reasons for HA under-use to include problems in maintaining the HAs (McCormack and Fortnum Citation2013), limited social support (Hickson et al. Citation2014), and limited HA benefit (Hickson et al. Citation2014; McCormack and Fortnum Citation2013). To address the PHL’s residual disabilities, aural rehabilitation additional to HA fitting, such as educational communication programs have been recommended (Boothroyd Citation2007). These aim to support the PHL to self-manage their hearing loss and HAs better and usually provide information about the hearing condition, how to handle HAs, and how to apply communication strategies and psychosocial management behaviours (Barker et al. Citation2016). A systematic review showed that communication programs can improve PHLs’ verbal communication and HA benefit (Barker et al. Citation2016).
Including a CP in the rehabilitation process can be advantageous for the CP as it can reduce their third-party disability (Scarinci, Worrall, and Hickson Citation2012). Only a few studies evaluated the effects of communication programs on CPs. Preminger and Meeks (Citation2010) evaluated a communication program for spouses of PHLs, using a randomised controlled trial (RCT) design. PHLs in the control group participated in a traditional Audiological Rehabilitation (AR) program while their spouses received no treatment. The AR classes included lectures on hearing loss, training in communication strategies, and psychosocial exercises. PHLs in the intervention group also attended the group AR program, but their spouses additionally participated in separate AR classes covering psychosocial, communication strategy, and speech training exercises. Spouses who had followed AR classes had a better understanding of their PHLs’ experiences with hearing loss than spouses who had not (Preminger and Meeks Citation2010). However, no effects were found on any of the spouses’ other psychosocial measures. Kramer et al. (Citation2005) evaluated whether participating in a Home Education Program improved outcomes for PHLs and their CP, also using an RCT design. The program evaluated in the current study is based on Kramer et al.’s (Citation2005) effective Home Education Program. It consisted of five videotapes demonstrating how communication strategies could positively influence daily-life communication. The videos were accompanied by an instruction booklet including questions and themes for discussion. PHLs and their CPs were randomised to receiving the Home Education Program or care as usual (PHLs: HA fitting without additional support; CPs: no support). Kramer et al. (Citation2005) found that PHLs who had followed the Home Education Program showed improved quality of life and satisfaction, while a decrease was observed among those who received care as usual. They did not find any differences in outcomes between the two CP groups, possibly due to ceiling effects in their third-party disability questionnaire. At baseline, CPs reported experiencing no or minimal disability, leaving no or little room for improvement.
Recently, we developed a web-based educational SUpport PRogram (SUPR) for HA users aged 50+ and their CPs further described under Methods. SUPR is offered in a hearing aid dispensing (HAD) setting supplementary to the regular HA fitting trajectory. Aims of SUPR for the PHLs are to improve the use of communication strategies, personal adjustment to hearing loss, and HA outcomes. For CPs, its aim is to decrease third-party disability. To evaluate SUPR’s short- and long-term effects, a large-scale cluster RCT (cRCT) was performed among PHLs fitted with HAs (clients of the HAD chain) and their CPs. PHLs who received SUPR showed significantly greater self-efficacy for HA handling and HA satisfaction 12 months post-intervention, and more HA use immediately post-intervention, compared to PHLs in the control group (HA fitting only) (Meijerink et al. Citation2020). We also conducted a Process Evaluation (PE) study among PHLs in the SUPR group and identified several factors that could explain the positive effects of SUPR on HA-related outcomes. These were relatively high watching rates for the HA instruction videos, and reasonably high intervention satisfaction and benefit ratings. Other factors, such as low SUPR implementation fidelity among HA dispensers and low watching rates for the testimonial and communication strategies videos, may explain the absent effects on PHLs’ psychosocial outcomes (submitted for publication).
This paper describes the results of the cRCT for the CPs and the results of the PE that was conducted alongside the RCT among CPs of the SUPR group to gain an in-depth understanding of the cRCT findings.
The study’s aims were:
To evaluate whether the addition of SUPR to a regular HA fitting trajectory reduces CPs’ third-party disability and improves CPs’ rehabilitation outcomes.
To examine CPs’ intervention dose received (use of and engagement with the intervention materials), satisfaction and perceived benefit of SUPR.
Methods
Study design, procedures, and population
This study was conducted according to the CONSORT statement for cRCTs (Campbell et al. Citation2012). It had a two-arm cRCT design with the HAD practice as the unit of allocation. Details are described in the study protocol (Meijerink et al. Citation2017) and trial registration (ISRCTN77340339). The Dutch Institutional Review Board of the Amsterdam University Medical Centre (registered with the US Office for Human Research Protections as IRB00002991; FWA number: FWA00017598) approved the study.
The study was conducted in 70 HAD practices scattered across the Netherlands. HA dispensers (henceforth: dispensers) and their supporting staff recruited clients and their CPs between February and September 2016. Dispensers were instructed to inform the PHLs about the study and provided them an information package which included an envelope with an information letter for themselves and one with an information letter for the CP, outlining the study procedures. PHLs were encouraged to appoint a CP and hand over the CP study envelope to that person. All PHLs and CPs provided their informed consent online.
CPs were eligible to participate if their PHL had decided to purchase HAs after an HA evaluation period and participated in the cRCT study, if they were 18 years or older, and if they owned an e-mail address for the duration of the study.
Randomisation procedure
HAD practices were randomly assigned to the intervention group (offering care as usual + SUPR) or the control group (offering care as usual only). Note that we chose to randomise HAD practices rather than individual clients to minimise the risk for contamination (occurring when dispensers would accidentally provide SUPR to control clients and their CPs). As indicated by the sample size calculation for the PHLs, 70 HAD practices were needed as it was envisaged that each practice would be able to recruit at least 13 first-time and 15 experienced clients across the recruitment period. Randomisation was stratified by the location of the HAD practices, either in a rural or an urban area. An independent statistician performed randomisation in blocks of four with a fixed seed, using random permutation. Thirty-four practices were allocated to the control arm and 36 to the intervention arm.
Intervention: control or SUPR
Control
PHLs and their CPs randomised to the control group received care as usual. All participating dispensers were qualified to provide care as usual according to the standard quality NOAH protocol for HA provision in the Netherlands (Veldnorm Hoortoestelverstrekking Citation2013). Care as usual covers several appointments with the dispenser and when scheduling these appointments, the PHL is advised to bring along a CP. The first appointment includes a screening pure tone audiogram (air conduction only) followed by an assessment of the PHL’s goals and needs. At this stage, CPs are encouraged to discuss their needs as well. PHLs are then asked to complete the Amsterdam Inventory for Auditory Disability and Handicap (AIADH; (Kramer et al. Citation1995)) at home and bring it to the next appointment. The AIADH addresses activity limitations and participation restrictions due to hearing loss. In the next appointment, a full audiometric (air and bone conduction) assessment and speech audiometry is performed. Based on these outcomes and the AIADH score, candidacy for HAs is determined. Then the PHL’s and CP’s preferences are discussed and the appropriate HAs are identified. HAs are fitted immediately if available in stock, or at the next appointment. Subsequently, PHLs can test their HAs during a trial (four weeks on average). At the fourth appointment, PHL’s and CP’s experiences with the HAs during the trial period are discussed and, if needed, the dispenser verifies that the HAs are performing as intended through aided testing and real-ear verification, validating that the patient is obtaining the maximum benefit from their HAs. The PHL then decides whether or not to purchase the HAs. If necessary, more appointments can be scheduled.
SUPR
CPs and PHLs in the SUPR group followed the same procedure as described above, including the CPs being encouraged to come along to appointments. Supplementary to the HA fitting procedure, PHLs and CPs in the SUPR arm received SUPR in which the CPs were encouraged to participate actively, as specified below. In short, SUPR includes:
1) A Practical Support Booklet, provided to the PHL at the first appointment with the dispenser. It contained information on hearing loss, HAs, and communication tips both for the CP and PHL and included space for them to take notes related to their specific needs and goals. These were discussed with the dispenser during the follow-up appointments and used to fine-tune the HA-fitting process. CPs were invited to take notes in the Booklet during the evaluation period and notice any differences in listening situations now that their PHL wore HAs. These were discussed with the dispenser during the fourth appointment.
2) Seventeen emails in total were delivered over six months (starting on the day the PHL started their HA trial period) with a time difference of approximately 2 weeks between emails. Emails were sent to the PHL only or the CP if the PHL did not have an email address. PHLs were asked to share all information delivered in these emails with their CP over the course of the intervention period. Every email contained a clickable link (except the first “welcome” and last “goodbye” email). Six emails contained links to written communication strategy tips with one email covering tips exclusively for the CP, one with information on HA maintenance, and two offering the PHL the option to contact the HAD practice. Eleven emails contained links to educational videos: 1) three instruction videos for PHLs providing information on how to handle and maintain their HAs; 2) five training videos demonstrating how to apply communication strategies in daily life. These were targeted at both the PHL and the CP. Some communication strategies were applied to both of them, and some were specifically targeted at the PHL or the CP. To illustrate, in the training video “The birthday party”, CPs were advised to lower the music volume when hosting a party, and how to speak calmly and clearly to PHLs; 3) three testimonial videos in which peers (both PHLs and CPs) shared their experiences with the PHL’s hearing loss and HAs. Dispensers were instructed to encourage PHLs to watch the videos together with their CP.
Outcomes – effect analysis
To examine the effectiveness of the SUPR program for CPs, self-reported outcome measures were administered online at four moments in time: At baseline (t0: in between their PHLs’ first appointment with the dispenser and the HA evaluation period, so before HAs were purchased), immediately after SUPR completion (t1: immediately after delivery of the last SUPR email, approximately six months after the HA purchase), six months (t2), and 12 months after SUPR completion (t3).
Third-party disability was measured with the Significant Other Scale for Hearing Disability (SOS-HEAR) which has good test-retest reliability, and internal consistency (Scarinci, Worrall, and Hickson Citation2009b). The original, English questionnaire was translated into Dutch, using a forward-backward method (Beaton et al. Citation2000). The SOS-HEAR is a 27-item tool assessing six domains of third-party disability and functioning: communication changes, communicative burden, relationship changes, going out and socialising, emotional reactions, and concern for a partner (see ). Response options (and scores) were: “not applicable” (0), “no problem” (0), “mild problem” (1), “moderate problem” (2), “severe problem” (3), or “complete problem” (4). Note that the response option “not applicable” is not used in the original scale. We decided to add this option after several respondents had indicated that many items did not apply to them. Since “not applicable” would indicate the situation never occurred, we decided to assign a score of 0, similar to the “no problem” score. This was done in agreement with the authors of the scale. The total score was calculated by averaging all 27 item scores. Six domain-specific scores were calculated by averaging the scores of all items within each domain. Scores could range from 0-4 (higher scores indicating greater third-party disability). We examined the internal consistency of the Dutch version using data from the current study. All subscales showed good internal consistency (Cronbach’s alphas ranged between 0.70 and 0.88). The total SOS-HEAR score showed excellent internal consistency (Cronbach’s alpha = 0.94).
HA rehabilitation outcomes were measured using three items of the International Outcome Inventory for HAs - Significant Other (IOI-HA-SO) (Noble Citation2002). These were: “use”, “satisfaction” and “quality of life”, and were administered to CPs in the control and SUPR group (see ). Note that for the CPs, the item “use” concerned how the CPs viewed this HA outcome for their PHL, while “satisfaction” and “quality of life” concerned how the CPs viewed these HA outcomes for themselves. For consistency, we will further refer to "proxy report" to describe “use”, and to “third-party disability” to describe “satisfaction” and “quality of life”. Due to an error, the remaining 4 IOI-HA-SO items were not administered in the CPs of the SUPR group. The IOI-AI-SO was administered to CPs in the SUPR group, to assess CPs’ views on the SUPR intervention. These were not used for comparison with the control group but served a descriptive purpose (see Supplemental Material 1). Again, certain IOI-HA-SO and IOI-AI-SO items included statements on CPs’ views on the HA for the PHL (“use”, “benefit”, and “residual activity limitations”), while the four other items asked about the CPs’ views on the HAs/SUPR for themselves (items “satisfaction”, “residual participation restrictions”, “impact on others”, and “quality of life”) (see Supplemental material 2). IOI item scores could range from 1 to 5 (higher scores indicating better outcomes). Note that the IOI-HA-SO and IOI-AI-SO were measured at t1–t3 and not at t0 because the IOI is a direct measure of change following an intervention. We also aimed to explore whether the CPs’ scores on the IOI-HA-SO items “use”, “satisfaction”, and “quality of life” differed significantly from that of their PHLs (IOI-HA) (see Statistical Analyses, dyad analysis). Therefore we also used the PHLs’ data on these IOI-HA items (t1–t3) (Meijerink et al. Citation2020).
Table 1. cRCT outcome measures (ranges) and time points.
Sample size
Since the cRCT was primarily targeted at PHLs, its sample size was based on the number of HAD practices needed to recruit sufficient PHLs (see randomisation procedure paragraph above). Nevertheless, we performed a CP sample size calculation after data collection, to determine whether the number of CPs would be sufficient to evidence a statistically significant group difference for the CP outcome: SOS-HEAR. Schulz et al. (Citation2017) found a difference of 0.42 on the SOS-HEAR total score between CPs of patients who pursued hearing evaluation for complaints at an otolaryngology clinic and CPs of patients who did not. We deduced a pooled SD of 0.79, resulting in an effect size of 0.53 (0.42/0.79). Hence, to detect an effect size of 0.53 on the SOS-HEAR total score [power 80%, significance level 5%, intracluster correlation coefficient 0.01], 2 CPs from each of the 70 HAD practices were required. Considering that on average 2.3 CPs across 32 HAD practices were included in the SUPR group, and 1.9 CPs across 29 HAD practices in the control group, the power of our study to find a statistically significant difference between the SUPR and control group on the SOS-HEAR was considered sufficient.
Statistical Analyses – effect analysis
Independent-samples t-tests, Mann-Whitney U tests, and χ2 tests were used to examine whether demographic variables were similarly distributed across the CPs in the control and SUPR groups.
Note that we also present characteristics of the PHLs (that formed dyads with the CPs) of the control and SUPR groups. This was especially relevant for the PHLs’ hearing loss and self-reported hearing disability (AIADH), as these could affect CPs’ third-party disability. Note that the PHL groups in this study are smaller than in the effect analyses publication (Meijerink et al. Citation2020), as 62% of the PHLs in the cRCT study did not have a CP.
The effect analysis was based on intention to treat (ITT). We used linear mixed models to examine differences in the course of the outcomes between CPs in the SUPR and control group. Group (SUPR, control), time (t0–t3, or t1–t3), and their two-way interaction (time*group) were included as fixed effects and random intercepts for subjects and HAD practices. In case of a significant group difference, post-hoc analyses (based on the estimated fixed effects) were performed to assess at which time points differences were present. For the proxy report (IOI-HA-SO item “use) and third-party disability (IOI-HA-SO items “satisfaction”, “quality of life”) we additionally examined the difference between the groups at t1 to determine the immediate post-treatment effect. In the case of a significant group difference at t1, a non-significant interaction term would indicate that the difference was maintained at t2 and t3. In contrast, a significant interaction term would indicate that this group difference changed (i.e. either disappeared or worsened). Further, we examined if potential confounders (demographics and all outcomes) were differently distributed between the groups at t0. If so, these were added as fixed covariates to the model.
We also performed a dyad analysis, to explore differences in the courses of each of the three IOI-HA items (“use”, “satisfaction”, “quality of life”) between CPs (IOI-HA-SO) and their PHLs (IOI-HA), and if these CP-PHL associations differed between the SUPR and control group. We based our dyad-analysis on that of Kramer et al. (Citation1995) using linear mixed models, with the target group (CP, PHL), time (t1–t3) and their two-way interaction (time*target group) included as fixed effects and random intercepts for subjects. To test any subgroup differences (control versus SUPR), a three-way interaction term (time*target group*intervention group) was included. For the main effect analysis, a p-value of <0.05 was considered statistically significant. Post-hoc analyses were Bonferroni-corrected for multiple testing (three follow-up measurements). Hence, a p-value of <0.016 (0.05/3) indicated statistical significance there. Imputation of missing outcomes was not considered as linear mixed modelling is known to be robust for missing data.
Process evaluation (PE)
A PE was carried out among the CPs in the SUPR group to evaluate how CPs used SUPR. We collected data on three parameters, based on Linnan and Steckler’s framework (2002):
Intervention-dose received
The extent to which CPs used and/or engaged with the Practical Support Booklet, i.e. whether they had read tips and information and written down their experiences with their PHL’s HAs;
The extent to which CPs used and/or engaged with SUPR’s videos, i.e. how many videos were watched. We used CPs’ self-report (PE-questionnaire described below) because there was no objective data available on CPs’ video viewing rates (emails with links to the videos were primarily sent to the PHL’s email address).
Satisfaction: CPs’ satisfaction with SUPR.
Perceived benefit: CPs’ perceived benefit of SUPR.
Measures – PE
Two data sources were used. One was the IOI-AI-SO with items “use”, “satisfaction” and “benefit”, administered at t1 in the SUPR arm (i.e. immediately after SUPR completion) to assess the parameters “perceived benefit” (IOI-AI-SO items “use” and “perceived benefit”), and “satisfaction” (IOI-AI-SO item “satisfaction”). A separate, online PE questionnaire was used (see Supplemental material 3) to evaluate all three parameters. The online questionnaire was developed for the purpose of this PE and based on questionnaires used in the PE study by Gussenhoven et al. (Citation2015). PE data were collected as part of the cRCT follow-up questionnaire at t1.
Statistical analysis – PE outcomes
The PE and IOI-AI-SO questionnaire data were analysed descriptively by calculating frequencies, percentages means (M) and standard deviations (SDs) (for normally distributed scores), or medians (Meds) and interquartile ranges (IQRs) (for non-normally distributed scores). We used SPSS (version 26) for all analyses.
Results
cRCT
Study population (effect analysis)
presents the flow of the CPs through the study. In total, 103 CPs from 33 HAD practices in the SUPR arm and 95 CPs from 33 HAD practices in the control arm, subscribed and provided their consent. Of those enrolled, 72 CPs originating from 32 HAD practices in the SUPR arm and 57 CPs originating from 29 HAD practices in the control group were included in the ITT analysis. Loss to follow-up was 5% in the SUPR group (4/72) and 7% in the control group (4/57). Forty-one CPs in the SUPR group (i.e. 41/72 = 57% of the sample included in the ITT analysis) filled out the PE questionnaire.
Figure 1. Flow of CP participants through the study.
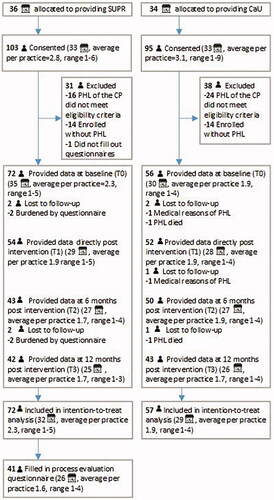
shows the demographic characteristics of the groups. Of the CPs included in the ITT analyses, 70% were female, the mean age was 62.1 years (SD 11.2), and 84% were the PHL’s partner or spouse. Demographic characteristics were similarly distributed across the SUPR and control CP groups, as were the baseline variables (p > 0.05), indicating successful randomisation. also shows demographic characteristics of the PHLs of the CPs participating in the control and SUPR groups (last two columns). Their characteristics neither differed significantly. Regarding the CP sample of the PE analyses, there was a significant gender difference (p = 0.014): CPs who completed the PE questionnaire were more often female than CPs who did not (58% vs. 30%). All other demographic characteristics were similarly distributed across PE responders and non-responders.
Table 2. Characteristics of CPs and their PHLs included in the ITT analysis (n = 128), and CPs included in the PE analysis (n = 41).
Outcome measures
presents the effects of SUPR on third-party disability (SOS-HEAR). No significant group differences were observed in the course of any of the third-party disability subscales and total score. Note that the baseline SOS-HEAR scores were already low, indicating a floor-effect (see Discussion).
Table 3. Descriptive statistics and results of linear mixed models on third-party disability (mean or median SOS-HEAR domain- and total scores).
presents the effect of SUPR on the proxy report (IOI-HA-SO item ‘use’) and third-party disability (IOI-HA-SO items “satisfaction”, and “quality of life”). No significant group differences were observed immediately after SUPR completion, nor were group differences found in the course of the outcomes.
Table 4. Descriptive statistics and results of the linear mixed models on rehabilitation outcomes (IOI-HA-SO).
Dyad-analysis
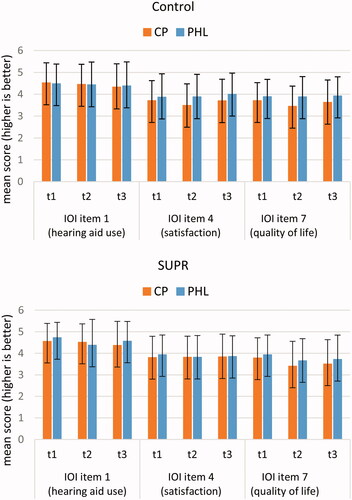
shows means and SDs of items (“use”, “satisfaction”, “quality of life”) for the CPs (IOI-HA-SO) and PHLs (IOI-HA). LMM analyses indicated no significant differences in the course of the PHLs’ and CPs’ outcomes, nor did these PHL-CP associations differ between the SUPR and control group.
Figure 2. Mean post-intervention and CP and PHL scores on the IOI-HA-SO (CPs) and IOI-HA (PHLs) items “use”, “satisfaction”, and “quality of life”.
PE
Dose-received
Practical support booklet
Sixty-eight percent (n = 28) of the CPs reported that their PHL had received the Practical Support Booklet, against 7% (n = 3) whose PHL had not, and 24% (n = 10) who could not remember whether or not their PHL had received it. Of the CPs whose PHL had received it, 54% (n = 15) reported that they had read or used the Booklet themselves, against 43% (n = 12) who had not, and 4% (n = 1) who could not remember. Reasons for not having read or used it were “I did not know the Practical Support Booklet was also intended for me as CP” (n = 7), “no interest” (n = 2), and “no time” (n = 1). Almost all CPs who used the Booklet indicated that they had also read the tips and information for the CP (87%, i.e. 13/15). Thirty-three percent (i.e. 5/15) of those who had used the booklet had written down their experiences (against 67%, i.e. 10/15 who had not). Reasons for not using the Booklet for the latter purpose were “no time” (n = 4), “no interest” (n = 2), “no added value”(n = 2), and “I did not know that as CP I could write down my experiences in the Booklet” (n = 2).
Educational videos
shows how many CPs reported having watched the educational videos. For all types of videos, >75% of the CPs indicated they had not watched them. Reasons were: “I don't have the impression I can help my PHL by watching the instruction videos” (n = 14) and “I didn’t know these instruction videos were also meant for me as CP” (n = 8). These reasons were also reported for the testimonial videos (n = 10, and n = 14, respectively). For the communication strategies and personal adjustment videos, the reasons were: “I did not know these videos were also meant for me as CP” (n = 16) and “no interest” (n = 8). Some CPs indicated they had never heard of these videos (around five respondents for each of the three video types).
Table 5. Intervention dose-received: The extent to which CPs (n = 41) watched the educational videos.
Satisfaction
CPs’ mean “satisfaction” score (IOI-AI-SO) was 2.8 (SD = 1.1) (n = 53). CPs’ median recommendation scores were approximately 5 out of 10 for each SUPR element. shows the extent to which CPs agreed, disagreed, or were neutral to the usefulness of the different SUPR elements for themselves, or for the PHL.
Table 6. Satisfaction with SUPR: the extent to which CPs thought the particular SUPR element was useful for themselves and their PHL.
Perceived benefit
The mean score on the PE-item asking CPs to what extent they thought SUPR was effective for improving their communication with the PHL and their PHL’s HA use was 2.6 (SD = 1.3; n = 41; scale ranging from 1 (“not effective”) to 5 (“very effective”)). The mean score on the PE-item asking whether CPs thought SUPR was effective for improving their PHL’s personal adjustment to hearing loss was 3.5 (SD = 1.9; n = 41; similar scale properties as above). CPs mean score on the IOI-AI-SO item “perceived benefit” was 2.6 (SD = 1.1) (n = 53). The IOI-AI-SO “use” item scores indicated that a little over half of the CPs had applied what they had learned from SUPR over the past two weeks: “sometimes” (43%), “often” (13%), “rarely” (11%) or “never” (32%).
Open question
Eleven CPs (out of 41) responded to the PE questionnaire’s final item: “Are there any issues that caught your attention while following SUPR? Think of issues that you found successful or that could be improved”. One CP was positive (“Time and time again, we learn something [i.e. from SUPR], both for the use of the HAs as well as for cleaning it”). Others were more critical. One example: “Personally, I prefer a website where I can easily find all information so that I can consult this when I have any questions or needs.” Four participants indicated they had never heard of SUPR.
Discussion
In this study, we examined the effectiveness of a support program (SUPR) for CPs of PHLs, using the results of the cRCT and the PE that was performed alongside the cRCT. Parts of SUPR were specifically targeted at CPs or were meant to be followed together with their PHL. We hypothesised that CPs in the SUPR group would experience less third-party disability than CPs in the control group. This hypothesis was not supported by our data as we found no significant group differences on the SOS-HEAR. Further, we expected that SUPR would result in more favourable HA outcomes from the CP’s perspectives than HA fitting alone would do. No significant group differences were found for these measures either. The exploratory dyad-analysis showed that SUPR did not change the relationship between how CPs viewed the HA outcomes for the PHL or themselves on the one side, and how PHLs viewed the HA outcomes for themselves on the other side. These results are discussed below.
Third-party disability
Both in the SUPR and control group, five of the six baseline SOS-HEAR scores were very low. This suggests that minimal third-party disability was present in our sample, leaving little or no room for improvement (i.e. a floor effect). Similar results were observed by Kramer et al. (Citation2005) who found very low third-party disability reported by CPs. They used the Hearing Handicap and Disability Inventory “reaction of others” (Van den Brink Citation1995). In this study, a less obvious floor-effect was observed for the ‘communication changes’ subscale. Although SUPR-recipients showed somewhat less third-party disability over the course of twelve months, this trend was roughly similar in the control group.
To investigate the floor-effect more thoroughly, we first checked how many CPs had indicated the situation described in each SOS-HEAR item was “not applicable” for them, versus being “no”, “a mild”, “a moderate”, “a severe”, or “a complete problem”. This could indicate whether a situation or attitude towards a situation was not present at all. For 18 of the 27 items, ≥33% of the CPs indicated that the situation was “not applicable”. This raised the question of whether the PHLs’ degree of hearing loss had influenced the floor effect. Additional explanatory analyses did not show any significant correlations between the PHL’spure-tone thresholds and the SOS-HEAR scores. Whether or not the SOS-HEAR is insensitive to mild levels of PHL’s hearing loss, needs further investigation. To our knowledge, only two other validated third-party disability measures exist (Van den Brink Citation1995; Preminger and Meeks Citation2012). These were not cross-validated with the SOS-HEAR. When comparing the SOS-HEAR scores in the current study to those of Scarinci, Worrall, and Hickson’s (Citation2009b), we observed that SUPR CP-sample’s scores appeared somewhat lower. PHLs of the CPs in the current study had milder levels of hearing loss than in Scarinci et al. However, this difference was minor (mean better ear pure-tone average 38.6 dB HL in this study, compared to 41.0 dB HL loss in Scarinci et al. (Citation2009b)). It must be noted that there is a lot of variability in experienced third-party disability that is likely related to other factors having nothing to do with the degree of hearing loss. For example, Preminger and Meeks (Citation2010) found that incongruence in hearing-loss-related quality of life scores between PHLs and CPs was related to negative mood scores. Lastly, it is possible that CPs in this study comprised a selective group just not experiencing any relevant third-party disability.
The absence of effects on third-party disability may also be explained by the low intervention dose received. Although 87% of the CPs indicated to have read the Practical Support Booklet, only 21% watched the videos on communication strategies and personal adjustment, which could potentially lower third-party disability. Similarly, low watching rates for these videos were found for the PHLs (paper in preparation). A connection between PHLs’ and CP’s low watching rates (and associated absence of effects on psychosocial outcomes) may be related to CPs only having video access via their PHLs’ emails.
HA-related intervention outcomes (proxy report and third-party disability: IOI-HA-so items “use”, “satisfaction”, and “quality of life”)
Our previous study among PHLs showed that SUPR caused slightly greater self-efficacy for HA handling and HA satisfaction (IOI-HA) (long-term effects), and a somewhat higher degree of HA use (IOI-HA) (short-term effect only) compared to controls (Meijerink et al. Citation2020). This was in accordance with the PHLs’ relatively good instruction video watching rates (up to 43%). In that light, the absence of any effects on the proxy report (PHL’s HA use) and third-party disability (satisfaction) may be unexpected. However, CPs’ previously mentioned low intervention dose received, combined with the small PHL effects on the HA-related outcomes may have caused these effects to go unnoticed by the CPs.
Dyad-analysis
The dyad-analysis showed that SUPR did not change the relationship between the proxy report (IOI-HA-SO item “use”) or third-party disability (IOI-HA-SO items “satisfaction” and “quality of life”) on the one side, and how PHLs viewed the HA outcomes for themselves (IOI-HA items “use”, “satisfaction” and “quality of life”) on the other side. This analysis neither showed differences between CPs’ and PHLs’ HA outcome appraisals (independent of intervention group). This suggests that PHLs and CPs had similar views on the PHLs’ HA use and that the effects of HAs on satisfaction and quality of life among the PHLs and CPs were also largely similar. SUPR did not seem to influence these perceptions. Similarly, Kramer et al. (Citation2005) found no significant differences when they compared spouses’ and PHLs’ IOI scores. Note that we did not compare scores of PHL-CP couples directly (we compared PHL and CP group means) and only examined one item (item “use”) in which the underlying construct was the same for the PHLs and CPs (i.e. PHLs’ HA use). Preminger and Meeks (Citation2010) found borderline statistically significant effects when examining the level of congruence (defined as similar scores within PHL-CP couples) between spouses’ and PHLs’ assessments of the PHLs’ hearing disability. Congruence improved somewhat in the experimental group (with spouses participating in AR classes) but not in the control group (no AR classes). This effect was not statistically significant. More studies should examine whether support programs for CPs can significantly align CPs’ and PHLs’ appraisals of intervention outcomes, and improve CPs’ awareness of their PHLs’ hearing disability.
Effect of CP involvement on PHL
To explore if the involvement of a CP in SUPR on itself led to improved PHL’s hearing health outcomes, we compared PHL outcomes between SUPR-recipients who had a participating CP (n = 73), with SUPR-recipients who did not have a CP (n = 107). We did not find any significant differences between the groups.
Reasons for low intervention use and possible improvements of SUPR
Low intervention use was a problem in SUPR and is common in e-health interventions (Kohl, Crutzen, and de Vries Citation2013). E-health interventions provide the option to discontinue easily in particular when they are notmandatory in a study like this(Eysenbach Citation2005). One solution to improve SUPR use may be to increase the fidelity of dispensers in encouraging their clients to watch the educational videos. The PE for PHLs showed that only half of the dispensers did this. Note that this study was conducted before the COVID-19 pandemic. The changes that have occurred to the provision of healthcare since the onset of the pandemic might perhaps increase patient and communication partner adherence to online rehabilitation efforts.
CPs’ appraisals for the SUPR program (IOI-AI-SO scores) were somewhat lower when compared to other interventions, such as the Home Education Program and the Active Communication Education (ACE) program. This was most evident for item 4 (satisfaction). CPs’ mean satisfaction scores on the Home Education Program and ACE immediately post-intervention were 3.5 and 4.4, respectively (Hickson, Worrall, and Scarinci Citation2006; Kramer et al. Citation2005), against 2.8 for SUPR. A communication program specifically designed for and sent to CPs directly (via their personal email addresses) rather than via the PHL, may yield more tailored, visible intervention content, consequently leading to higher use and impact. Preminger and Meeks (Citation2010) designed AR classes for spouses. As mentioned earlier, they found that congruence in PHL-CP couples seemed to improve somewhat in the experimental group, suggesting that participation in AR classes may improve CPs’ understanding of their PHLs’ hearing loss (although effects on CPs’ mood, stress, or communication in marriage were not found). They applied a live, group format. Such formats may be beneficial for improving CP outcomes. However, the Home Education Program used an individual setting for PHLs and their CPs (delivered via DVDs/videotapes, at home), and it was generally well-received. Further qualitative research is needed to understand the way CPs used SUPR, how they interacted with their PHL while using the program, and how these aspects may be improved to increase its use and effectiveness.
Strengths and limitations
This is the first study evaluating the effects of a web-based communication program for CPs in a real-life HAD setting. We examined short-term (immediately post-intervention), medium (six months follow-up), and long-term (12 months) effects, which is unique in hearing research in general, and even more so for CP outcomes. Another strength is the focus on CPs’ usage of SUPR, and assessment of satisfaction and benefit. Triangulation of methods in this study contributed to a better understanding of the cRCT results. We recommend using PE studies in audiology research.
There are some limitations. Firstly, qualitative data were minimally collected, using the open-ended question in the PE questionnaire only, limiting insights into CPs experiences with SUPR. We did collect full qualitative data as part of the PE for the PHLs, but it was beyond the scope of this project to also include it for CPs.
Secondly, similar to PHLs in the SUPR group, PHLs in the control group were encouraged to appoint a CP and bring them along to appointments. We speculate that this may have diluted group differences. Unfortunately, it was not measured to what extent CPs joined the PHL to the appointments, so we could not examine this.
Finally, blinding of participants, dispensers, and researchers was not possible because participants and dispensers had to be informed about the aim of the study and the arm to which they were allocated. This impacted the design of the study (Altman et al. Citation2001). Lack of blinding may have introduced risks for bias; CPs aware of receiving SUPR may have responded more favourably compared to controls (Karanicolas, Farrokhyar, and Bhandari Citation2010; Schulz and Grimes Citation2002). Blinding of researchers was not possible because the IOI revealed group allocation (IOI-HA-SO: control group, IOI-AI-SO: intervention group).
Conclusion
Whereas it is widely recommended to actively involve CPs in their PHL’s rehabilitation and in communication programs such as a SUPR to reduce third-party disability, our study did not show intervention effects. The absent third-party disability effect may have been due to a floor-effect in the SOS-HEAR questionnaire. This raises the question of whether the third-party disability is an existing phenomenon in groups of CPs of PHLs with milder levels of hearing impairment. Low engagement of CPs with the intervention materials was an issue in this study. One reason was a lack of awareness among CPs that SUPR was also intended for them. Rather than inviting CPs via their PHLs, inviting them directly may be a better strategy to increase their participation and benefit, satisfaction, and usefulness ratings. Additionally, the low baseline third-party disability found in this study underlines the importance to further investigate the consequences of hearing loss on CPs in more detail, to optimise support for CPs.
Acknowledgements
The authors thank all clients of Schoonenberg B.V. (AudioNova International B.V.) and their communication partners who participated in the study. S.E.K. obtained funding for this research. S. E. K and M.P. conceptualized and designed this study. J. F.J. M collected the data, assisted by V.J. and M.P., and supervised by M.P. and S.E.K. J. F.J. M wrote the first draft of the manuscript. J. F.J. M. performed statistical analyses. B. I. L.W. provided statistical and methodological advice. J. F.J. M. wrote the article. Input was provided by all co-authors. All authors approved the final manuscript.
Disclosure statement
Most of JFJM’s appointment at the Amsterdam UMC as a Ph.D. student on the SUPR project (including carrying out the tasks related to the submitted work), and the design and implementation of the SUPR study were facilitated through a research grant sponsored by Audionova International, MP was employed as a researcher at Schoonenberg HoorSupport (a daughter company of Audionova International) for 6 months on other research work, received a (co-funding) research grant from Sonova AG (mother company of Audionova International) for other research work, and has been paid for delivering a one-off scientific presentation for Sonova AG, VJ is an employee at Schoonenberg HoorSupport, SEK has been paid for delivering a presentation for Sonova AG; no other relationships or activities that could appear to have influenced the submitted work can be reported.
Additional information
Funding
References
- Aazh, Hashir, Deepak Prasher, Kiran Nanchahal, and Brian C. J. Moore. 2015. “Hearing-Aid Use and Its Determinants in the UK National Health Service: A Cross-Sectional Study at the Royal Surrey County Hospital.” International Journal of Audiology 54 (3): 152–161. doi:https://doi.org/10.3109/14992027.2014.967367.
- Abrams, H. B., and J. Kihm. 2015. “An Introduction to MarkeTrak IX: A New Baseline for the Hearing Aid Market.” Hear Rev 22 (6): 16.
- Altman, D. G., K. F. Schulz, D. Moher, M. Egger, F. Davidoff, D. Elbourne, P. C. Gøtzsche, et al. 2001. “The Revised CONSORT Statement for Reporting Randomized Trials: Explanation and Elaboration.” Annals of Internal Medicine 134 (8): 663–694. doi:https://doi.org/10.7326/0003-4819-134-8-200104170-00012.
- Barker, F. E., E. Mackenzie, L. Elliott, S. Jones, and S. de Lusigan. 2016. “Interventions to Improve Hearing Aid Use in Adult Auditory Rehabilitation.” Cochrane Database Syst Rev 8: CD010342. doi:https://doi.org/10.1002/14651858.CD010342.pub3.
- Beaton, D. E., C. Bombardier, F. Guillemin, and M. B. Ferraz. 2000. “Guidelines for the Process of Cross-Cultural Adaptation of Self-Report Measures.” Spine 25 (24): 3186–3191. doi:https://doi.org/10.1097/00007632-200012150-00014.
- Bertoli, Sibylle, Katharina Staehelin, Elisabeth Zemp, Christian Schindler, Daniel Bodmer, and Rudolf Probst. 2009. “Survey on Hearing Aid Use and Satisfaction in Switzerland and Their Determinants.” International Journal of Audiology 48 (4): 183–195. doi:https://doi.org/10.1080/14992020802572627.
- Boothroyd, A. 2007. “Adult Aural Rehabilitation: What is It and Does It Work?” Trends in Amplification 11 (2): 63–71. doi:https://doi.org/10.1177/1084713807301073.
- Brooks, D. N., R. S. Hallam, and P. A. Mellor. 2001. “The Effects on Significant Others of Providing a Hearing Aid to the Hearing-Impaired Partner.” British Journal of Audiology 35 (3): 165–171. doi:https://doi.org/10.1080/00305364.2001.11745234.
- Campbell, Marion K., Gilda Piaggio, Diana R. Elbourne, and Douglas G. Altman. 2012. “Consort 2010 Statement: Extension to Cluster Randomised Trials.” BMJ (Clinical Research ed.) 345: e5661 doi:https://doi.org/10.1136/bmj.e5661.
- Chisolm, Theresa Hnath, Carole E. Johnson, Jeffrey L. Danhauer, Laural J. P. Portz, Harvey B. Abrams, Sharon Lesner, Patricia A. McCarthy, et al. 2007. “A Systematic Review of Health-Related Quality of Life and Hearing Aids: Final Report of the American Academy of Audiology Task Force On the Health-Related Quality of Life Benefits of Amplification in Adults.” Journal of the American Academy of Audiology 18 (2): 151–183. doi:https://doi.org/10.3766/jaaa.18.2.7.
- Eysenbach, G. 2005. “The Law of Attrition.” Journal of Medical Internet Research 7 (1): e11. doi:https://doi.org/10.2196/jmir.7.1.e11.
- Gussenhoven, Arjenne H. M., Amika S. Singh, S. Theo Goverts, Marten van Til, Johannes R. Anema, and Sophia E. Kramer. 2015. “A Process Evaluation of Implementing a Vocational Enablement Protocol for Employees with Hearing Difficulties in Clinical Practice.” International Journal of Audiology 54 (8): 507–517. doi:https://doi.org/10.3109/14992027.2015.1009642.
- Hartley, David, Elena Rochtchina, Philip Newall, Maryanne Golding, and Paul Mitchell. 2010. “Use of Hearing AIDS and Assistive Listening Devices in an Older Australian Population.” Journal of the American Academy of Audiology 21 (10): 642–653. doi:https://doi.org/10.3766/jaaa.21.10.4.
- Hetu, R., L. Jones, and L. Getty. 1993. “The Impact of Acquired Hearing Impairment on Intimate Relationships: Implications for Rehabilitation.” Audiology 32 (6): 363–381. doi:https://doi.org/10.3109/00206099309071867.
- Hickson, Louise, Carly Meyer, Karen Lovelock, Michelle Lampert, and Asad Khan. 2014. “Factors Associated with Success with Hearing Aids in Older Adults.” International Journal of Audiology 53 Suppl 1: S18–S27. doi:https://doi.org/10.3109/14992027.2013.860488.
- Hickson, L., L. Worrall, and N. Scarinci. 2006. “Measuring Outcomes of a Communication Program for Older People with Hearing Impairment Using the International Outcome Inventory.” International Journal of Audiology 45 (4): 238–246. doi:https://doi.org/10.1080/14992020500429625.
- Kamil, R. J., and F. R. Lin. 2015. “The Effects of Hearing Impairment in Older Adults on Communication Partners: A Systematic Review.” Journal of the American Academy of Audiology 26 (2): 155–182. doi:https://doi.org/10.3766/jaaa.26.2.6.
- Kaplan-Neeman, Ricky, Chava Muchnik, Minka Hildesheimer, and Yael Henkin. 2012. “Hearing Aid Satisfaction and Use in the Advanced Digital Era.” The Laryngoscope 122 (9): 2029–2036. doi:https://doi.org/10.1002/lary.23404.
- Karanicolas, P. J., F. Farrokhyar, and M. Bhandari. 2010. “Practical Tips for Surgical Research: Blinding: Who, What, When, Why, How?” Canadian Journal of Surgery. Journal Canadien de Chirurgie 53 (5): 345–348.
- Kohl, L. F., R. Crutzen, and N. K. de Vries. 2013. “Online Prevention Aimed at Lifestyle Behaviors: A Systematic Review of Reviews.” Journal of Medical Internet Research 15 (7): e146. doi:https://doi.org/10.2196/jmir.2665.
- Kramer, Sophia E., G. Hella M. Allessie, Agaath W. Dondorp, Adriana A. Zekveld, and Theo S. Kapteyn. 2005. “A Home Education Program for Older Adults with Hearing Impairment and Their Significant Others: A Randomized Trial Evaluating Short- and Long-Term Effects.” International Journal of Audiology 44 (5): 255–264. doi:https://doi.org/10.1080/14992020500060453.
- Kramer, S. E., T. S. Kapteyn, J. M. Festen, and H. Tobi. 1995. “Factors in Subjective Hearing disability.” Audiology 34 (6): 311–320. doi:https://doi.org/10.3109/00206099509071921.
- Lin, T. C., M. Yen, and Y. C. Liao. 2019. “Hearing Loss is a Risk Factor of Disability in Older Adults: A Systematic Review.” Archives of Gerontology and Geriatrics 85: 103907. doi:https://doi.org/10.1016/j.archger.2019.103907.
- Linnan, L., and A. Steckler. 2002. Process Evaluation for Public Health Interventions and Research. San Francisco, CA: Jossey-Bass.
- McCormack, A., and H. Fortnum. 2013. “Why Do People Fitted with Hearing Aids Not Wear them?” International Journal of Audiology 52 (5): 360–368. doi:https://doi.org/10.3109/14992027.2013.769066.
- Meijerink, J. F. J., M. Pronk, B. I. Lissenberg-Witte, V. Jansen, and S. E. Kramer. 2020. “Effectiveness of a Web-Based SUpport PRogram (SUPR) for Hearing Aid Users Aged 50+: Two-Arm, Cluster Randomized Controlled Trial.” Journal of Medical Internet Research 22 (9): e17927.
- Meijerink, Janine F. J. , Marieke Pronk, Bernadette Paulissen, Birgit I. Witte, Bregje van der Wouden, Vera Jansen, Sophia E. Kramer, et al. 2017. “Effectiveness of an Online SUpport PRogramme (SUPR) for Older Hearing Aid Users: study Protocol for a Cluster Randomised Controlled Trial.” BMJ Open 7 (5): e015012. doi:https://doi.org/10.1136/bmjopen-2016-015012.
- Noble, W. 2002. “Extending the IOI to Significant Others and to Non-Hearing-Aid-Based Interventions.” International Journal of Audiology 41 (1): 27–29. doi:https://doi.org/10.3109/14992020209101308.
- Preminger, J. E., and S. Meeks. 2010. “Evaluation of an Audiological Rehabilitation Program for Spouses of People with Hearing Loss.” Journal of the American Academy of Audiology 21 (5): 315–328. doi:https://doi.org/10.3766/jaaa.21.5.4.
- Preminger, J. E., and S. Meeks. 2012. “The Hearing Impairment Impact-Significant Other Profile (HII-SOP): A Tool to Measure Hearing Loss-Related Quality of Life in Spouses of People with Hearing Loss.” Journal of the American Academy of Audiology 23 (10): 807–823. doi:https://doi.org/10.3766/jaaa.23.10.6.
- Preminger, J. E., J. J. Montano, and T. Tjornhoj-Thomsen. 2015. “Adult-Children’s Perspectives on a Parent’s Hearing Impairment and Its Impact on Their Relationship and Communication.” International Journal of Audiology 54 (10): 720–726. doi:https://doi.org/10.3109/14992027.2015.1046089.
- Scarinci, N., L. Worrall, and L. Hickson. 2008. “The Effect of Hearing Impairment in Older People on the Spouse.” International Journal of Audiology 47 (3): 141–151. doi:https://doi.org/10.1080/14992020701689696.
- Scarinci, N., L. Worrall, and L. Hickson. 2009a. “The ICF and Third-Party Disability: Its Application to Spouses of Older People with Hearing Impairment.” Disability and Rehabilitation 31 (25): 2088–2100. doi:https://doi.org/10.3109/09638280902927028.
- Scarinci, N., L. Worrall, and L. Hickson. 2009b. “The Effect of Hearing Impairment in Older People on the Spouse: Development and Psychometric Testing of the Significant Other Scale for Hearing Disability (SOS-HEAR).” International Journal of Audiology 48 (10): 671–683. doi:https://doi.org/10.1080/14992020902998409.
- Scarinci, N., L. Worrall, and L. Hickson. 2012. “Factors Associated with Third-Party Disability in Spouses of Older People with Hearing Impairment.” Ear and Hearing 33 (6): 698–708. doi:https://doi.org/10.1097/AUD.0b013e31825aab39.
- Schulz, K. F., and D. A. Grimes. 2002. “Blinding in Randomised Trials: hiding Who Got What.” Lancet 359 (9307): 696–700. doi:https://doi.org/10.1016/S0140-6736(02)07816-9.
- Schulz, Kristine A., Naomi Modeste, Jerry W. Lee, Rhonda Roberts, Gabrielle H. Saunders, and David L. Witsell. 2017. “Burden of Hearing Loss on Communication Partners and Its Influence on Pursuit of Hearing Evaluation.” Ear and Hearing 38 (5): e285–e291. doi:https://doi.org/10.1097/AUD.0000000000000421.
- Solheim, J., and L. Hickson. 2017. “Hearing Aid Use in the Elderly as Measured by Datalogging and Self-Report.” International Journal of Audiology 56 (7): 472–479. doi:https://doi.org/10.1080/14992027.2017.1303201.
- Stark, P., and L. Hickson. 2004. “Outcomes of Hearing Aid Fitting for Older People with Hearing Impairment and Their Significant Others.” International Journal of Audiology 43 (7): 390–398. doi:https://doi.org/10.1080/14992020400050050.
- Van den Brink, R. H. S. 1995. Attitude and illness behaviour in hearing impaired elderly. Unpublished doctoral dissertation. University of Groningen.
- Vas, V., M. A. Akeroyd, and D. A. Hall. 2017. “A Data-Driven Synthesis of Research Evidence for Domains of Hearing Loss, as Reported by Adults with Hearing Loss and Their Communication Partners.” Trends in Hearing 21: 2331216517734088. doi:https://doi.org/10.1177/2331216517734088.
- Veldnorm Hoortoestelverstrekking. 2013. Utrecht: Nationaal Overleg Audiologische Hulpmiddelen (NOAH).
- Wallhagen, Margaret I., William J. Strawbridge, Sarah J. Shema, and George A. Kaplan. 2004. “Impact of Self-Assessed Hearing Loss on a Spouse: A Longitudinal Analysis of Couples .” The Journals of Gerontology. Series B, Psychological Sciences and Social Sciences 59 (3): S190–S196. doi:https://doi.org/10.1093/geronb/59.3.s190.
- World Health Organization (WHO). 2001. International Classification of Functioning, Disability and Health: ICF. Geneva, Switzerland: World Health Organization.