
Abstract
Objective
To estimate the hearing aid coverage for people with disabling hearing loss using data on hearing aid sales.
Design
Data on prevalence of disabling hearing loss from WHO and on hearing loss from moderate to severe from the Global Burden of Disease enterprise are used to estimate the number of people with hearing loss. Data on hearing aid sales from the European Hearing Instrument Manufacturers Association (EHIMA) are used to estimate the number of people using hearing aids.
Study sample
From 2009 to 2018, the worldwide sales of hearing aids by the EHIMA members were 124 million units.
Results
The world-wide hearing aid coverage is 10–11% depending on the prevalence of data source. For all low- to middle-income regions that make up 85% of the world population, the coverage ranges from 1.5% to 12%. In the group of high-income countries as defined by WHO, the coverage is 57%.
Conclusions
Data on hearing aid sales can be used to estimate hearing aid coverage regionally, and world-wide. Globally, there is a huge unmet need for hearing instruments since less than 11% of people with a disabling hearing loss are hearing aid users.
Introduction
Hearing loss affects a large proportion of the world population and can have profound influence on quality of life (Dalton et al. Citation2003; Lin Citation2011). The World Health Organisation (WHO) has estimated that close to 466 million people currently have some form of Disabling Hearing Loss (DHL) and that this number will approach one billion in the coming 30 years (World Health Organization Citation2018). WHO defines DHL as a hearing loss greater than 40 dB HL in the better ear. The prevalence of DHL varies across countries and regions and WHO offers estimates of the prevalence at both a regional and global level (World Health Organization Citation2018). In the most recent World Hearing Report, WHO has published a revised estimate and now estimate that 430 million people have some form of hearing loss at a moderate level or worse (World Health Organization Citation2021). Most people who experience hearing loss can be helped by prosthetic amplification devices in the form of hearing aids (Ferguson et al. Citation2016). Unfortunately, many of those who could benefit from hearing aids do not use them. There are various reasons why not all with hearing loss use hearing aids but cost, poor access to hearing healthcare and lack of information are significant barriers to hearing aid uptake (McPherson Citation2018; Orji et al. Citation2020). Hearing aid use is more widespread in affluent countries and regions (Bright, Wallace, and Kuper Citation2018). Although it is established that more people could benefit from hearing aids, accurate estimates of hearing aid usage throughout the world are lacking. In a recent paper, the proportion of people in need who use hearing aids has been estimated for the regions of the world as defined by the Global Burden of Disease (GBD) enterprise (Orji et al. Citation2020). A very large set of data is used to develop estimates of the prevalence of hearing loss using multiple data sources and the method of the GBD publications (GBD Citation2018). The global prevalence of people with hearing losses categorised as moderate, moderately severe, and severe is estimated to 401 million people. Data on the number of people with hearing loss that use hearing aids are needed to calculate the hearing aid coverage.
The Coverage is defined as the ratio of hearing aid users to people with hearing loss and the unmet need as the ratio of people with hearing loss not using hearing aids to the number of people with hearing loss. It bears mentioning that these definitions assume that all with hearing loss are candidates for hearing aids. This is of course not true. A small proportion of people cannot benefit from hearing aids, such as those with very profound hearing loss or no residual hearing. A greater source of error in estimating Coverage and unmet need based on the assumption that all with hearing loss are hearing aid candidates are those for whom medical treatment can correct or significantly reduce hearing loss. For example, in low-income countries, hearing loss is frequently caused by otitis media that requires medical intervention. However, even when otitis media is successfully treated, 50% to 100% of those individuals are left with a permanent hearing loss that could be helped with hearing aids (Graydon et al. Citation2019). Although it is acknowledged that assuming all with hearing loss are hearing aid candidates is an issue, correcting for the proportion of people who are not hearing aid candidates is complex and beyond the scope of this paper. Therefore, the proportion of people with hearing loss according to WHO and GBD definitions will be used as is for calculating Coverage. The availability of data for estimating the prevalence of hearing loss is quite abundant and the estimates by the GBD group as well as WHO are well documented. It can be debated whether DHL or moderate to severe hearing loss is a proper definition of people in need. Data from the EuroTrak surveys showed that 19% of people reporting mild hearing loss are also hearing aid users (EHIMA Citation2020c). In some countries with high Coverage, the number of users exceeds the number of people in need according to either of the two definitions. For instance, EuroTrak 2018 data for the UK suggest that 3 million people are using hearing aids, while the number of people with DHL is estimated at only 2.74 million. At any rate, an alignment between the definitions from WHO and GBD would be desirable as argued in a recent publication (Olusanya, Davis, and Hoffman Citation2019). This seems to have influenced the World Health Organization (Citation2021) report where the term “DHL” is replaced by “greater than moderate” hearing loss. A remaining difference between WHO and GBD is that GBD data exclude people with profound hearing loss or no residual hearing from their numbers.
The data on hearing aid use available in the scientific literature are quite limited and mostly originate from affluent countries (Orji et al. Citation2020). The data are from surveys, many of which were conducted and published more than 10 years ago. For example, The Multi-Country Survey study on Health and Responsiveness was based on data collected in 2000–2001 (World Health Organization Citation2012). The Nord-Trondelag study was from 2004 (Tambs Citation2004) and NHANES dates to 2005–2010 (Bainbridge and Ramachandran Citation2014). Although the estimation methods applied by Orji et al. are very sophisticated and use all available data sources, the results still seem to be associated with considerable uncertainties. This is also acknowledged by the authors who state: “Despite the presence of some good-quality studies, the literature on use of hearing aids has been poor and fragmented” (Orji et al. Citation2020). The method and results of Orji et al. are largely adopted by the WHO in their 2021 report. A data source that hitherto has been unavailable but that could be truly relevant is data on the sales of hearing aids in each country and region. The number of people using hearing aids must be related to the number of devices sold over a certain period. The global sales of hearing aids have grown in the order of 5–6% in recent years (EHIMA Citation2020a) and the availability of up-to-date data sources is thus important for calculating the current Coverage. The prevalence of hearing loss on the other hand, only seems to vary slowly over decades. A comparison between hearing loss prevalence in 1959–1962 and 1999 and 2004 showed a slight decrease in the prevalence of hearing loss above 25 dB HL (Olusanya, Davis, and Hoffman Citation2010). Another study showed no difference over a period from 1999 to 2004 (Agrawal, Platz, and Niparko Citation2008). The present study is based on data on hearing aid sales by the members of the European Hearing Instrument Manufacturers Association (EHIMA) in the period from 2009 to 2018. The largest hearing aid manufacturers in the world are members of EHIMA. The list of members can be found on www.ehima.com/about-ehima/members-of-ehima/. The EHIMA unit sales data give a unique opportunity to estimate Coverage from a current data set that covers all regions of the world and that has detailed data from more than 70 countries. This paper presents a calculation model that has been developed to estimate Coverage from unit sales data and other relevant information such as bilateral fitting percentage and hearing aid lifetime.
Materials and methods
Overview
The Global Burden of Disease (GBD) enterprise divides the world into 6 regions each with more than 500 million people (Global Burden of Disease [GBD] 2018). The regions with their corresponding approximate populations are Africa (1 billion), Eastern Mediterranean (550 million), Europe (850 million), The Americas (1 billion), South East Asia (2,1 billion) and Western Pacific (1.9 billion). The regions of the GBD model are geographically coherent and each has a large population but the countries within several of these regions differ substantially with regards to economical capacity. The economical capacity has a bearing on the Coverage (Bright, Wallace, and Cooper Citation2018). For instance, in the region of The Americas, the yearly Gross National Income (GNI) per capita varies from USD ($) 2.100 (Nicaragua) to $56.850 (USA) (World Bank Citation2020). Averaging over such differences in economical capacity may conceal important details and underestimate the Coverage for the affluent countries and overestimate the Coverage for low-income countries. Another way of dividing the countries of the world with a higher granularity is promoted by WHO (World Health Organization Citation2018). The major difference is the separation of affluent countries into a group of its own. This group is named the high-income region and cuts across several geographical regions like Asia Pacific, Australasia, North America and Western Europe while the other regions of the WHO segmentation model are related to geography. The regions and their population are: High-income (1 billion), Central/Eastern Europe Central Asia (410 million), Sub-Saharan Africa (1 billion), Middle East and North Africa (500 million), South Asia (1.7 billion), East Asia (1,4 billion), Asia Pacific (670 million) and Latin America and Caribbean (640 million). In the 2021 report from WHO the regional division used by the GBD has been adopted but for this study the WHO (Citation2018) data will be used because of the different regional division with a higher granularity and most prominently the formation of a non-geographical high-income region. The analysis in this study will thus use both models; the GBD model to create a comparison to the study by Orji et al. and the WHO (Citation2018) model for more precise results for regions with countries of comparable economical capacity.
Data sources
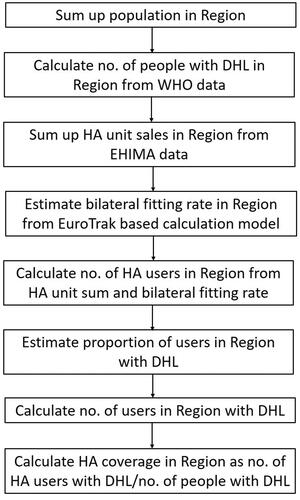
Several different data sources are used for the analysis. An overview of the data sources is shown in . One set of data on hearing loss prevalence is taken from the WHO data on DHL (WHO Citation2018). The prevalence of people with a hearing loss above 40 dB HL is reported for each of eight regions. Another source of data for prevalence of hearing loss is the comprehensive study of prevalence in the GBD regions by Orji et al. They include only people with hearing losses ranging from moderate to severe, excluding those with mild and profound hearing loss and those with no residual hearing. This group includes people with hearing loss between 35 dB HL and 79 dB HL. The prevalence of such hearing loss is reported as a percentage of the population in each of the six GBD regions. Demographic data for each country in a region are pulled from Index Mundi, a data portal that gathers facts and statistics from multiple sources (Index Mundi Citation2020). Data on Gross National Income are pulled from the World Bank website (World Bank Citation2020).
Table 1. Data sources used for estimating hearing aid coverage from EHIMA unit sales data.
Data on hearing aid sales per country have been collected systematically by the hearing aid industry for many years. In many affluent countries, the wholesalers’ organisations collect data on the unit sales in their market. Each member of the wholesalers’ associations sends the numbers of units sold in the past year to a mutually agreed upon independent agent who sums up the units for the total and returns that number to the members. This type of data is only in some cases publicised. In countries with government subsidy systems for hearing aids, it is sometimes possible to find data on the number of hearing aids provided under subsidy each year but in many other countries such data are unavailable. In recent years, the industry association for hearing aid manufacturers, EHIMA, has collected data from their members on annual hearing aid sales in regions and in total. The total unit sales per year for 2017–2019 are publicly available on the EHIMA website (EHIMA Citation2020a), but we have additionally been granted access to data going back to 2009. Furthermore, the data include the detailed data set for regions as well as the data reported by the wholesalers in each individual country. In the years 2009 to 2012, the data were based on wholesalers’ reports and government data supplemented by estimates from the members. From 2013 to 2014, the total unit sales by the EHIMA members were compiled and from 2015 to 2019 the sales in each of six regions as well as the total were added. The regions used by EHIMA are composed differently than both the GBD and the WHO regions. The EHIMA data at the regional level are shown in . The granularity of the data varies considerably. For North America, the percentage of unit sales reported by the wholesalers’ association in each country is 87% of the total for that region and for Western Europe the percentage is 92%. These two regions account for around 70% of the total unit sales worldwide and this percentage has been stable over the entire period. For APAC, the percentage of locally reported unit sales is 39%. For the other regions, no country specific data are available and the EHIMA data reflect only the sum of unit sales for the countries in the region. Data on the percentage of bilateral fittings are taken from EuroTrak surveys. These surveys are conducted in mostly affluent countries and the results can be found on the EHIMA website (EHIMA Citation2020b). The EuroTrak surveys have been conducted regularly in the UK, Germany and France since 2009. The design of these surveys and some significant findings has been published (Bisgaard and Ruf Citation2017).
Table 2. Unit sales of hearing instruments in millions per year and per region reported or estimated by EHIMA members.
Modelling strategy
Coverage is defined as the ratio of hearing aid users to people with hearing loss in each region. gives an overview of the calculations leading to the Coverage estimates for the WHO model. The number of people with hearing loss can be derived from prevalence data published by WHO and GBD. The number of hearing aid owners in each geographical area, which could be a country or a group of countries, can be derived from the number of hearing aids sold in that area. The analysis is done for both the WHO model and the GBD model in that order. In addition to population with hearing loss and hearing aid sales, the essential information that must be known is the average lifetime of the hearing aids and the average proportion of bilateral fittings. The countries of each WHO region are grouped together, and the total population of the region calculated. The number of people with DHL is calculated by using the percentage shown by WHO.
Figure 1. Flowchart for calculation of Coverage.
Hearing aids do not last forever. They will be worn out at some point in time. They could also be replaced before they are worn out because they are no longer appropriate for the hearing loss or because new hearing aids are acquired with a subsidy after a certain number of years. Many affluent countries have public reimbursement schemes where new hearing aids can be acquired with a subsidy after a certain number of years that ranges from three to six years (EFHOH Citation2018). Therefore, the lifetime of hearing aids must be figured into the estimate of how many hearing aids are in use. Analysis of the EuroTrak data combined with unit sales data shows that the average lifetime of a hearing aid in affluent countries is around five years (Unpublished observations). The number of hearing aids in use can be estimated as the annual sales in units summed over a certain number of years. The number of years to sum over is determined by how long the hearing aids are kept before they are renewed or worn out. The majority of the high-income countries have GNI/capita above $30,000. Therefore, for all countries with a GNI/Capita above $30,000, the expected lifetime of a hearing aid is set to five years for the analysis model. For all the other regions which are generally low-income regions, it is assumed that common practice is to replace hearing aids when they are completely worn out. A lifetime of eight years is assumed for these regions. The EHIMA unit sales data for each country in the region is then summed. Depending upon the value of GNI/capita as described above unit sales for each country in the region is summed for a period of either five or eight years.
Hearing loss in both ears is common, and it is beneficial to use two hearing aids (Noble and Gatehouse Citation2006). However, not all people with bilateral hearing loss also get two hearing aids. When a certain proportion of users have been fitted with two hearing aids, the number of hearing aid users is thus smaller than the total number of units sold. The percentage of bilateral fittings is needed to adjust for this condition. If a given number of hearing aids were sold, the number of users is the number of hearing aids divided by 1 plus the proportion of bilateral fittings. For example, if there are 1 million hearing aids sold and half of hearing aids are fit bilaterally, then the number of users would be 1 million divided by 1.5, or roughly 667,000 users. The proportion of bilateral fittings varies a lot across countries as well as regions and the data in the literature are sparse and rather uncertain (Arlinger Citation2009). EuroTrak data show that the bilateral fitting percentage rose from 55% to 69% between 2009 and 2015 in three European countries (Bisgaard and Ruf Citation2017). Looking at the data on bilateral fitting percentages in the EuroTrak surveys for 15 countries mostly rated as affluent countries, the bilateral percentage varies from 42% to 86% (EHIMA Citation2020b). The bilateral fitting rates versus GNI/capita for the 15 countries are shown in . There is a positive correlation between bilateral percentage and GNI/capita although the values vary considerably for countries with the same GNI/capita. Bilateral hearing aid fitting for people with bilateral hearing loss is not always beneficial (Arlinger et al. Citation2008). Therefore, there could be a saturation level of bilateral fittings. For many people with severe hearing loss, one hearing aid will give clear benefit over no hearing aid, while adding a second hearing aid will give less added benefit (Noble and Gatehouse Citation2006). In low-income countries, the scarcity of resources could lead to a higher number of unilateral fittings to help as many as possible. These two factors point to a non-linear relationship between bilateral fitting percentage and GNI/capita and therefore a polynomial trendline has been fitted to the data.
Figure 2. Bilateral fitting percentage from EuroTrak surveys plotted against gross national income (GNI) per capita in $. Also shown is a polynomial trendline and its equation.
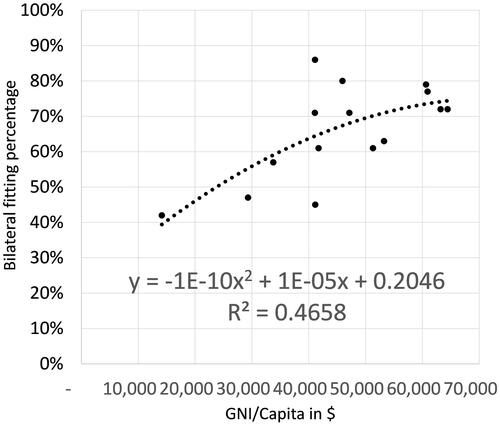
For the high-income countries where data on bilateral fitting percentages are known from EuroTrak data for several countries, the average population-weighted bilateral fitting percentage is 66%. This value will be used for this region that has an average population weighted GNI/capita of $48,707. By inserting the average population weighted GNI/capita for the other regions in the polynomial equation for the trendline, an estimate of the bilateral fitting percentage for each region is calculated. The average population weighted GNI/capita for the regions: Central/Eastern Europe Central Asia, Middle East and North Africa, Sub-Saharan Africa, South Asia, East Asia, South East Asia and Latin America/Caribbean are $8845, $7181, $1515, $1889, $10,028, $3923, and $8635, respectively. The proportions of bilateral fittings are then estimated to be 33%, 30%, 23%, 23%, 34%, 26%, and 32%, respectively. These values can also be seen in . The summed unit sales in each region are then adjusted by the average bilateral percentage to reach an estimate of the total number of hearing aid users in the region.
Table 3. Data and results on hearing instrument coverage for the WHO model with number of people with disabling hearing loss (DHL), important parameters and percentage of people with DHL using hearing instruments, 2018.
The world prevalence of mild, moderate, moderately severe, severe, and profound hearing loss is 14.9%, 3.4%, 1.3%, 0.4%, and 0.2%, respectively (WHO Citation2021) which means that mild hearing loss is almost three times more prevalent than the four other categories together. In countries with high Coverage, it must thus be expected that some people with mild hearing loss also use hearing aids and the total number of users calculated can include users with smaller hearing losses than DHL. Therefore, the Coverage calculated could exceed 100%. This is for instance the case in the UK as explained in the introduction. Since it is the aim to estimate the Coverage only for people with DHL, an adjustment is needed but supporting data for this adjustment are scarce. An analysis of Euro Trak data for the largest European countries shows that 19% of the users had mild hearing loss (EHIMA Citation2020c). In this analysis, the percentage of users with DHL in the European region was set to 80% of the total estimated number of users. The average population weighted GNI/capita for a region is used as an indicator for the percentage of people with hearing aids that have DHL. In countries with low GNI/capita, it is assumed that fewer people with mild losses will have hearing aids. For the regions Central/Eastern Europe Central Asia, Middle East and North Africa, East Asia, and Latin America/Caribbean that have comparable average weighted GNI/Capita values ($8845, $7181, $10,028 and $8635), the percentage of users with DHL was set to 95%. The Sub-Saharan Africa, South Asia and South East Asia regions have average weighted GNI/capita below $3.923 and the DHL percentage is set to 98% for these regions. The Coverage for each region can now be calculated as the number of hearing aid users with DHL in percentage of the total number of people with DHL.
The GBD regions are composed differently from the WHO regions, the main difference being that the countries of the high-income WHO region are distributed according to their geographical affiliation. To calculate the Coverage for the GBD regions, the data set developed for the WHO regions was reorganised to the six GBD regions. It is quite straightforward to do this for the total population, estimates of people with hearing loss, GNI/capita and hearing aid unit sales. For the estimates of bilateral fitting percentages, the values from the WHO regions were assigned to each country or region before the composite value was calculated. It was also necessary to adjust for the degree of hearing loss to align with Orji et al. For a one-to-one comparison to the GBD-based analysis by Orji et al., both users with mild and profound hearing loss should be eliminated from the estimates of the total number of users for each region. Considering all hearing loss severities from moderate to profound, the profound losses account for 3% of the total (Orji et al. Citation2020). In the EuroTrak data, the Coverage for profound losses is 59% (EHIMA 2020c). The number of users is therefore further reduced by 1.8% (59% of 3%) to eliminate the users with profound losses from the analysis.
Results
The analysis was carried out for both the WHO and GBD regions. For all the WHO regions together, 457 million people have some form of DHL and only 44.7 million of them have hearing aids. The global Coverage is thus 10%, equivalent to an unmet need of 90%. However, this average value covers major differences in Coverage between the regions ranging from 1% in Sub-Saharan Africa to 57% in the high-income region. The regions of Central/Eastern Europe Central Asia, Middle East and North Africa, Latin America/Caribbean have Coverage of 10%–12%. The Sub-Saharan Africa, South Asia, East Asia, and South East Asia regions have Coverage between 1% and 5%. The data and parameters including GNI/capita used in the analysis and the results for the WHO regions are shown in . There is a clear linear, positive correlation between Coverage and GNI/Capita with a R2 value of 0.97. For the GBD regions together, the result is that 391 million people have some form of moderate to severe hearing loss and only 42.9 million of them have hearing aids. The global Coverage is 11% or an unmet need of 89%. The differences between the regions are large. Coverage ranges from 2% in the African region to 33% in the European region. The European region and the Americas have the highest Coverage of 33% and 22%, respectively. The Eastern Mediterranean and Western Pacific regions follow with 11% and 7% Coverage. The African and South East Asia regions have the lowest Coverage with 2% and 3%, respectively. In the GBD-based results, there is a linear, positive correlation between the GNI/capita and the Coverage with a R2 value of 0.84. The data and parameters including GNI/capita used in the analysis and the results for the GBD regions are shown in . The number of hearing aid owners in the GBD results is 857,000 less compared to the WHO results. This is because hearing aid owners with profound losses were taken out for the GBD analysis. The results from and can be presented on a world map to give a more visual impression of the differences between the regions in each of the models. Such presentations also visualise the differences between the regional splits in the WHO and GBD models. and show the coverage in the regions for the two models.
Figure 3. Coverage in the eight WHO regions. WHO: World Health Organization.
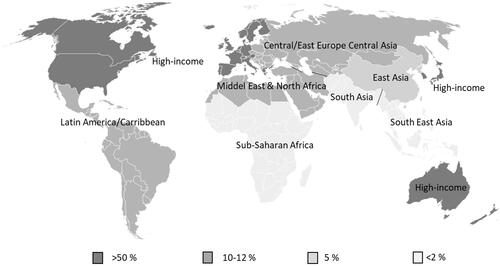
Figure 4. Coverage in the six GBD regions. GBD: global burden of disease.
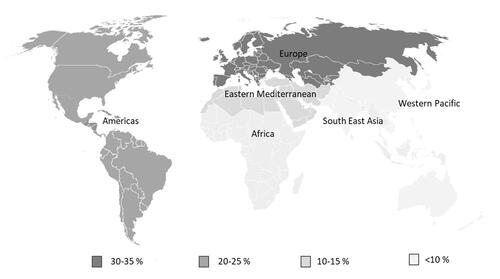
Table 4. Data and results on hearing instrument coverage for the GBD model with number of people with moderate to severe hearing loss (MSHL), important parameters and percentage of people using hearing instruments, 2018.
The results shown in and are based on the estimates of both bilateral percentage and hearing aid lifetime. The level of confidence in these estimates is satisfactory for the high-income countries where multiple data sources are available. For all other countries and regions, the confidence level is lower due to the lack of data sources. The calculations have been carried out for each low-income region in the WHO model with two alternative values of bilateral percentage: the originally estimated value times 2, and the originally estimated value divided by 3 to get a large span from the lowest to the highest value. A different value for the bilateral percentage changes the values for the Coverage but the pattern remains the same; the regions with the lowest income still have the lowest coverage. The results are shown in . In order to show all differences, the values are shown with one decimal point even though the accuracy of these calculations would not merit such apparent accuracy. The influence of the hearing aid lifetime has also been calculated for the Latin America and Caribbean region of the WHO model. The baseline lifetime value for that region is eight years and the coverage is estimate to 9.7%. When the lifetime is set to 10 years, the Coverage goes up to 11.6% and when the lifetime is set to five years, the Coverage drops to 6.6%. Combining the two sources of variation gives an impression of the total range of variation in the hearing aid coverage estimates. In the case of 10 years lifetime and 11% bilateral fitting, the Coverage is estimated to 13.9% and in the other extreme with a 5-year lifetime and 64% bilateral fittings the Coverage comes out as 5.5%. The latter combination is based on parameters very close to those used for the high-income countries where the Coverage is estimated to 57%. The overall volume of hearing aids sold in a region remains the key determinant for the Coverage.
Table 5. Variations in Coverage for the low-income countries of the WHO model depending upon bilateral fitting %.
Discussion
This is the first attempt to use hearing aid sales data to estimate Coverage across the world. The results are calculated for two different models with regions of different compositions and different hearing loss prevalence estimates. No attempt to reassess the prevalence data offered by WHO and GBD has been made. Rather, the focus was on transforming hearing aid sales counted in units to hearing aid users to enable an estimation of Coverage. The overall value for Coverage does not differ much between the two models. For the WHO model, a world-wide Coverage of 10% is found, whereas for the GBD model, a world-wide value of 11% is found. The WHO model estimates 547 million people with hearing loss above 40 dB HL, while the GBD model estimates 391 million people with moderate to severe hearing loss. It is not fully transparent how this difference arises. The threshold for DHL according to WHO is 40 dB HL, whereas the GBD defines the threshold for moderate hearing loss at 35 dB HL. This difference would increase the prevalence by the GBD method but then the people with profound losses or no residual hearing would be excluded which works in the opposite direction. If the 30 million people with profound losses or no residual hearing are added to the GBD number, a total of 431 million is reached which is closer, but still lower, than the WHO numbers. The recent study by Orji et al. estimated that the global Coverage was 17% (Orji et al. Citation2020). The results of the current study suggest considerably lower Coverage. As explained below, this discrepancy is largely due to lower values of Coverage in the poorer regions of the world compared to the results of Orji et al. The WHO regional segmentation isolates the affluent countries in one group, whereas the GBD segmentation is strictly geographical. The WHO-based results expose a major difference between the high-income region where the Coverage reaches 57% and all the other regions where Coverage is below 11%.
There is a strong positive correlation between GNI/capita for the region and the Coverage. This is consistent with the findings of Bright, Wallace, and Kuper (Citation2015). When the high-income countries are integrated in their geographical regions as is the case with the GBD regions, the picture is more blurred but still the Coverage values are higher for the Americas region (22.9%) where USA and Canada pull up the numbers and for the European region (33.5%) where the Western European countries pull up the count. An interesting observation is that the Coverage value for Europe is higher than the Coverage value for the Americas region despite the average GNI/capita values being similar. This is attributed to the fact that many European countries have government programs that support hearing aid acquisition which is not found to the same extent in the Americas region (EFHOH Citation2018). When comparing between the Coverage values for the GBD regions in this study and the values recently published by Orji et al., major differences are found. For the African region, the Coverage in this study is 2.1% versus 10% reported by Orji et al.; for the South East Asia region, the Coverage in this study is also lower at 2.8% versus 16%. For the European region, the difference is in the other direction; Coverage in this study is 33.5% versus 23% in Orji et al. Similarly, for the Americas region, the Coverage in this study is 22.9% versus 17%. The values found by GBD are also used in the 2021 WHO World Report on Hearing.
A key question is if the EHIMA data provide a valid account of the world-wide hearing aid sales. The international hearing aid companies that are members of EHIMA are by a large margin the biggest in the world. Local hearing aid manufacturers that are not members of EHIMA are found in many countries but according to the two leading suppliers of transducers for hearing aids, the unit sales volume not accounted for by the EHIMA members is annually around 1 million hearing aids. Compared to the 16 million sold by the EHIMA companies, this makes up 6% of the total. By not including this volume in the total, we arrive at a conservative estimate of the Coverage and thus overstate the unmet need to some extent. The largest non-EHIMA hearing aid manufacturers are found in USA, Japan, and China. According to industry sources more than 0.5 mill hearing aids or equivalent devices are sold annually in the USA by non-EHIMA companies. Unfortunately, no associations where non-EHIMA manufacturers could aggregate and publish their combined unit sales exist and for competitive reasons none of them would be inclined to publish individual data. There is also not any systematic information about where these manufacturers sell their products but there are no indications that these companies sell large volumes in the low-income regions. The effect of this missing unit volume is thus likely an underestimation of the Coverage in the high-income region and to some extent in the East Asia and Western Pacific regions.
Another additional unit volume not accounted for could be sales of second-hand hearing aids and the dissemination of hearing aids by charitable organisations. No information on second-hand hearing sales can be found but such devices are advertised in many countries. Charities are known to offer hearing aids in many low-income countries. In some case, these devices are new and would thus be included in the unit sales numbers. In other cases, refurbished, used hearing aids are offered. An example of this is the Starkey Hearing Foundation, a large-scale charity fitting hearing aids across the world in low-income countries. An inspection of the information on the Starkey Hearing Foundation website, www.starkeyhearingfoundation.org, indicates that the annual volume of hearing aids fitted is 30–40,000 units. None of the other charitable organisations offer any data on the number of hearing aids fitted. The annual unit volume by the EHIMA companies in the three poorest WHO regions: Sub-Saharan Africa, South Asia and South East Asia amounts to around 640,000. The volume distributed by charity could amount to somewhere between 5% and 10% of the total in these regions and implies that the EHIMA unit-based estimates are underestimating the Coverage. If the 1 million units from non-EHIMA manufacturers and 40,000 units from charity are added, and 500,000 second-hand units also are included, the total number of units in 2018 would grow from 16 million to 17.54 million or about 10%. With all other parameters equal, this would lead to a world Coverage of 12% in the GBD model which is still lower than the 13% reported by Orji and promoted by the WHO.
The very polarised picture between the affluent countries and the rest as reflected in the unit sales differences between the regions in the EHIMA data of seems to be driven by the economic conditions. The overall growth in the ten-year period has been driven by every region except South America. No other comprehensive sources to confirm the EHIMA numbers can be found but as mentioned above the wholesalers’ organisations collect data on the unit sales in many countries. Some of these countries that have government subsidy systems for hearing aids publish data on the number of hearing aids provided. EHIMA has access to these sources and no contradictions have been found.
Conclusions
We conclude that historical data on hearing aid sales can be used to estimate Coverage in various regions of the world as defined by either WHO or GBD. The overall values found are 10–11% of Coverage depending on the prevalence model. There is a low Coverage of 1% to 12% in large parts of the world. In the group of high-income countries as defined by WHO, the situation is very different with a coverage of 57%. There are some limitations to the estimation model as some parameters are estimated due to lack of verified information and findings of the present study may be an underrepresentation of true hearing aid Coverage for several reasons. Firstly, the lack of published information about hearing aid use in low-income regions could result in a variation in reported hearing aid Coverage by up to 40%, in the most extreme cases. More research in low-income countries into prevalence of hearing loss, bilateral fitting percentage and hearing aid lifetime could help to eliminate some of the uncertainties of the estimation process. Also, EHIMA unit numbers are lower than the true world total as smaller hearing aid suppliers are not members. Finally, accurate figures of second-hand hearing aid sales and distribution of donated hearing aids by charitable organisations are unknown. Even though the EHIMA data have some shortcomings, EHIMA is urged to continue to collect and make available such data in a consistent manner to enable calculation of Coverage in years to come. Data on the number of hearing aids sold by non-EHIMA members as well as those fitted by charitable organisations would be helpful in getting to a more complete worldwide data set on hearing aids provided.
Even though Coverage in high-income countries indicates that far from all who are in need are well-served, our model illustrates a chasm in Coverage compared to low-income regions. Highlighting these differences provides an insight into the unmet needs in different countries and such information is vital when developing public health strategies to meet those needs. In a comprehensive study of the situation in Malawi, it was found that availability of facilities, professionals, and hearing aids is a critical requirement for improving services and Coverage but other factors like self-perception of hearing problems and reluctance to seek help also plays against increased Coverage (Parmar et al. Citation2021). Along the same lines, the WHO World Report on Hearing 2021 provides a very comprehensive set of recommendations on how to create progress in countries with low Coverage. The report mentions the importance of building capacity to improve the availability of ENT doctors, audiologists, speech therapists and teachers of the deaf but also that the density of such professionals in the countries with low Coverage is low, and likely related to the income levels of these countries. The vast differences in Coverage revealed by our model highly support that there are different underlying barriers to hearing healthcare and thus also different strategies required to pave the way for improvements.
Disclosure statement
No potential conflict of interest was reported by the author(s).
References
- Agrawal, Y., E. Platz, and J. Niparko. 2008. “Prevalence of Hearing Loss and Differences by Demographic Characteristics among US adults: Data from the National Health and Nutrition Examination Survey, 1999-2004.” Archives of Internal Medicine 168 (14): 1522–1530. doi:10.1001/archinte.168.14.1522.
- Arlinger, S. 2009. “A Survey of Public Health Policy on Bilateral Fittings and Comparison with Market Trends: The Evidence-Base Required to Frame Policy.” International Journal of Audiology.” 45 (Suppl 1): S45–S48. doi:10.1080/14992020600782659.
- Arlinger, S., Gatehouse, S., Kiessling, J., Naylor, G., Verschuure, H., and Wouters, J. 2008. “The Design of a Project to Assess Bilateral Versus Unilateral Hearing Aid Fitting.” Trends in Amplification 12 (2): 137–144. doi:10.1177/1084713808316171.
- Bainbridge, K., and V. Ramachandran. 2014. “Hearing Aid Use Among Older U.S. Adults; The National Health and Nutrition Examination Survey, 2005-2006 and 2009-2010.” Ear and Hearing 35 (3): 289–294. doi:10.1097/01.aud.0000441036.40169.29.
- Bisgaard, N., and S. Ruf. 2017. “Findings from EuroTrak Surveys from 2009 to 2015: Hearing Loss Prevalence, Hearing Aid Adoption, and Benefits of Hearing Aid Use.” American Journal of Audiology 26 (3S): 451–461. doi:10.1044/2017_AJA-16-0135.
- Bright, T., S. Wallace, and H. Kuper. 2018. “A Systematic Review of Access to Rehabilitation for People with Disabilities in Low- and Middle-Income Countries.” International Journal of Environmental Research and Public Health 15: 2165. doi:10.3390/ijerph15102165.
- Dalton, D. S., K. J. Cruickshanks, B. E. K. Klein, R. Klein, T. L. Wiley, and D. M. Nondahl. 2003. “The Impact of Hearing Loss on Quality of Life in Older Adults.” The Gerontologist 43 (5): 661–668. doi:10.1093/geront/43.5.661.
- EFHOH. 2018. “State of provision of Hearing Aids in Europe”. An EFHOH report. Accessed August 2 2021. https://www.efhoh.org/wp-content/uploads/2018/08/State-of-Hearing-Aids-Provision-in-Europe-2018.pdf
- EHIMA (European Hearing Instrument Manufacturers Association). 2020a. Hearing aid sales. Accessed August 2 2021. https://www.ehima.com/about-ehima/hearing-aid-sales/
- EHIMA (European Hearing Instrument Manufacturers Association). 2020b. Surveys. Accessed August 2 2021. https://www.ehima.com/surveys/
- EHIMA (European Hearing Instrument Manufacturers Association). 2020c. EuroTrak trends 2009 – 2020. An EHIMA report. Accessed August 2 2021. https://www.ehima.com/wp-content/uploads/2020/07/EuroTrak-Trends-2009-2020-June-2020.pdf
- Ferguson, M. A., A. Woolley, and K. J. Munro. 2016. “The Impact of Self- Efficacy, Expectations, and Readiness on Hearing Aid Outcomes.” International Journal of Audiology 55 (3): S34–S41. doi:10.1080/14992027.2016.1177214.
- Global Burden of Disease [GBD] 2018. “Global, Regional, and National Incidence, Prevalence, and Years Lived with Disability for 354 Diseases and Injuries for 195 Countries and Territories, 1990–2017: A Systematic Analysis for the Global Burden of Disease Study 2017.” Global Health Metrics 392 (10159): 1789–1858. doi:10.1016/S0140-6736(18)32279-7.
- Graydon, K., C. Waterworth, H. Miller, and H. Gunasekera. 2019. “Global Burden of Hearing Impairment and Ear Disease.” The Journal of Laryngology and Otology 133 (1): 18–25. doi:10.1017/S0022215118001275.
- Index Mundi. 2020. “Demographics”. Accessed August 2 2021. https://www.indexmundi.com/factbook/fields/population
- Lin, F. R. 2011. “Hearing Loss and Cognition among Older Adults in the United States.” The Journals of Gerontology. Series A, Biological Sciences and Medical Sciences 66 (10): 1131–1136. doi:10.1093/gerona/glr115.
- McPherson, B. 2018. “Hearing Aid Systems in Low-Resource Settings.” Community Ear & Hearing Health 15 (19): 1–2.
- Noble, W., and S. Gatehouse. 2006. “Effects of Bilateral versus Unilateral Hearing Aid Fitting on Abilities Measured by the Speech, Spatial, and Qualities of Hearing Scale (SSQ).” International Journal of Audiology 45 (3): 172–181. doi:10.1080/14992020500376933.
- Olusanya, B., A. Davis, and H. Hoffman. 2019. “Hearing Loss Grades and the International Classification of Functioning, Disability and Health.” Bulletin of the World Health Organization 97 (10): 725–728. doi:10.2471/BLT.19.230367.
- Orji, A., K. Kamenov, M. Dirac, A. Davis, S. Chadha, and T. Vos. 2020. “Global and Regional Needs, Unmet Needs and Access to Hearing Aids.” International Journal of Audiology 59 (3): 166–172. doi:10.1080/14992027.2020.1721577.
- Parmar, B., M. Phiri, C. Caron, T. Bright, and W. Mulwafu. 2021. “Development of a Public Audiology Service in Southern Malawi: Profile of Patients Across Two Years.” International Journal of Audiology 12:1-8. doi:10.1080/14992027.2020.1864486.
- Tambs, K. 2004. “Moderate Effects of Hearing Loss on Mental Health and Subjective Well-Being: Results from the Nord-Trøndelag Hearing Loss Study.” Psychosomatic Medicine 66 (5): 776–782. doi:10.1097/01.psy.0000133328.03596.fb
- World Bank. 2020. “GNI per capita, Atlas method (current US$).” Accessed August 2 2021. https://data.worldbank.org/indicator/NY.GNP.PCAP.CD
- World Health Organization. 2012. “Multi-country survey study on health and responsiveness (MCSS).” Accessed August 2 2021. https://apps.who.int/healthinfo/systems/surveydata/index.php/catalog/mcss
- World Health Organization. 2018. "Addressing the rising prevalence of hearing loss.” Accessed August 2 2021. https://apps.who.int/iris/handle/10665/260336.
- World Health Organization. 2021. “World report on hearing.” Accessed August 2 2021. https://www.who.int/publications/i/item/world-report-on-hearing