
Abstract
Objective
The Earlens is a direct-drive hearing device consisting of a lens which physically displaces the umbo to achieve appropriate gain. The objective is to determine the clinical acceptability of clinical immittance measurements in Earlens wearers.
Design
Controlled before-after within-subjects repeated measures study.
Study sample
Data is reported for measurements obtained on 15 subjects (average age of 72.2 years) with data from 30 ears.
Results
There was a small effect of lens placement on sound field thresholds in most subjects. The largest damping effect of 4 dB was observed at 1000 Hz. An average reduction of 0.17 mL was identified in compliance following lens placement (p < 0.05). An effect of the lens on power absorbance obtained at ambient and peak pressure was found. The lens resulted in an increase in power absorbance at low frequencies (below 500 Hz) and a decrease in the mid to high-frequency range of approximately 500–3500 Hz (p < 0.05).
Conclusions
Lens wear had a small effect on audiometric thresholds and tympanometry for most patients. Clinicians who use compliance and power absorbance should take into consideration lens effects on these measurements. Additional work is required to develop clinical normative ranges of these measures for wearers of the Earlens.
Introduction
The Earlens (Earlens Corporation, Menlo Park, CA the United States) system is a direct-drive hearing aid that functions by processing sound via a behind-the-ear (BTE) hearing aid processor and converting the acoustic signal into an amplified non-acoustic signal that is emitted from an Ear Tip. This emitted signal is then received by a sensor integrated into a custom-manufactured “lens” that resides deep in the external auditory canal and on the eardrum. The lens converts the received signal into physical movement and directly displaces the ossicles via contact with the umbo of the malleus on the surface of the tympanic membrane. This point of contact permits transmission of the amplified signal directly into the ossicular chain. This direct drive approach can be contrasted with traditional methods of amplification which produce amplified vibrations of the air within the ear canal which are subsequently converted by the tympanic membrane to vibrations of the ossicular chain. The benefits of a direct-drive physical displacement system rather than an acoustic-driven system include the ability to reduce the potential of acoustic feedback as well as increasing the audible bandwidth of amplification (Fay et al. Citation2013; Gantz et al. Citation2017). The perceptual effects of the audible bandwidth associated with the Earlens system have recently been reported (Vaisberg et al. Citation2021). There have been three different designs of the Earlens over the history of the company that has used different signal transmission modalities to transfer the non-acoustic signal between the Ear Tip and the lens to directly vibrate the umbo: magnetic, photonic, and the currently marketed inductive. Although slightly different in terms of form-factor and amount of mass and platform contact onto the eardrum itself, the fundamental concept of sound transduction by using the direct drive and placing a device in direct contact with the surface of the tympanic membrane to vibrate the umbo is common across all three designs. In all designs, long term lens wear is facilitated by a regimen of daily to the weekly application of mineral oil to the ear canal in order to help to migrate ear canal epithelium pass easily under the lens, keeping it in registration with the umbo for long periods of time without requiring surgery or attaching the device permanently or semi-permanently to any structure.
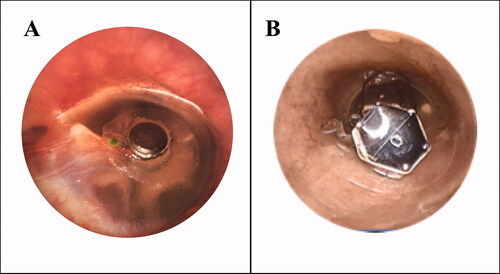
Since the lens makes direct contact with the umbo of the tympanic membrane, the Earlens has been demonstrated to result in a mildly increased air-conduction threshold on unaided hearing thresholds (Fay et al. Citation2013; Perkins et al. Citation2010; Perkins Citation1996; Puria, Maria, and Perkins Citation2016). This effect on hearing thresholds is typically measured as the change in unaided air-conduction hearing thresholds obtained with the lens in place relative to thresholds obtained prior to lens placement (Fay et al. Citation2013; Perkins et al. Citation2010). This effect might be less apparent when the BTE is in use due to the potential amplification provided by the device. The original design of the Earlens, the magnetic version, was similar in design to a contact lens for the eye with the addition of a 35 mg mass (a gold-plated magnet) over the umbo, and the entire mass of this design was borne by the tympanic membrane, see . The mean increase in the threshold of this original lens design was reported in seven subjects with a mean threshold shift upwards of 10 dB between a frequency range of 1000–4000 Hz (Perkins Citation1996). A later version of the electromagnetic lens with a mass of 9 mg demonstrated mean threshold increases close to 0 dB for low frequency (125–1500 Hz) and high frequencies (8000-12500 Hz), with peak attenuation of approximately 8 dB around 3000 Hz (Perkins et al. Citation2010), representing a narrower bandwidth of threshold changes compared to the original version – likely due to the reduction in mass. While the magnetic version is shown in is a simpler design to understand in terms of adding additional mass to the middle ear system, the later photonic design, , is a more complex version to understand in terms of how it might interact with the middle ear system, and the learnings from the original magnetic system may or may not be relevant in terms of threshold change effects. A newer version of the Earlens, the photonic (light-driven) version shown in , demonstrated a slightly different threshold change profile likely due to the different design – in this version of the lens the bulk of the mass is carried by the stabilising platform which contacts the medial end of the bony canal wall adjacent to the tympanic membrane, the platform supports a chassis which spans the tympanic membrane and provides a foundation for support of the actuator several hundred microns above the surface of the tympanic membrane via springs intended to maintain a minimal positive bias of the smaller, umbo platform against the umbo of the malleus, while also allowing for large displacements such as those encountered in a Valsalva or Toynbee manoeuvre. The actual mass of the photonic lens is approximately 135 mg but because the bulk of this mass is suspended above the surface of the tympanic membrane, the “effective” mass loading the umbo is equivalent to the effect of a 15 mg mass (measured at 1000 Hz). Threshold changes due to the newer lens design had a peak attenuation at 1000 Hz of approximately 7 dB averaged across a sample of 26 ears (Fay et al. Citation2013). Individual differences in severity of threshold changes were observed, with a standard deviation (SD) across patients of approximately 5 dB (Fay et al. Citation2013). One analysis of damping responses in four temporal bones also examined individual responses, with peak response frequencies and magnitudes showing significant variability above approximately 4000 Hz (Puria, Maria, and Perkins Citation2016). Given these previous reports of increases of air-conduction thresholds due to the placement of the lens, it is hypothesised that the changes in air-conduction thresholds are caused by the additional tympanic membrane mass loading induced by the presence of the lens (Perkins et al. Citation2010) and/or fluid loading by the application of oil.
Figure 1. (A) Example of the original lens of the Earlens system which had a small mass on the platform that contacted the tympanic membrane (TM), and the full mass was borne by the TM. (B) Example of the newer photonic lens of the Earlens system where the majority of the mass of the lens is stabilised by a supporting platform which resides at the medial end of the bony canal, and only a small portion comes into contact with the TM the umbo (not visible, the TM contacting platform is underneath the motor that is suspended across the TM).
Tympanometric damping has been measured with audiometric thresholds taken with and without the lens in place in human studies (Fay et al. Citation2013; Perkins et al. Citation2010; Perkins Citation1996) and with measures of stapes velocity in temporal bone studies (Puria, Maria, and Perkins Citation2016). These measures assess the relative efficiency of sound energy transfer into the middle ear as a function of ear canal pressure. However, clinical measures of tympanometric immittance may also be feasible for use in assessing these effects. Tympanometry is a routine clinical tool for the evaluation of tympanic membrane mobility and the tympanometric peak pressure (TPP) where energy transfer is most efficient, relative to well-established clinical norms. These measures, in conjunction with audiometric thresholds, allow clinicians to determine whether the middle ear system of a patient is functioning adequately and whether any inefficiencies in the system are contributing to the overall hearing loss of the patient. Recently, the use of wideband acoustic immittance (WAI) has been recommended to test the integrity of the middle ear system (Shahnaz, Feeney, and Schairer Citation2013; Feeney and Sanford Citation2004; Sanford, Schooling, and Frymark Citation2012). WAI is an umbrella term referring to the use of a broadband signal for the measurement of immittance rather than traditional tympanometry, which uses a single frequency probe tone. Power absorbance is one measurement of WAI which measures the proportion of acoustic energy that is absorbed by the middle ear system as the test frequency is varied across a broad frequency range (Rosowski, Stenfelt, and Lilly Citation2013). Power absorbance is typically scaled between 0 (no acoustic energy absorbed) and 1 (all acoustic energy absorbed) and is generally measured across a frequency range of 200–8000 Hz. Power absorbance has been described as a useful clinical tool in the identification and differential diagnosis of middle ear disorders, including otosclerosis, superior canal dehiscence, ossicular discontinuity and/or middle ear effusion as these disorders evoke specific absorbance patterns related to changes in tympanic mass loading and stiffness characteristics (Sanford, Schooling, and Frymark Citation2012; Nakajima et al. Citation2012; Shahnaz, Bork, et al. Citation2009; Merchant et al. Citation2016). The characteristics of tympanometry and power absorbance in Earlens wearers are unknown. Given the increased interest in the routine use of WAI by clinicians for diagnostic purposes, characterisation of typical responses as well as reliability of WAI measurements with the lens in place is of clinical interest.
Since the lens of the Earlens is intended to stay in place for up to several years, the primary objective of this study was to investigate the effect of the lens on audiometric thresholds as well as tympanometric and WAI measures. A secondary objective was to understand the effects of lens placement on clinical measurements of middle ear status to determine whether norms derived from ears without lenses are applicable to patients wearing the Earlens system. It was hypothesised that the addition of the lens to the tympanic membrane may result in different response patterns on clinical tympanometric/immittance measures due to the sensitivity of these tests to changes in the mass of the middle ear system.
Materials and methods
Subjects
This study was approved by the Western University Human Research Ethics Board (109433) and Lawson Health Research Institute (R-18-057). Fifteen subjects, representing 30 ears, were included in the study, comprised of 7 females and 8 males with an age range of 66–86 years (mean 72.2 years, SD 5.3 years). All subjects met the indications for use and had a sensorineural hearing loss with no history of rapidly progressive or fluctuating hearing impairment. Pure tone audiometric thresholds were obtained using a GSI 61 audiometer calibrated according to ANSI standards (re: S3.6.2010) while using ER3 (Etymotic Research, Illinois, United States) insert phones for thresholds up to 8000 Hz and HDA300 circumaural headphones (Sennheiser, Wedeark, Germany) for 9000–10,000 Hz.
Inclusion criteria for this study were: an intact eardrum with no perforations, inflammations, dimeric or monomeric areas; no middle or outer ear pathology; and, an ear canal free of exostoses with sufficient space and shape to fit the lens. Exclusion criteria included past radiation of the head or neck. All subjects were assessed for inclusion by the study otolaryngologist prior to the impression of the lens being taken.
Measurement methods
Sound field audiometric thresholds were obtained using the same audiometer that was used for initial audiometry, in order to measure unaided thresholds with and without the lens present on the tympanic membrane. Sound field thresholds, rather than headphone-based thresholds, were used in this study because the functional gain was also measured as part of the overall protocol presented in the accompanying studies (Vaisberg et al. Citation2021). The output limits of the audiometer tend to be lower when using sound field thresholds compared to headphone thresholds. Warble tones were presented from a loudspeaker placed 1.8 metres from the subject, at 0-degree azimuth. Thresholds were obtained at audiometric frequencies of 125, 250, 500, 1000, 2000, 3000, 4000, 6000, 8000, 9000 and 10,000 Hz. Thresholds were obtained prior to lens placement, representing the baseline measurement, and again following lens placement with an average time between measurements of 28.4 weeks (SD 12.2 weeks). Post-lens placement measurements were obtained several weeks following lens placement (mean time 5.7 weeks, SD 4.5 weeks) because mineral oil is used by the otolaryngologist as part of the lens fitting procedure, making the day of placement a poor time to gather these measurements as excessive oil on the eardrum can serve to impact the hearing of the listener. As mineral oil is applied regularly to the lens, participants were instructed not to use oil in their ears the night before or the day of the follow-up, and otoscopy was completed at every appointment to identify the accumulation of excess oil.
For the present study, tympanometric and WAI measurements were conducted for each subject, with one subject excluded due to the inability to obtain a hermetic seal bilaterally. The tympanometric and WAI measurements were acquired at two-time points; pre- and post-lens placement, with an average time between measurements of 20.5 weeks (SD 9.7 weeks). Post-lens measurements have obtained an average of 7.2 weeks (SD 4.1 weeks) after the lens was in place. At each session, tympanometry and WAI measurements were made twice per ear (repetitions 1 and 2) with the probe re-inserted between repetitions.
Tympanometry and WAI measurements were conducted using the Interacoustics Titan system (version 3.3.0). Using a 226 Hz probe tone, the ear canal volume (ECV), tympanometry peak pressure (TPP), and eardrum compliance (Ytm) were gathered. Power absorbance was measured using the 3D tympanometry measurement of the Titan and extracted at ambient pressure as well as peak pressure. Two repetitions of each measure were conducted on each ear at each time point (pre- and post-lens placement) to reduce the potential for a single trial impacting the data. The two repetitions were averaged, and the population means of each measurement for each condition were calculated by averaging power absorbance values of all subjects. Test-retest reliability of power absorbance was then measured by calculating the absolute difference in power absorbance between Trial 1 and Trial 2 in both the pre- and post- lens condition across the entire power absorbance bandwidth of 226–8000 Hz.
Statistical analysis
Audiometric thresholds
The difference between thresholds obtained with the lens in place and thresholds obtained at baseline prior to lens placement. A positive value represents a decline in hearing sensitivity (increase in threshold) due to lens placement. In the case where a threshold could not be obtained due to reaching the limits of the audiometer in either the pre- or post-lens condition, the threshold for the subject at that frequency was removed.
Tympanometric measures
In order to compare pre- and post-lens tympanometric measures, a repeated measure multivariate analysis of variance (RMMANOVA) was conducted with ear canal volume, tympanometric peak pressure, and compliance treated as dependent variables, while condition (pre versus post) was treated as the within-subject factor and ear (left versus right) was treated as a between-subject factor. When appropriate, post hoc analysis using Bonferroni correction and a criterion of p < 0.05 was used to investigate the significance of the pairwise comparisons.
Power absorbance
To measure the test-retest reliability of power absorbance measurements in both the pre- and post-lens conditions, the mean absolute difference in power absorbance between Trial 1 and Trial was calculated for all subjects. Comparison of power absorbance measurements pre- and post-lens placement was conducted using a repeated-measures analysis of variance (RMANOVA). Prior to analysis, average power absorbance measurements pre- and post- lens placement were averaged into one-third octave bands. The RMANOVA was completed with the ear (2 levels) as a between-subject factor, while one-third octave band frequency (16 levels) and condition (2 levels) were used as a repeated measure. This analysis was carried out separately for power absorbance at ambient and power absorbance at peak pressure to determine the effects of lens placement on power absorbance in both of these conditions. Degrees of freedom were adjusted for lack of sphericity using the Greenhouse-Geisser epsilon (Max and Onghena Citation1999). Post hoc contrasts were also performed to locate pairwise differences and corrected using the Bonferonni method.
Results
Audiometric measurements
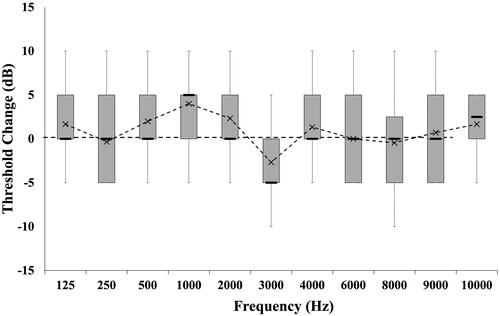
All subjects had measurable pre- and post- lens thresholds for frequencies up to and including 6000 Hz. At 8000 Hz, one subject had a threshold above the limit of the audiometer in the pre-condition, while an additional three subjects had thresholds above the limits of the audiometer following lens placement. These three subjects had increased thresholds at 8000 Hz of at least one audiometric step size of 5 dB, however, their thresholds were removed from the mean since threshold changes could not be accurately measured. For 9000 Hz thresholds, seven subjects reached the limits of the audiometer in the pre-lens condition and therefore were removed from the calculation. Nine subjects reached the limits of the audiometer at 10,000 Hz, eight of whom reached the limits of the audiometer in the pre-lens condition. The other subject had threshold changes of at least one step size, but an accurate calculation could not be obtained at this frequency, and therefore their thresholds were removed from the calculation. For the remaining data, mean changes to threshold due to lens placement ranged from −2.7 to 4 dB per frequency, with the greatest increase occurring at 1000 Hz and an improvement of hearing thresholds, occurring at 3000 Hz (). Averaged across all frequencies and patients, mean changes were 0.9 dB (SD 4.98 dB). Individual responses were within one audiometric step size for all test frequencies in at least 12 of the 15 subjects per frequency, or 88.9% of data points. The largest individual deviations were within two audiometric step sizes, and when changes occurred, they were indicative of increased thresholds in 9.8% of data points, with improved thresholds in 1.2% of data points.
Figure 2. Box and whisker plot diagram of threshold changes in sound field audiometric thresholds due to lens placement for 15 subjects. Mean values reported as ‘x’, with minimum, maximum and inter-quartile regions reported in box and whisker. Positive values indicate an increase in threshold (i.e. decline in hearing) following lens placement.
Tympanometric measurements
Mean pre- versus post-tympanometric measurements of compliance, ear canal volume and tympanometric peak pressure are reported in . Results of the RMMANOVA investigating the changes of tympanometric measurements due to lens placement suggest that there is a significant effect of condition [F (3, 24) = 5.616, p = 0.005, Wilk’s Λ = 0.588, partial ŋ2 = 0.412]. Post-hoc analysis suggests that there was a significant reduction in compliance due to lens placement (p = 0.002). Mean compliance prior to lens placement was 1.07 mL (SD 0.78 mL), which was within normal limits of 0.2-1.5 mL (Wiley et al. Citation1996). This compared to a mean compliance post-lens placement of 0.90 mL (SD 0.65 mL), representing an average decrease in compliance of 0.17 mL following lens placement. A reduction in compliance occurred in 25 of 28 ears tested. There were no significant changes detected in either ear canal volume or tympanometric peak pressure due to lens placement (p > 0.05).
Table 1. Mean pre- and post-placement tympanometric measurement values.
WAI measurements
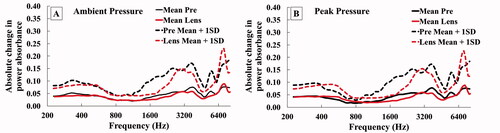
The test-retest reliability of power absorbance in the pre- and post-lens conditions at ambient pressure is reported in . Mean absolute difference in power absorbance between Trial 1 and Trial 2 were below 0.09 for both the pre- and post-lens condition. There is the greatest mean difference and variation between trials in the highest frequencies around 7300 Hz. The mean absolute difference of power absorbance in the pre- and post-lens conditions at peak pressure is reported in . The mean absolute difference in power absorbance at peak pressure was measured below 0.09 in both conditions. The mean absolute difference in power absorbance reached a local maximum in the pre-lens condition around 3700 Hz, while the mean absolute difference in power absorbance in the post-lens condition reached a local maximum around 7300 Hz.
Figure 3. (A) Mean absolute difference in power absorbance between Trial 1 and Trial 2 (+1 SD) for both the pre- and lens- condition measured at ambient pressure. (B) Mean absolute difference in power absorbance between Trial 1 and Trial 2 (+1 SD) for both the pre- and lens- condition measured at peak pressure.
Mean power absorbance measurements at ambient pressure (pre-placement) are reported in . The change in power absorbance measurements pre- versus post-placement was calculated by subtracting the post-lens power absorbance from the pre-placement power absorbance measurement. The results of the RMANOVA in the ambient pressure condition revealed a significant and large main effect for measurement frequency [F(3.518, 91.475) = 39.934, p < 0.001, partial ŋ2 = 0.606] as well as an interaction between lens condition and frequency [F(3.982, 103.54) = 4.113, p = 0.004, partial ŋ2 = 0.137]. Post hoc contrasts revealed that at ambient pressure, the placement of the lens resulted in a significant increase in power absorbance at one-third octave bands of 315 and 400 Hz, and a significant decrease in power absorbance at one-third octave bands of 2000 and 3150 Hz (). The change in power absorbance at ambient pressure reached a local minimum value of −0.080 at 343 Hz, rising to 0.084 at 3564 Hz before dropping to −0.105 at 6536 Hz (). In summary, power absorbance changes in the ambient pressure condition revealed a mean increase in absorbance when the lens was in place below 545 Hz and above 5187 Hz. A representative tracing of changes in power absorbance at ambient pressure due to lens placement is reported for subject 50,035 in for both the right and left ear.
Figure 4. (A) Mean (± 1 SD) power absorbance measured at ambient pressure pre- (Pre) and post-placement (Lens) averaged into one-third octave bands with significant differences in power absorbance denoted by asterisk (*). (B) Mean change in absorbance at ambient pressure due to lens placement at ambient pressure and the 10th and 90th percentiles. (C) Representative power absorbance measurements obtained for subject 50035 pre (solid line) and post-lens fitting (dashed line) for both ears at ambient pressure. (D) Mean (± 1 SD) power absorbance measured at peak pressure pre- (Pre) and post-placement (Lens) averaged into one-third octave bands with significant differences in power absorbance denoted by asterisk (*). (E). Mean change in absorbance at peak pressure due to lens placement at ambient pressure and the 10th and 90th percentiles. (F) Representative power absorbance measurements obtained for subject 50035 pre (solid line) and post-lens fitting (dashed line) for both ears at peak pressure.
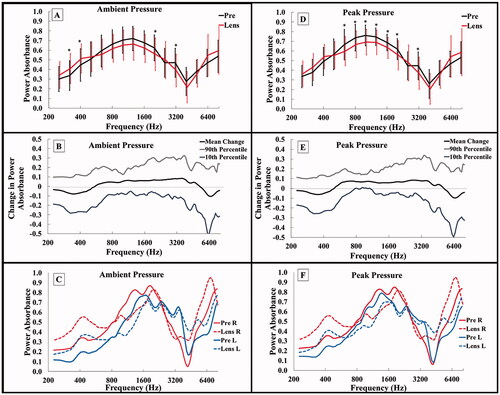
Mean power absorbance measurements following lens placement were also measured at peak pressure (). The results of the RMANOVA in the peak pressure condition revealed a significant main effect of measurement frequency [F(3.679, 95.642) = 54.325, p < 0.001, partial ŋ2 = 0.676], as well as an interaction between lens condition and frequency [F(3.779, 98.246) = 4.391, p = 0.003, partial ŋ2 = 0.144]. Post hoc contrasts revealed that at peak pressure, the placement of the lens resulted in a significant decrease in power absorbance at one-third octave bands between 630 and 2000 Hz and the one-third octave band of 3150 Hz (). The changes in power absorbance at peak pressure were similar to those at ambient pressure. Specifically, mean power absorbance change reached a local minimum value of −0.063 at 364 Hz, rising to 0.070 at 3564 Hz before dropping to −0.098 at 6536 Hz (). Mean changes in the peak pressure condition revealed an increase in absorbance values when the lens was in place in the low frequencies (below 408 Hz) and a decrease in power absorbance when the lens was in place in the mid frequencies (between 561 and 3563 Hz). A representative tracing of changes in power absorbance at peak pressure due to lens placement is reported for subject 50,035 in for both the right and left ear.
Discussion
The primary objective of the present study was to evaluate the effects of the current Earlens lens design on unaided sound field thresholds, and findings confirm that there is a slight effect from the lens predominantly in the mid-frequency range of 500–2000 Hz. The maximum mean threshold change was 4 dB at 1000 Hz and was within one audiometric step size for about 88% of tested thresholds. The mean threshold change was similar in nature but slightly lower than the results that were previously reported on the photonic design, where a maximum shift of 7 dB occurred at 1000 Hz (Fay et al. Citation2013). Threshold shift results in the present study were also lower than those reported in a previous study using temporal bones to measure tympanic membrane damping of the lens, whereby a maximum mean damping effect of approximately 10 dB was reported around 1000 Hz (Puria, Maria, and Perkins Citation2016). There was large individual variation in threshold changes measured via audiometric thresholds in the present study, which was also reported in previous studies of lens wearers (Fay et al. Citation2013) and temporal bones (Puria, Maria, and Perkins Citation2016). Further investigation of the individual differences in threshold changes is needed, and further investigation on how to customise or shift the changes to frequencies that may be more beneficial is needed either as a system or on an individual basis.
A secondary objective of this study was to determine if tympanometric and WAI clinical norms may be applied to patients wearing the Earlens system. Because of this, it was not possible to compute an a priori sample size or compare effect sizes from previous data (Thompson Citation2007). Our results revealed statistically significant effects on both standard tympanometric measurements and wideband absorbance measures of middle ear status, suggesting that our limited sample size of 15 participants (30 ears) provided a sufficiently large sample to observe the effects of lens placement on middle ear measurement. This sample size is also in line with those of previously published studies on middle ear absorbance for clinical samples of populations of interest (Abur, Horton, and Voss Citation2014; Vander Werff, Prieve, and Georgantas Citation2007; Keefe et al. Citation2017).
This is the first study to investigate changes in immittance tests for wearers of the Earlens system. Our findings suggest that standard 226 Hz tympanometry can be conducted by clinicians as part of their clinical test battery without the need to modify test procedures or test interpretation. No significant changes were observed in tympanometric peak pressure or ear canal volume measures, however, there was a mean reduction of compliance of 0.17 mL observed in 89% of ears tested following lens placement, suggesting the change in middle ear compliance is likely due to the antiresonance of the bias-force lens (Puria, Maria, and Perkins Citation2016). This reduction, although present, was not sufficiently large to move the responses outside of the normal range for older adults (Wiley et al. Citation1996). Clinicians should still be aware of a possible reduction in compliance values when a patient has the lens in place, particularly if a patient’s compliance value is near the cut-off criteria of the normal range. Measurement of both threshold changes and tympanometry is recommended at the 2 week or 30-day post-lens placement follow-up visit. This timing permits the dissipation of oil and establishes an individualised baseline result to which subsequent audiological examinations may be compared. However, wearers of the lens system are instructed to routinely apply mineral oil throughout their lens wear. Future work should focus on the fluid effects of oiling on power absorbance measurements. Additional work should investigate the possibility of decreased compliance values due to lens placement, as well as the sensitivity and specificity of tympanometric assessment in Earlens users who develop middle ear disorders during device use, which is a contraindication for use of the device.
The transmission of sound through the middle ear system is governed by the complex balance of acoustics, mass and stiffness, where mass allows for low-frequency sound transmission and stiffness allows for high-frequency transmission (Kim and Koo Citation2015). It was hypothesised that the placement of the lens would result in an increase in effective mass on the tympanic membrane and alter the sound transmission within the ear canal and through to the middle ear. The power absorbance measurement is known to be sensitive to increases in mass and stiffness (Nakajima et al. Citation2012; Rosowski and Wilber Citation2015), as well as to physical properties of the residual ear-canal space, which can result in changes to amplitude and phase of the measured acoustic stimuli (Rosowski, Stenfelt, and Lilly Citation2013). Because of this, power absorbance may be more sensitive to changes associated with lens wear. The results presented in this study suggest that there was a significant effect of lens placement on power absorbance measurements obtained at both ambient and peak pressure. A broader range of frequencies exhibited a significant change in power absorbance at peak pressure compared to measures made at ambient pressure. The resulting changes in power absorbance due to the lens placement may suggest that the lens is disrupting the ear canal resonance or middle ear mechanics, allowing for more low-frequency energy to be absorbed and less mid to high-frequency energy to be absorbed (Kim and Koo Citation2015). Previous work investigating the effects of various middle ear disorders on power absorbance measures suggested that a reduction in ossicular stiffness, as in the case of ossicular discontinuity, tends to result in increased power absorbance in the low frequencies, and decreased power absorbance (or increased reflectance) in the high frequencies due to the impact of the increased mass and decreased stiffness on the response characteristics of the middle ear system (Nakajima et al. Citation2012; Feeney, Grant, and Marryott Citation2003). These effects are believed to be a result of a change to the mass:stiffness ratio due to a reduction in middle ear stiffness resulting from disarticulation of the ossicles that shifts the balance in favour of a mass-dominated middle ear system. This interpretation is consistent with the results from the present study, wherein the increase in mass affected by the application of the microactuator and umbo platform of the lens would similarly bias the mass:stiffness ratio in favour of a mass-dominated middle ear system. Alternatively, the observed differences in power absorbance following lens placement may be a result of altered ear canal acoustics disrupting the phase of the acoustic signal. This change in the acoustic phase may alter the measurement of the pressure reflectance, a component of the absorbance calculation which incorporates phase angle information (Liu et al. Citation2008). Additional studies should focus on the cause of these observed changes in power absorbance in lens wearers to determine whether they are a result of an increase in mass load on the tympanic membrane or a disruption to the calculation of power absorbance by the immittance system. Of interest, however, the observed shift in power absorbance was not well correlated with the measured effects on air-conduction thresholds, as power absorbance was observed to decrease in the mid frequencies, where mean threshold changes were minimised. The authors speculate that acoustic energy that would normally be dissipated by the relatively absorbent tissues of the ear canal may be reflected to the probe microphone by the hard surfaces of the lens and produce the appearance of decreased power absorbance in the mid-frequency regions.
The current study demonstrates that the test-retest reliability of power absorbance measurements is not affected by lens placement. Both the ambient and peak pressure absorbance measurements demonstrate good test-retest reliability with and without the lens in place with mean differences between trials below 0.1 in both lens conditions. This measured test-retest reliability of power absorbance is similar to those previously reported during the same session or within 1 month apart (Rosowski et al. Citation2012; Feeney et al. Citation2017). These findings suggest that clinicians can expect good reliability of power absorbance measurements in patients fit with the Earlens. The mean change in power absorbance due to lens placement was measured to be less than 0.1 in both the ambient and peak pressure conditions. Therefore, the mean change in power absorbance due to lens placement reported in this study is similar to that of expected test-retest variability. Future work may be needed to establish large-scale normative data for WAI or tympanometric responses in Earlens users.
The present findings also suggest that changes in power absorbance are more likely to reflect changes in the ear canal acoustics or middle ear mass as opposed to changes in hearing thresholds. Comparing the mean change in audiometric thresholds to the mean change in power absorbance, the lens appears to exert a different effect on audiometric versus power absorbance measurements, particularly around 3000 Hz. For audiometric thresholds, the lens caused a mean improvement of thresholds at 3000 Hz, however, the lens caused a decrease in power absorbance between the frequencies of approximately 500–5000 Hz. These findings suggest that changes in power absorbance are more indicative of changes in ear canal acoustics or middle ear mechanics than predictors of audiometric thresholds. This has been noted in previous studies, with a reduction of middle ear stiffness causing changes in energy reflectance and audiometric thresholds, yet the two measures are poorly correlated in patients before and after corrected stapes surgery in otosclerotic ears (Shahnaz, Bork, et al. Citation2009).
Limitations of the current study included the small number of subjects and the removal of several thresholds from threshold change calculations due to reaching the limits of the audiometer in the high frequencies of 8000–10,000 Hz for sound field testing. Mean threshold changes of thresholds reported for the high-frequency range of 8000–10,000 Hz are conservative estimates. Threshold shifts were observed in three subjects at 8000 Hz and in one participant at 10,000 Hz, where pre-lens thresholds were obtained at the limit of the audiometer, and post-lens thresholds were unable to be accurately measured due to thresholds exceeding the limit of the audiometer. Testing using ER3A and HDA300 headphones pre- and post- lens placement in future studies may provide ear-specific thresholds without this limitation.
Furthermore, the present study examined tympanic membrane changes in patients who had worn the Earlens system for several weeks with large variability in the time between the pre- and post-lens measurement. It was not possible to accurately measure the acute change in clinical measurements immediately following lens placement due to the use of mineral oil to aid in the placement of the lens on the tympanic membrane. The presence of residual mineral oil in the ear canal, specifically if it is resting on the tympanic membrane, could have significantly altered the measurements in the post-lens condition. For this reason, these measures should be conducted after allowing some time for the applied oil to dissipate. Variation in time between the measurements was also attributable to the subject recruitment schedule, whereby the initial measurement was obtained prior to the earmold impression to ensure that the impression technique was not influencing the immittance measures. The data recording sessions are therefore representative of a standard clinical schedule to lens users.
The current study revealed a slight audiometric threshold increase is present with the use of the Earlens system, as has been reported previously. We evaluated standard immittance testing results (tympanometric peak pressure and ear canal volume) and found that these measures were not affected by lens placement. However, there was a detectable reduction in compliance of approximately 0.17 mL with the lens in place. We speculate that clinicians can continue to use standard tympanometry measures for assessment of essential middle ear function in patients who are wearing the Earlens system while taking into consideration a possible reduction in compliance values with the lens in place. It may be useful to consider comparisons to baseline values obtained shortly after lens placement in the event that an examination is needed without lens removal. Power absorbance measures at ambient and peak pressure demonstrate a small but significant change when the lens is in place. These findings suggest that clinicians using power absorbance for the purpose of middle ear disorder identification or differentiation, should be aware that normative data from typical ears may not apply, and it may be reasonable to expect slightly higher power absorbance in the low frequencies and lower power absorbance in the mid-frequencies in patients fit with the Earlens. Further normative data may be helpful in characterising normal power absorbance values for Earlens patients. Further characterisation of tympanometric and/or WAI measures of the middle ear system is needed in future studies to document how these measures would change over the time course of placement and follow-up when oil dosing and absorption are expected to affect the user temporarily. Further studies with a larger sample could possibly develop normative ranges for eardrum compliance and power absorbance with Earlens users. Finally, the specific device used in this study was the light-driven version of the Earlens. The current commercial Earlens system uses an inductive lens which has been designed to produce very similar loading to that used in this study, as the construction, mass, and bias spring configuration of the inductive lens is similar to what is depicted in . Further study would be needed to confirm that the change in audiometric thresholds and immittance effects of this new system is similar to the light-driven system used in the current study.
Overall, the clinical implications of this study suggest that threshold change effects of the lens are minimal, with most patients exhibiting threshold changes due to lens placement within one step size on the audiometer. Results of this study also suggest that clinicians using tympanometry and power absorbance routinely in their clinical practice can reliably conduct these measures. However, clinicians should consider the slight changes in compliance and power absorbance as a result of the Earlens system.
Acknowledgements
The authors thank Tanya Arbogast, Sandy Wanner, Parvaneh Abbasalipour, Rana El-Naji and Frances Richert, for their assistance with hearing device fittings, Judy Brimacombe for logistical support, and Steve Beaulac for technical support. We also thank Bilal Sheikh and Nicole Willis for their work on the project as lab members of the Translational Research Unit, as well as Matthew Urichuk, Lauren Siegel and Sunil Puria for manuscript review.
Disclosure statement
Drew Dundas and Suzanne Levy are employees of Earlens Corporation. No conflicts were declared for the remaining authors.
Additional information
Funding
References
- Abur, D., N. J. Horton, and S. E. Voss. 2014. “Intrasubject Variability in Power Reflectance.” Journal of the American Academy of Audiology 25 (5): 441–448. doi:10.3766/jaaa.25.5.3.
- Fay, J. P., R. Perkins, S. C. Levy, M. Nilsson, and S. Puria. 2013. “Preliminary Evaluation of a Light-Based Contact Hearing Device for the Hearing Impaired.” Otology & Neurotology 34 (5): 912–921. doi:10.1097/MAO.0b013e31827de4b1.
- Feeney, M. P., and C. A. Sanford. 2004. “Age Effects in the Human Middle Ear: Wideband Acoustical Measures.” The Journal of the Acoustical Society of America 116 (6): 3546–3558. doi:10.1121/1.1808221.
- Feeney, M. P., I. L. Grant, and L. P. Marryott. 2003. “Wideband Energy Reflectance Measurements in Adults with Middle-Ear Disorders.” Journal of Speech, Language, and Hearing Research 46 (4): 901–911. doi:10.1044/1092-4388(2003/070).
- Feeney, M. Patrick, Douglas H. Keefe, Lisa L. Hunter, Denis F. Fitzpatrick, Angela C. Garinis, Daniel B. Putterman, and Garnett P. McMillan. 2017. “Normative Wideband Reflectance, Equivalent Admittance at the Tympanic Membrane, and Acoustic Stapedius Reflex Threshold in Adults.” Ear and Hearing 38 (3): e142–e160. doi:10.1097/AUD.0000000000000399.
- Gantz, B. J., R. Perkins, M. Murray, S. C. Levy, and S. Puria. 2017. “Light-Driven Contact Hearing Aid for Broad-Spectrum Amplification.” Otology & Neurotology 38 (3): 352–359. doi:10.1097/MAO.0000000000001300.
- Keefe, D., L. K. Archer, K. Schmid, D. Fitzpatrick, P. Feeney, and L. Hunter. 2017. “Identifying Otosclerosis with Aural Acoustical Tests of Absorbance, Group Delay, Acoustic Reflex Threshold, and Otoacoustic Emissions.” Journal of the American Academy of Audiology 28 (9): 838–860. doi:10.3766/jaaa.16172.
- Kim, J., and M. Koo. 2015. “Mass and Stiffness Impact on the Middle Ear and the Cochlear Partition.” Journal of Audiology & Otology 19 (1): 1–6. doi:10.7874/jao.2015.19.1.1.
- Liu, Yi-Wen, Chris A. Sanford, John C. Ellison, Denis F. Fitzpatrick, Michael P. Gorga, and Douglas H. Keefe. 2008. “Wideband Absorbance Tympanometry Using Pressure Sweeps: System Development and Results on Adults with Normal Hearing.” The Journal of the Acoustical Society of America 124 (6): 3708–3719. doi:10.1121/1.3001712.
- Max, L., and P. Onghena. 1999. “Some Issues in the Statistical Analysis of Completely Randomized and Repeated Measures Designs for Speech, Language, and Hearing Research.” Journal of Speech, Language, and Hearing Research 42 (2): 261–270. doi:10.1044/jslhr.4202.261.
- Merchant, G. R., S. N. Merchant, J. J. Rosowski, and H. H. Nakajima. 2016. “Controlled Exploration of the Effects of Conductive Hearing Loss on Wideband Acoustic Immittance in Human Cadaveric Preparations.” Hearing Research 341: 19–30. doi:10.1016/j.heares.2016.07.018.
- Nakajima, Hideko H., Dominic V. Pisano, Christof Roosli, Mohamad A. Hamade, Gabrielle R. Merchant, Lorice Mahfoud, Christopher F. Halpin, et al. 2012. “Comparison of Ear-Canal Reflectance and Umbo Velocity in Patients with Conductive Hearing Loss: A Preliminary Study.” Ear and Hearing 33 (1): 35–43. doi:10.1097/AUD.0b013e31822ccba0.
- Perkins, R. 1996. “Earlens Tympanic Contact Transducer: A New Method of Sound Transduction to the Human Ear.” Otolaryngology-Head and Neck Surgery 114 (6): 720–728. doi:10.1016/S0194-5998(96)70092-X
- Perkins, R., J. P. Fay, P. Rucker, M. Rosen, L. Olson, and S. Puria. 2010. “The EarLens System: New Sound Transduction Methods.” Hearing Research 263 (1–2): 104–113. doi:10.1016/j.heares.2010.01.012.
- Puria, S., P. L. S. Maria, and R. Perkins. 2016. “Temporal-Bone Measurements of the Maximum Equivalent Pressure Output and Maximum Stable Gain of a Light-Driven Hearing System That Mechanically Stimulates the Umbo.” Otology & Neurotology 37 (2): 160–166. doi:10.1097/MAO.0000000000000941.
- Rosowski, J. J., S. Stenfelt, and D. Lilly. 2013. “An Overview of Wideband Immittance Measurements Techniques and Terminology: You Say Absorbance, I Say Reflectance.” Ear and Hearing 34 Suppl 1 (01): 9S–16S. doi:10.1097/AUD.0b013e31829d5a14.
- Rosowski, J., and L. Wilber. 2015. “Acoustic Immittance, Absorbance, and Reflectance in the Human Ear Canal.” Seminars in Hearing 36 (1): 11–28. doi:10.1055/s-0034-1396924.
- Rosowski, John J., Hideko H. Nakajima, Mohamad A. Hamade, Lorice Mahfoud, Gabrielle R. Merchant, Christopher F. Halpin, and Saumil N. Merchant. 2012. “Ear-Canal Reflectance, Umbo Velocity, and Tympanometry in Normal-Hearing Adults.” Ear and Hearing 33 (1): 19–34. doi:10.1097/AUD.0b013e31822ccb76.
- Sanford, C., T. Schooling, and T. Frymark. 2012. “Determining the Presence or Absence of Middle Ear Disorders: An Evidence-Based Systematic Review on the Diagnostic Accuracy of Selected Assessment.” American Journal of Audiology 21 (2): 251–268. doi:10.1044/1059-0889(2012/11-0029)a.
- Shahnaz, N., K. Bork, L. Polka, N. Longridge, D. Bell, and B. D. Westerberg. 2009. “Energy Reflectance and Tympanometry in Normal and Otosclerotic Ears.” Ear and Hearing 30 (2): 219–233. doi:10.1097/AUD.0b013e3181976a14.
- Shahnaz, N., M. P. Feeney, and K. S. Schairer. 2013. “Wideband Acoustic Immittance Normative Data: Ethnicity, Gender, Aging, and Instrumentation.” Ear and Hearing 34 Suppl 1: 27s–35s. doi:10.1097/AUD.0b013e31829d5328.
- Shahnaz, N., N. Longridge, and D. Bell. 2009. “Wideband Energy Reflectance Patterns in Preoperative and Post-Operative Otosclerotic Ears.” International Journal of Audiology 48 (5): 240–247. doi:10.1080/14992020802635317.
- Thompson, B. 2007. “Effect Sizes, Confidence Intervals, and Confidence Intervals for Effect Sizes.” Psychology in the Schools 44 (5): 423–432. doi:10.1002/pits.20234.
- Vaisberg, J., P. Folkeard, S. Levy, D. Dundas, S. Agrawal, and S. Scollie. 2021. “Sound Quality Ratings of Amplified Speech and Music Using a Direct Drive Hearing Aid.” Otol Neurotol 42 (2): 227–234. doi:10.1097/mao.0000000000002915.
- Vander Werff, K. R., B. A. Prieve, and L. M. Georgantas. 2007. “Test-Retest Reliability of Wideband Reflectance Measures in Infants under Screening and Diagnostic Test Conditions.” Ear and Hearing 28 (5): 669–681. doi:10.1097/AUD.0b013e31812f71b1.
- Wiley, T. L., K. J. Cruickshanks, D. M. Nondahl, T. S. Tweed, R. Klein, and B. E. Klein. 1996. “Tympanometric Measures in Older Adults.” Journal of the American Academy of Audiology 7 (4): 260–268. http://www.ncbi.nlm.nih.gov/pubmed/8827920.