
Abstract
Objective
This study compared two different versions of an electrophysiology-based software-guided cochlear implant fitting method with a procedure employing standard clinical software. The two versions used electrically evoked compound action potential (ECAP) thresholds for either five or all twenty-two electrodes to determine sound processor stimulation level profiles. Objective and subjective performance results were compared between software-guided and clinical fittings.
Design
Prospective, double-blind, single-subject repeated-measures with permuted ABCA sequences.
Study sample
48 post linguistically deafened adults with ≤15 years of severe-to-profound deafness who were newly unilaterally implanted with a Nucleus device.
Results
Speech recognition in noise and quiet was not significantly different between software- guided and standard methods, but there was a visit/learning-effect. However, the 5-electrode method gave scores on the SSQ speech subscale 0.5 points lower than the standard method. Clinicians judged usability for all methods as acceptable, as did subjects for comfort. Analysis of stimulation levels and ECAP thresholds suggested that the 5-electrode method could be refined.
Conclusions
Speech recognition was not inferior using either version of the electrophysiology-based software-guided fitting method compared with the standard method. Subject-reported speech perception was slightly inferior with the five-electrode method. Software-guided methods saved about 10 min of clinician’s time versus standard fittings.
Introduction
A critical aspect of treating a patient with a cochlear implant (CI) system - and often the most time-consuming phase - is the fitting (or programming) of the external sound processor to the individual’s needs. Clinical fitting procedures are mostly based on a combination of psychophysical and objective electrophysiological measurements. However specific approaches vary, and parameter selection is often dependent on the experience of the clinician. Principally, the minimum and maximum electric current limits must be set for each intra-cochlear electrode channel; these together constitute a hearing profile. These are usually referred to as threshold (T) and comfort (C) levels in Nucleus® CI devices. The current limits when combined with other stimulation parameters are collectively called a “program” or “map”.
Currently, for Nucleus CI recipients, CustomSound software is used to create maps and that requires a significant amount of training for the audiologist. In this study we present two versions of a more intuitive procedure. The software-guided fitting method implemented in the Nucleus Fitting Software (NFS) presents the fitting process as a structured series of familiar clinical tasks, with each task directly linked to a specific hearing outcome for the CI recipient. These tasks are measurement of ECAP thresholds, global volume adjustment and balancing the loudness of different electrode groups. The aim of this approach is to streamline the fitting process to increase efficiency and access to care, while maintaining the quality of hearing outcomes.
The primary goals at activation of the CI system are audibility and comfort for the patient. The fitting process in NFS starts with the creation of a hearing profile based on objective measures that are then adjusted using behavioural feedback from the patient. The underlying shape of the hearing profile can be based on measured electrically evoked compound action potential (ECAP) thresholds (ECAP threshold is also known as T-NRT) or, if these are not obtainable, on a population mean profile. T- and C-level profiles are both approximated by the hearing profile that is shifted to produce a fixed T to C dynamic range. Fine tuning of loudness and the perception of soft sound are addressed at a later stage; when the CI user is more familiar with electric hearing.
To date there is limited evidence to support the use of ECAP-profile based fitting methods. Sample sizes in studies tend to be small with substantial bias (de Vos et al. Citation2018). Even in the first reported ECAP programming methods with overall levels set using either one psychophysical measurement or live voice levels, the best results were obtained with the psychophysically measured map compared to ECAP methods (Seyle and Brown Citation2002; Smoorenburg, Willeboer, and van Dijk Citation2002). One study reported equivalent speech perception when using interpolated levels alone, without ECAP, and levels measured on each individual electrode (Plant et al. Citation2005).
Müller-Deile (Citation2009) and (Raghunandhan et al. Citation2014) found that ECAP was helpful as a reference to predict levels for initial fittings, but they recommended that behavioural measures should be made to further optimise maps. Pedley et al. (Citation2007) observed that maps estimated from ECAP threshold data provided good speech perception outcomes for elderly implant recipients and were well tolerated. Thai-Van et al. (Citation2004) suggested that covariation between ECAP thresholds and psychophysics plays a decisive role in the relationship of ECAP thresholds with T-, but not with C-levels. Brown et al. (Citation2000) recommended using ECAP thresholds in combination with a limited amount of behavioural information to predict map T- and C-levels with reasonable accuracy. Craddock et al. (Citation2003) supported that approach but observed variations in the T- and C-levels between all maps, although speech discrimination tests demonstrated no statistically significant difference between behavioural and ECAP-based maps. In contrast, Potts et al. (Citation2007) indicated that the prediction of the contour of T- and C-levels, from the contour of ECAP thresholds across electrodes, would not be appropriate for half of their subjects.
The scaled ECAP fitting procedure used in the Nucleus Fitting Software was validated in 15 adult subjects in one clinic (Botros and Psarros Citation2010). The Nucleus Fitting Software methods were then implemented in the streamlined and remote-assistant fitting methods validated by Botros, Banna, and Maruthurkkara (Citation2013) and compared to psychophysical methods. However, testing of these methods in noise was very limited; only 13 subjects were tested in noise in the first phase, where all three techniques were compared. Scores were equivalent for words at 50 and 60 dBSPL, and equivalent for sentences presented at 65 dBSPL in noise. Only 12 subjects were tested in noise in the second phase of the study comparing remote assistant and psychophysical methods. Vroegop et al. (Citation2017) did evaluate remote assistant fitting in 22 experienced CI users (> 12 months implant use) in a three-week take home trial. Most subjects made modest adjustments to their maps using the remote assistant, but there was no effect on speech scores.
The stability of map levels over time has been investigated in three large studies (Incerti et al. Citation2018; Gajadeera et al. Citation2017a, Citation2017b). These found that in adults there was only a small change in levels from 6 months to 10 years. From 3–6 months 65–75% of adult subjects had a change in their maps of less than 20% of their dynamic range (Gajadeera et al. Citation2017b). A few studies demonstrated that changes in T-level are also more likely in the basal region, possibly due to increased fibrosis. Older studies with smaller sample sizes, including the Combi 40+ (Vargas et al. Citation2012) and Clarion devices (Henkin et al. Citation2006), seem to concur that T-levels are more stable than C-levels over time. Certainly, by 6 months post activation both T- and C-levels are stable, and T-levels may be stable earlier (Mosca, Grassia, and Leone Citation2014; Henkin et al. Citation2006; Walravens, Mawman, and O’Driscoll Citation2006; Henkin et al. Citation2003). These findings were considered in the design of the current trial and in determining the study duration.
We hypothesised that the two different versions of the software-guided fitting method would provide CI subjects with the same hearing performance compared to the clinical routine fitting procedures used with the CustomSound programming system. Comparison of fitting methods was realised by measuring speech comprehension in quiet and in noise as well as subjective rating by participants in the study. The software-guided fitting methods investigated differed in the number of postoperatively measured ECAP thresholds. One version used ECAP thresholds recorded for five electrodes (Treat-5) spread across the electrode array to interpolate the hearing profile across all 22 electrodes. The other version (Treat-22) used ECAP thresholds measured on all 22 electrodes as a basis for the hearing profile. These two software-guided fitting methods implemented in the Nucleus Fitting Software were evaluated and compared to the clinics’ routine fitting methods (CS) employing the CustomSound software.
Materials and methods
Study design and randomisation paradigm
The randomised controlled trial was a double-blind, prospective multicenter study with a cross-over design and repeated measures to control for learning effects. Subjects were fitted with the different methods under investigation in an ABCA design. They were initially fitted with one method and then refitted using the same method at 3 months. Subject’s maps were then crossed over and fitted with the other methods at 6 and 9 months. Participants were finally refitted using the original method again at 12 months. The use of an initial 6 months exposure to the first method allowed time for initial acclimatisation to the CI and takes care of the well-known fact that greatest changes in comfort and intelligibility occur in the first half year following the first fit. The 3 months period following each fitting session gave time for further acclimatisation. Subjects were randomly assigned to six sequence groups to minimise order effects. The allocation lists were kept in a separate folder and were only accessible to the clinician accountable for the randomisation and programming of the patients with the respective treatment method. Evaluations were conducted in a double-blind fashion, such that subjects and clinicians performing the evaluation were not told which fitting method was used at any one visit.
The default advanced combination encoder (ACE) coding strategy was employed with all fitting methods. Subjects were randomly assigned into six ABCA sequences starting with one of the three different fitting methods: CS, Treat-5 or Treat-22 at baseline. Then, for each baseline condition “A,” there were two different orders for the intermediate visits B and C. Subjects were first fitted using one method (CS, Treat-5 or Treat-22) for the first 6 months after surgery, including some adjustments to the map over that time. Subject’s maps were then crossed over three times in ABCA order, and therefore fitted using method “B” at 6 months and “C” at 9 months and with the initial method “A” at 12 months. For programming methods that required ECAP thresholds, these were measured in the same visit. ECAP thresholds were obtained using the standard clinical AutoNRT™ method (van Dijk et al. Citation2007). We note that the fitting method programmed at 12 months was the same as the baseline fitting method “A” but using remeasured ECAP thresholds where applicable.
This multicenter clinical trial was conducted at three German speaking cochlear implant centres. Fittings were performed by audiologists with extensive experience by long standing programming of cochlear implant speech processors to the needs of adults and children, including challenging cases.
Participants
48 adult subjects were recruited ().
Table 1. Individual demographics of the study population.
Inclusion criteria were: newly unilaterally implanted with Nucleus CI compatible with CP900 series sound processors (excluding Cochlear Nucleus Hybrid); adults (≥ 18 years), post linguistic deafness and ≤ 15 years of severe to profound deafness; capable and willing to participate in speech perception tests in the local language; able to provide feedback via a written questionnaire; and willing to give their consent to the study.
Exclusion Criteria were: additional handicaps that would prevent participation in evaluations (e.g. visual impairment, blindness); unrealistic expectations on the part of the subject, regarding the possible benefits, risks and limitations that were inherent to the procedure/fitting method; single-sided deafness, i.e. contralateral unaided speech recognition with monosyllables >20%, known cochlea malformations, previous cochlear implantation or deafness due to Meningitis.
Fitting methods
The electrophysiology-based software-guided fitting methods Treat-5 and Treat-22 differ from previous methods in three ways: (1) they combine the CustomSound ECAP-based methods into a single method; (2) they use a new profile scaling technique; and (3) they combine behavioural measures with ECAP thresholds, allowing programs to be fine-tuned as extra measurements are made (Botros and Psarros Citation2010). ECAP thresholds are interpolated using a spline function for those electrodes that are not measured (e.g. Treat-5) or where a threshold is not obtained. There are additional fine-tuning controls not found in CustomSound, such that the profile can be adjusted using a master volume, bass and treble corresponding to shifting map levels for all electrodes up or down or changing the balance between levels for apical or basal electrodes. These profile adjustment controls were described by Vroegop et al. (Citation2017). As the hearing profile is shifted up in level using the master volume, profile scaling is applied such that the profile range is compressed to compensate for loudness effects (Botros and Psarros Citation2010).
In the Treat-5 condition sound processor programming was based on postoperative ECAP thresholds measured on 5 electrodes (electrode 1, 6, 11, 16, 22), and in the Treat-22 condition on all 22 electrodes. The Treat-22 condition allowed investigation of the effect of variations in ECAP thresholds from one electrode to the next which may not be accounted for by interpolation. Treat-5 and Treat-22 methods were implemented in a research version of Cochlear’s Nucleus Fitting Software for ECAP threshold measurements and for fine tuning. ECAP thresholds were remeasured during all fitting sessions with all methods. For further comparison the psychoacoustic fitting parameters T- and C- levels as well as the electrophysiological thresholds of measured ECAP were analysed.
The specific fitting methods employing CustomSound software varied slightly across centres, with a mixed use of ECAP profiles and subjective loudness measurements. It was decided not to harmonise these proceedings within the participating centres, as the aim was to compare the results of the new standardised fitting methods with the outcomes based on the routine work of the very experienced audiologists. Behavioural testing was used in every case during the fitting process. One of the clinics systematically fitted all electrodes psychophysically in their routine, the others used interpolation across fewer electrodes with psychoacoustic controls over all electrodes. Stapedius reflex thresholds as well as ECAP thresholds and loudness scaling were used to assist the determination of T- and C-levels.
Initial fitting was performed about 1-month post-surgery.
Audiological evaluation measurements
Performance and outcome measurements were conducted after a 3-month acclimatisation period with each program. Subjects were tested at the beginning of the session, before any new fitting activities. The last visit occurred 15 months after the first fitting session, to evaluate the fitting method that was programmed during the 12-month visit. All testing was conducted with the sound processor’s automatic SCAN function turned off, standard microphone directionality and a fixed sensitivity of 12 (the default). However, subjects chose their preferred volume setting. Fitting/mapping took place once the speech performance testing had been completed.
Speech recognition in noise was evaluated by the Oldenburg Sentence (OLSA) test (Wagener, Brand, and Kollmeier Citation1999). The noise level was fixed at 65 dB SPL RMS and the speech level was varied by an adaptive procedure to obtain the Speech Reception Threshold (SRT) (Brand and Kollmeier Citation2002; Hey et al. Citation2014). Two lists of 30 sentences were employed per condition and the results averaged. Speech and noise were both presented from the front (S0N0). Based on the findings of Hey and co-workers (Hey et al. Citation2014) results exceeding 5 dB S/N were excluded from the analysis. They showed that for these SRTs the steepness of the discrimination function becomes generally flat. Therefore the presumption of a steep discrimination function, which is essential for the adaptive algorithm to determine the SRTs, gets increasingly invalid and these measurement results are rather uncertain and should not be incorporated.
Speech recognition in quiet was evaluated using the Freiburg monosyllabic words test (Hahlbrock Citation1957; Lehnhardt and Laszig Citation2009). Two lists of words (n = 40) per condition were presented at 65 dBSPL. Word list pairing and list order were randomised across subjects. In the interest of time and patient’s burden as well as their concentration, it was decided to record speech recognition in quiet only at one presentation level.
The German version of the Speech, Spatial and Qualities of Hearing Scale (SSQ) was employed to measure a range of hearing performance across several domains (Gatehouse and Noble Citation2004; Kießling et al. Citation2011). The SSQ speech subscale questions focus on hearing speech in a variety of competing environments. The spatial subscale covers the directional, distance and movement components of spatial hearing. The qualities of hearing subscale examines ease of listening and the naturalness, clarity and identification of different speakers, different musical pieces and instruments, and different everyday sounds. In this study, subjects completed SSQ questions for the Speech and Quality subscales only. Questions related to spatial hearing were excluded as subjects were implanted unilaterally and to reduce complexity. Subjects rated their experiences in the situations presented on a visual analogue scale from 0 (not at all) to 10 (perfectly). They filled in the questionnaires before reprogramming.
At the end of each session, clinicians answered a questionnaire addressing the effectiveness, handling, and usability of the programming software and the duration of fitting. Two of the questions collected clinicians’ ratings on the usability of the different fitting methods on a 7-point Likert scale from “strongly agree” to “strongly disagree,” with 4 indicating neutral. The first statement was “The fitting method used today provided all necessary controls in order to adapt the fitting to the subject’s needs” and the second “The fitting method used during this session was adequate for this subject”. Responses 1–4 were counted as adequate; and 5–7 as not adequate.
Subjects as well were asked to fill in a questionnaire to subjectively evaluate the fitting process each time. They could review the answers from the preceding fitting session (i.e. to judge better than previous session/worse than preceding session). Scores were also entered on a 7-point Likert scale in response to 12 statements about sound quality and experiences encountered during the session.
Statistical analysis
The study was designed to test non-inferiority: that is whether the new treatments were not worse than the standard treatment, by a specified margin. The margin for the primary performance measure, the OLSA in noise score, was taken as 1.5 dBS/N (signal-to-noise ratio), based upon a consensus of clinical significance from the authors. In a non-inferiority trial, the null hypotheses (H0) and alternative hypotheses are reversed. A type I error limit (α) of 0.05, 1-sided (i.e. the new fitting not being worse than the old one) was assumed for the calculations to compare the clinically used CS and software-guided fitting Treat-5 and Treat-22 methods. All six sequences were exploited to estimate the difference between the treatment methods. The power for rejecting H0, that is that the mean difference between CS and Treat-5 and Treat-22 was 1.5 dBS/N or more, was 99.8%.
For the secondary performance measures such as SSQ scores and the clinician and subject comfort questionnaires, 20% was considered as a clinically significant difference. No sample size calculations were performed for those secondary objectives to subjectively evaluate the fitting methods.
The continuous variables OLSA-in-noise scores, Freiburg monosyllables and SSQ scores, were separately subjected to a linear mixed-model (LMM) analysis with the fixed effects of visit and fitting method (CS, Treat-5, Treat-22). For significant main effects, Tukey-Kramer tests were used to determine whether contrasts between pairs of levels of the main effects were statistically significant. Linear mixed model analysis tolerate a certain amount of missing data (see results). The distribution of residuals for the linear mixed models was examined to determine the effect of outliers. In a sensitivity analysis approach, outliers were removed, and models re-computed to determine if the main effects were altered.
C- and T- levels and ECAP thresholds, expressed in current level units, were subjected to linear mixed-model analysis with fixed effects of fitting method and electrode contact number. Marginal means were estimated from the models. Analysis was performed with R V4 software (R Core Team Citation2017) with additional “lme4” and “emmeans” packages (Bates et al. Citation2015; Lenth Citation2019). Hypotheses were tested with the “lmerTest” package (Kuznetsova, Brockhoff, and Christensen Citation2017).
In addition, principal component (PC) analysis was performed on C- and T-levels across treatment methods, and for complete sets of ECAP thresholds because levels across the array are expected to be highly correlated (Smoorenburg, Willeboer, and van Dijk Citation2002). Data were centred separately for T- and C-levels and ECAP thresholds relative to their grand means across electrodes, subjects and conditions. Rotation matrices of loadings (more properly “weightings” since the data were homogenous across electrode number) by electrode number and PC were derived using the R “prcomp” function. The loadings were further varimax rotated to give a set of electrode numbers with least correlated levels (Kaiser Citation1958). Those PCs explaining more than 2% of the variance in the data were retained. We set a low criterion because large variations on few electrodes in the data set could be important subjectively but would not contribute substantially to the total variance.
Separate linear mixed models with fixed effects of fitting method were then developed for consecutive PCs for T- and C- level data.
This study was approved by the ethics committees of each participating clinic and the German competent authority BfArM, before any study related activities were initiated. This study was registered on ClinicalTrials.gov with the identifier: NCT02228148. The EUDAMED registration number is CIV-14-06-012219.
Results
To test the efficacy of the different cochlear implant fitting methods we enrolled and tested 48 subjects between 2012 and 2017. Twenty-seven subjects were implanted at the right side and 21 on the left side. The gender distribution was 44% male and 56% female. The average age at enrolment was 59 years (SD 14, range 21–79) and onset age of initial hearing loss at the implant side was 35 years (SD 23, range 0–77). 14 study subjects (29%) withdrew from the study. 4/14 dropouts were clinic related due to protocol deviation or by accident, 1/14 could not perform speech tests with either map and 3/14 left the study by request of the subject. 6/14 were method related due to facial nerve stimulation, tinnitus or poor sound quality when using Treat-22 (n = 1) or Treat-5 (n = 5) fittings.
In total 34 complete datasets were available for analysis.
Speech recognition thresholds in noise
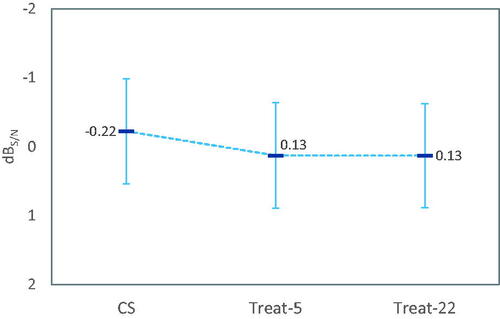
Regarding the speech recognition thresholds in noise, there was a statistically significant main effect of visit (p < 0.001), but not for fitting method (p = 0.37) on OLSA scores. As illustrated in , mean differences between the treatment methods were smaller than the non-inferiority margin of 1.5 dB S/N (CS – Treat-5 = −0.35 dB S/N; CS – Treat-22 = −0.35 dB S/N; Treat-5 – Treat-22 = −0.00 dB S/N). Signal to noise ratios significantly improved over time from the first to the last evaluation visit by 1.37 dB S/N. We note that we saw ten influential observations with speech recognition thresholds exceeding 5 dB S/N, which were excluded from the analysis The distribution of data points excluded from the analysis was not biased with respect to the treatments or visits. The exclusions are based on indication of non-valid recordings in measurements with results > +5 dB S/N (Hey et al. Citation2014).
Figure 1. Least-square mean OLSA speech reception thresholds in noise by fitting method (N = 35). Data points with values > 5 dBS/N were excluded from the linear mixed model due to being outliers (see text). There was no statistically significant effect of fitting method. Error bars are 95% confidence intervals of means.
Speech recognition in quiet
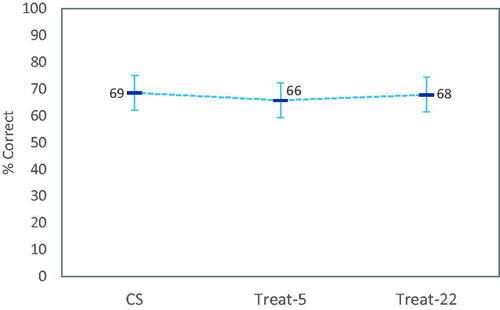
Residuals for linear mixed models obtained for word scores were not normally distributed, even after removing outliers, and so the results should be treated with some caution: There was a significant main effect of visit (p = 0.001) on word scores in quiet, but not for fitting method (p = 0.25). As shown in , scores for Treat-22 were slightly better than for Treat-5; while on average CS was the best.
Figure 2. Least square mean Freiburg monosyllabic words scores by fitting method (N = 34). The linear mixed model was not valid due to non-normal distribution of residuals. The values are indicative and indicate no large effect of fitting method. Error bars are 95% confidence intervals of means.
SSQ questionnaire
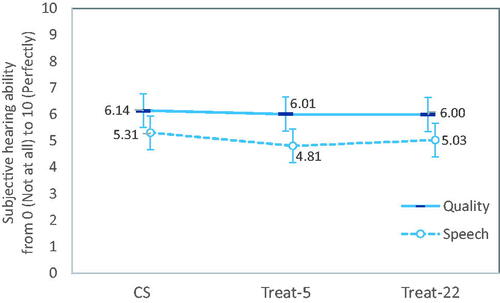
There were significant main effects of visit (p < 0.001) and fitting method (p < 0.02) on SSQ speech subscale scores (). Scores for Treat-5 were significantly lower than for CS (p < 0.02), whereas there was no difference in scores between Treat-22 and CS (p = 0.26). For quality subscale scores, there was a significant main effect of visit (p < 0.001), but not for fitting method (p = 0.70). As shown in , although scores varied on the SSQ speech subscale between fitting methods, no differences in mean scores between treatment methods was greater than 0.5 units (i.e. 5%).
Figure 3. Least square mean SSQ “speech” and “quality” subscale scores by fitting method (N = 36). Speech subscale scores for Treat-5 were significantly lower than those for CS. Error bars are 95% confidence intervals of means.
Audiologist’s software usability questionnaire
All three fitting methods provided necessary controls to adapt the fitting to the subject’s needs. This statement is true based on the evaluation by the clinicians in 99% of the fittings with CS, 87% with Treat-22 and 81% with Treat-5. In four cases where Treat-5 did not provide adequate control, comments indicated that the use of Treat-22 would have been more appropriate. In two others, finer controls over pulse width and stimulation parameters would have been useful as possible with CS. In a further two, neither Treat-5 nor Treat-22 controls allow a satisfactory initial fitting. For Treat-22, comments indicated that the lack of necessary control over the fitting was related to difficulty visualising deactivated electrodes, or to manually test to solve facial nerve stimulation. All three methods met the pass criteria in that CS and both software-guided fitting methods provided all the necessary controls in >80% of cases to adapt the fitting to the subject’s needs. However, CustomSound had many more adequate ratings and its use seems to be more appropriate in challenging cases.
Ratings also indicated that fitting methods were adequate for Treat-5 in 82% of the mapping sessions, 89% for Treat-22 and 97% for CS. This is in line with the evaluation on the necessary controls in order to adapt the fitting to the subject’s needs.
Fitting duration
Fitting durations were only recorded for 207 of the 240 sessions (), but the missing data were evenly distributed across methods. A LMM analysis of fitting durations with method and visit as fixed effects and subject as random effect revealed a significant effect of fitting method (p < 0.001), but not for visit (p = 0.76). Treat-22 fittings took a median of 25 min; CS fittings took 5 min more (p < 0.001) and Treat-5 5 min less (p = 0.026). There were two outliers for the CS methods which took 135 and 160 min. These were removed from the LMM due to producing large residuals. They occurred in visits 5 and 6 and so did not appear to be due to problems encountered at initial activation. The remaining fittings took up to 76 min (mean 27 ± 15 min).
Table 2. Duration of fitting sessions (minutes).
Subject’s comfort questionnaire
For three statements in the questionnaire, the results were found to be unsatisfactory for all three fitting methods. These statements were “The sound of my new CI adjustment is odd,” “I feel exhausted after this fitting session” and “I had to concentrate more during today’s fitting session compared to the previous one”. Fewer than 80% of responses were “Strongly Agree” to “Undecided”. This was also the case for the Treat-22 method with the statement “The clinician could attend to my hearing needs in a better way compared to the previous fitting session”. Ratings for all three methods were satisfactory for the remaining eight statements. These data suggest that subjective outcomes for the software-guided fitting methods and CS were largely equivalent.
Profiles of ECAP thresholds and map T- and C- levels
Map C- and T- levels varied significantly across the electrode array (both p < 0.001) and with fitting method (both p < 0.001) as shown in . However, the mean differences between fitting methods were all less than 8 CL, and much less than the range of maximum 18 CL in levels across the array for all methods.
Figure 4. Mean T- and C- levels (panel A; for electrodes 1–3 in CS and T-22 N = 64/62/61; T5 N = 60/58/57 respectively) and ECAP threshold levels (panel B) with 95% confidence intervals of means (shown only as one-sided bars for the sake of clarity). Note that in (B), mean ECAP threshold levels for Treat-5 measured on non-default electrodes are also shown, and labelled according to the corresponding number of measurements. T- and C- levels varied significantly across the array but there were no significant differences between fitting methods. ECAP thresholds were not significantly different between measurement sessions for the five consistently measured electrodes.
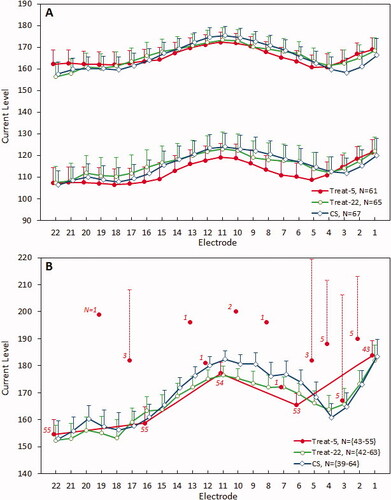
The ECAP threshold profiles were only partially represented by the levels measured on the five electrodes for Treat-5 fittings (). The CS and Treat-22 profiles were similar to each other except between e13 and e3 where the difference was greater. There was a notable dip on average in ECAP thresholds between electrode 3 and electrode 4 for the Treat-22 and CS measurements compared to Treat-5. However, there was no statistically significant interaction effect between electrode number and fitting method for C- and T-levels (C: p = 0.83, T: p = 0.98) from the LMM analysis, and thus no overall effect of using ECAP thresholds for all 22 electrodes versus only 5 electrodes on profiles. The close match obtained between Treat-22 and Treat-5 C- and T-profiles appears to be due to the spline interpolation applied by the NFS software to approximate ECAP thresholds for non-measured electrodes. We note that profile matches were seen for individual subjects.
As can be inferred from comparing panels A and B in , there were slight differences in the shape of ECAP threshold and C-level profiles. Mean differences between ECAP thresholds and C-levels were small (, “mean difference”). The shape of the C-level and ECAP threshold profiles differed significantly for CS and Treat-5 methods, but not for Treat-22 (, “shape,” as indicated by the presence or absence of an interaction effect between electrode number and method). There was a greater difference seen at electrode 1 (EL1) than at electrode 22 (EL22), with the range of levels greater for ECAP thresholds than C-levels.
Table 3. Linear mixed model (LMM) and contrast statistics for each fitting method.
In the NFS software, for the Treat-5 method, ECAP thresholds measurements are first attempted by default on electrodes 1, 6, 11, 16 and 22. However, when no threshold is obtained on one of the default electrodes, the NFS software then automatically proceeds to measure on adjacent electrodes closer to the middle of the array (). For the purpose of comparing ECAP thresholds between fitting methods, these measurements were used to impute levels for the default five electrodes. ECAP thresholds varied significantly across the array (p < 0.001), but not between fitting methods (p = 0.634). This was expected, but also confirms that ECAP thresholds were consistent between session types. In particular, measuring on more than five electrodes did not alter the threshold for those five electrodes.
Weighting functions for principal components (PC) 1–5 are given in for ECAP thresholds and C-levels. The weightings for T-levels (not shown) were very similar to those for C-levels. There were no significant differences found between fitting methods for both T- levels and C- levels rotated via PCs 1–5 (T: p = 0.21-–0.59 and C: p = 0.12–0.92). PC1 for map levels explained about 70% of the variation in levels and corresponded to the mean level (, lower panel) as indicated as an approximately constant weighting. PC2-PC4 explained at least 2% of the variance (). However, PC1 and PC2 for ECAP thresholds explained a more equal share of the variance but together only explained about 70% of the variance, and PC6 still explained slightly greater than 2% of the variance (). One can interpret the PCA weighting functions in like Fourier components, with more bends in the curves corresponding to higher harmonic number and shifts as phases. For C-levels PC1 is a DC component and for ECAP threshold, PC2. The PC2 C-level weighting function is close to an inverted PC1 for ECAP thresholds (the sign of the weightings is arbitrary). Then the shapes of the following weighting functions PC3-PC6 become progressively more complex. A given C, T, or ECAP threshold profile can be closely approximated by a linear combination of the first five PC weighting functions.
Figure 5. Rotation matrix weightings from principal component analysis. Principal component weightings differed slightly between ECAP thresholds (upper panel) and C- levels (lower panel). The weightings for T-levels (not shown) were very similar to those for C-levels. As few as 5 components explained 99% of the variance (), but varimax analysis revealed that a subset of electrodes (solid circles) different from those used for Treat-5 may better predict levels across all 22 electrodes.
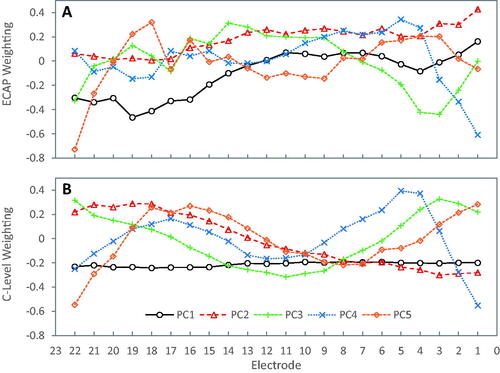
Table 4. Proportions of variance explained by principal components 1–6.
Varimax rotation of the principal component weightings revealed that electrodes 1, 4, 10, 18 and 22 gave consistently high correlations among principal components 1–5 for T-, C- and ECAP threshold levels. This means that in practice levels measured for these five electrodes would produce the best approximation of complete profile. This is then a data driven approach to selecting a reduced number of test electrodes to produce a profile, rather than the equally spaced selection used for Treat-5.
Discussion
Group mean speech recognition scores were not significantly inferior for either electrophysiological based software-guided fitting methods Treat-5 and Treat-22 compared with the standard clinical method employing CustomSound software (CS). Furthermore, Treat-5 and Treat-22 fitting sessions were significantly shorter than for CS, saving about 10 min out of about half an hour on average. Of the 48 subjects included in this study only one may have not been suitable for electrophysiological-based fittings due to the absence of a measurable ECAP threshold with the pulse width used.
Results of the studies by Skinner et al. (Citation1999) implied that the precise T-levels are important for speech perception, especially when set too softly, and absolute T-levels themselves were a predictive factor for speech perception in three studies (de Graaff et al. Citation2020; van der Beek et al. Citation2016; van der Beek, Briaire, and Frijns Citation2015). We found only small average differences in map levels between the fitting methods and thus speech recognition scores would be unlikely to be affected. Some studies with small sample sizes show that precise measuring of T- and C-levels improves performance either compared with the long-term unchanged map (Zinfollino et al. Citation2020) or other methods of finding T-levels (Plesch et al. Citation2019; Rader et al. Citation2018). However, in studies comparing maps with very different T- and C-levels in the same patients, the speech recognition scores did not change by more than 10% (Willeboer and Smoorenburg Citation2006; Smoorenburg, Willeboer, and van Dijk Citation2002). Busby and Arora (Citation2016) found that adjusting T-levels by 30% of the dynamic range didn’t affect speech scores in quiet or noise at soft or loud levels. Similarly, subjects judged the overall comfort of programs as similar between fitting methods. This was confirmed by no significant difference in SSQ quality subscale scores in this study. However, there was a small but significant difference in speech subscale scores favouring the standard CS fitting method over the Treat-5 method (the differences were not significant for the other contrasts). Thus, speech recognition testing in noise or in quiet does not appear as sensitive to changes in sound processor settings in subject-reported measures such as the SSQ.
We attempted to determine whether this subjective difference could be attributed to differences in map T- and C- levels. There were only small differences in mean levels between methods, and in fact the C-levels for the Treat-5 and Treat-22 methods were very similar, although T-levels for Treat-22 were more similar to CS than those for Treat-5 (). Levels also varied across the array in a consistent pattern with no significant change in the profile with fitting method. This at first appears as a surprising result in that Treat-5 levels were based on only five measurements. However, the NFS fitting software incorporates a cubic spline interpolation resulting in profiles across the array which were similar to the Treat-22 ECAP threshold profiles (this was verified for a small selection of individual cases).
A second analysis determined that the fitting method had no effect on the principal components of the map levels. However, a varimax rotation revealed the greatest amount of variation in map levels and ECAP thresholds would be explained by using a slightly different set of five electrodes, for example, 1, 4, 10, 18 and 22 rather than the Treat-5 selection of 1, 6, 11, 16 and 22. Since Treat-5 levels were based upon measurements on these electrodes, there may have been some subjects with sub optimal profiles. Using the electrodes from the varimax analysis would accommodate the more rapid variation in levels across the basal end of the array (electrodes 1–5), as well as the variable results in finding ECAP thresholds on basal electrodes 1, where the Treat-5 algorithm would switch to electrodes 2–4 when an ECAP response was not found. The approach of using either a different reduced ECAP threshold set or increasing the number of electrodes should be investigated further.
Although testing additional electrodes for Treat-5 would likely result in a better approximation to the profile for all 22, the data collected here suggest that the addition of one or two electrodes at the basal end may be as effective; with further slight improvements if the mid-array electrodes were shifted slightly apical. We note that these results might only apply to those electrode array types used in this study and may also be specific to the surgical methods used in our centres.
In summary, we believe that differences on a few electrodes for a few cases may have contributed to the small overall difference in SSQ speech subscale scores seen between Treat-5 and CS, but we acknowledge that the analysis of map levels revealed only a potential mismatch between the profile provided by the Treat-5 method versus using a larger number of test electrodes and/or behavioural measurements with CS.
Clinicians found that all three fitting methods provided adequate controls to adjust map levels and satisfactory fittings in most cases. The Treat-5 method saved 13 min on average compared with the CS method, and 5 min compared with Treat-22. It is possible that a compromise in accuracy and rapidity may be obtained by adding a couple more test electrodes and/or shifting some test electrodes in the Treat-5 method. There were six method-related dropouts with the software-guided fittings. Most (5/6) were from Treat-5 fittings. Reasons given for dropping out were tinnitus, facial nerve stimulation, and poor sound quality. As indicated by the map profile analysis, using either all electrodes as in Treat-22, or using a different small set of test electrodes may improve the fitting. However, any new selection should be tested and compared with the CS method, which offers full parameter flexibility.
Due to the streamlined controls, software-guided fitting may enable CI treatment in a broader context, for example, by less experienced audiologists and clinicians. This could potentially reduce the workload in large clinics. Results with the software-guided methods may also be better than those for CS for inexperienced clinicians and in these cases the time saved in fittings may even be greater as documented in this study where very experienced audiologists performed the mapping.
However, there were some cases where the automatic programming was not ideal. It is important to highlight that more sophisticated programming with options to change pulse width and other parameters will be necessary in complex patients where for example facial nerve stimulation, tinnitus or poor sound quality cause trouble.
The results on speech recognition and subjective performance with the different treatment methods are consistent with existing data in finding no significant treatment effects and validate the software-guided fitting method (Botros, Banna, and Maruthurkkara Citation2013; Vroegop et al. Citation2017). Our results suggest that the new method Treat-22 can be used in the clinical routine without risk and without disadvantages for the patients, with recourse to standard manual CS techniques for challenging cases.
Acknowledgments
Statistical analysis was performed by Dominik H. Pfluger (Zurich, Switzerland). Chris James of Cochlear France provided additional analysis of map levels and edited the manuscript.
Disclosure statement
Authors N. Neben and F. Junge are employees of Cochlear Deutschland GmbH & Co. KG; manufacturer of Nucleus cochlear implants. The other authors declare no conflict of interest.
Additional information
Funding
References
- Bates, D., M. Mächler, B. Bolker, and S. Walker. 2015. “Fitting Linear Mixed-Effects Models Using lme4.” Journal of Statistical Software 67 (1): 1–48. http://www.jstatsoft.org/v67/i01/.
- Botros, A., R. Banna, and S. Maruthurkkara. 2013. “The Next Generation of Nucleus(®) Fitting: A Multiplatform Approach Towards Universal Cochlear Implant Management.” International Journal of Audiology 52 (7): 485–494. doi:10.3109/14992027.2013.781277.
- Botros, A., and C. Psarros. 2010. “Neural Response Telemetry Reconsidered: I. The Relevance of ECAP Threshold Profiles and Scaled Profiles to Cochlear Implant Fitting.” Ear and Hearing 31 (3): 367–379. doi:10.1097/AUD.0b013e3181c9fd86.
- Brand, T., and B. Kollmeier. 2002. “Efficient Adaptive Procedures for Threshold and Concurrent Slope Estimates for Psychophysics and Speech Intelligibility Tests.” The Journal of the Acoustical Society of America 111 (6): 2801–2810. doi:10.1121/1.1479152.
- Brown, C. J., M. L. Hughes, B. Luk, P. J. Abbas, A. Wolaver, and J. Gervais. 2000. “The Relationship between EAP and EABR Thresholds and Levels Used to Program the Nucleus 24 Speech Processor: Data from Adults.” Ear and Hearing 21 (2): 151–163. doi:10.1097/00003446-200004000-00009
- Busby, P. A., and K. Arora. 2016. “Effects of Threshold Adjustment on Speech Perception in Nucleus Cochlear Implant Recipients.” Ear and Hearing 37 (3): 303–311. http://journals.lww.com/00003446-201605000-00007. doi:10.1097/AUD.0000000000000248.
- Craddock, L., H. Cooper, P. van de Heyning, K. Vermeire, M. Davies, J. Patel, H. Cullington, et al. 2003. “Comparison Between NRT-Based MAPs and Behaviourally Measured MAPs at Different Stimulation Rates-A Multicentre Investigation.” Cochlear Implants International 4 (4): 161–170. doi:10.1179/cim.2003.4.4.161.
- de Graaff, Feike, Birgit I. Lissenberg-Witte, Marre W. Kaandorp, Paul Merkus, S. Theo Goverts, Sophia E. Kramer, Cas Smits, et al. 2020. “Relationship Between Speech Recognition in Quiet and Noise and Fitting Parameters, Impedances and ECAP Thresholds in Adult Cochlear Implant Users.” Ear and Hearing 41 (4): 935–947. doi:10.1097/AUD.0000000000000814.
- de Vos, Johan J., Jan Dirk Biesheuvel, Jeroen J. Briaire, Pieter S. Boot, Margriet J. van Gendt, Olaf M. Dekkers, Marta Fiocco, et al. 2018. “Use of Electrically Evoked Compound Action Potentials for Cochlear Implant Fitting: A Systematic Review.” Ear and Hearing 39 (3): 401–411. http://journals.lww.com/00003446-201805000-00001. doi:10.1097/AUD.0000000000000495.
- Gajadeera, E. A., K. L. Galvin, R. C. Dowell, and P. A. Busby. 2017a. “Investigation of Electrical Stimulation Levels Over 8 to 10 Years Postimplantation for a Large Cohort of Adults Using Cochlear Implants.” Ear & Hearing 38 (6): 736–745. http://journals.lww.com/00003446-201711000-00011. doi:10.1097/AUD.0000000000000466.
- Gajadeera, E. A., K. L. Galvin, R. C. Dowell, and P. A. Busby. 2017b. “The Change in Electrical Stimulation Levels during 24 Months Postimplantation for a Large Cohort of Adults Using the Nucleus® Cochlear Implant.” Ear and Hearing 38 (3): 357–367. http://journals.lww.com/00003446-201705000-00009. doi:10.1097/AUD.0000000000000405
- Gatehouse, S., and W. Noble. 2004. “The Speech, Spatial and Qualities of Hearing Scale (SSQ).” International Journal of Audiology 43 (2): 85–99. http://www.ncbi.nlm.nih.gov/pubmed/15035561. doi:10.1080/14992020400050014.
- Hahlbrock, K. H. 1957. Sprachaudiometrie. Grundlagen und praktische Anwendung einer Sprachaudiometrie für das deutsche Sprachgebiet. Stuttgart: Thieme.
- Henkin, Yael, Ricky Kaplan-Neeman, Jona Kronenberg, Lela Migirov, Minka Hildesheimer, and Chava Muchnik. 2006. “A Longitudinal Study of Electrical Stimulation Levels and Electrode Impedance in Children Using the Clarion Cochlear Implant.” Acta oto-laryngologica 126 (6): 581–586. doi:10.1080/00016480500443391.
- Henkin, Y., R. Kaplan-Neeman, C. Muchnik, J. Kronenberg, and M. Hildesheimer. 2003. “Changes over Time in the Psycho-Electric Parameters in Children with Cochlear Implants: Cambios en el tiempo, de los parámetros psico-eléctricos en niños con implante coclear.” International Journal of Audiology 42 (5): 274–278. doi:10.3109/14992020309078346.
- Hey, M., T. Hocke, J. Hedderich, and J. Müller-Deile. 2014. “Investigation of a Matrix Sentence Test in Noise: Reproducibility and Discrimination Function in Cochlear Implant Patients.” International Journal of Audiology 53 (12): 895–902. doi:10.3109/14992027.2014.938368.
- Incerti, Paola V., Teresa Y. C. Ching, Sanna Hou, Patricia Van Buynder, Christopher Flynn, and Robert Cowan. 2018. “Programming Characteristics of Cochlear Implants in Children: effects of Aetiology and Age at Implantation.” International Journal of Audiology 57 (sup2): S27–S40. doi:10.1080/14992027.2017.1370139
- Kaiser, H. F. 1958. “The Varimax Criterion for Analytic Rotation in Factor Analysis.” Psychometrika 23 (3): 187–200. doi:10.1007/BF02289233.
- Kießling, J., L. Grugel, H. Meister, and M. Meis. 2011. “Übertragung der Fragebögen SADL, ECHO und SSQ ins Deutsche und deren Evaluation [German Translations of Questionnaires SADL, ECHO and SSQ and Their Evaluation]”. Zeitschrift für Audiologie 50 (1): 6–16.
- Kuznetsova, A., P. B. Brockhoff, and R. H. B. Christensen. 2017. “Package: Tests in Linear Mixed Effects Models.” Journal of Statistical Software 82 (13): 1–26.
- Lehnhardt, E., and R. Laszig. 2009. Praxis der Audiometrie. 9. Aufl. Thieme: Stuttgart.
- Lenth, R. 2019. emmeans: Estimated Marginal Means, aka Least-Squares Means. https://cran.r-project.org/package=emmeans.
- Mosca, F., R. Grassia, and C. A. Leone. 2014. “Longitudinal Variations in Fitting Parameters for Adult Cochlear Implant Recipients.” Acta otorhinolaryngologica Italica : organo ufficiale della Societa italiana di otorinolaringologia e chirurgia cervico-facciale 34 (2): 111–116.
- Müller-Deile, J. 2009. Verfahren zur Anpassung und Evaluation von Cochlear Implant Sprachprozessoren [Procedures for Fitting and Evaluation of Cochlear Implant Speech Processors]. Heidelberg: Median Verlag.
- Pedley, Karen, Colleen Psarros, Kirsty Gardner-Berry, Alison Parker, Suzanne C. Purdy, Pam Dawson, Kerrie Plant, et al. 2007. “Evaluation of NRT and Behavioral Measures for MAPping Elderly Cochlear Implant Users.” International Journal of Audiology 46 (5): 254–262. doi:10.1080/14992020601014979.
- Plant, Kerrie, Mary-Ann Law, Lesley Whitford, Michelle Knight, Sylvia Tari, Jaime Leigh, Karen Pedley, et al. 2005. “Evaluation of Streamlined Programming Procedures for the Nucleus Cochlear Implant with the Contour Electrode Array.” Ear and Hearing 26 (6): 651–668. http://journals.lww.com/00003446-200512000-00011. doi:10.1097/01.aud.0000188201.86799.01
- Plesch, J., B. P. Ernst, S. Strieth, and T. Rader. 2019. “A Psychoacoustic Application for the Adjustment of Electrical Hearing Thresholds in Cochlear Implant Patients.” PLoS One 14 (10): e0223625. doi:10.1371/journal.pone.0223625.
- Potts, L. G., M. W. Skinner, B. D. Gotter, M. J. Strube, and C. A. Brenner. 2007. “Relation between Neural Response Telemetry Thresholds, T- and C-Levels, and Loudness Judgments in 12 Adult Nucleus 24 Cochlear Implant Recipients.” Ear & Hearing 28 (4): 495–511. http://journals.lww.com/00003446-200708000-00007. doi:10.1097/AUD.0b013e31806dc16e.
- R Core Team. 2017. R: A Language and Environment for Statistical Computing. https://www.r-project.org/.
- Rader, Tobias, Philipp Doms, Youssef Adel, Tobias Weissgerber, Sebastian Strieth, and Uwe Baumann. 2018. “A Method for Determining Precise Electrical Hearing Thresholds in Cochlear Implant Users.” International Journal of Audiology 57 (7): 502–509. doi:10.1080/14992027.2017.1412519.
- Raghunandhan, S., A. Ravikumar, M. Kameswaran, K. Mandke, and R. Ranjith. 2014. “A Clinical Study of Electrophysiological Correlates of Behavioural Comfort Levels in Cochlear Implantees.” Cochlear Implants International 15 (3): 145–160. doi:10.1179/1754762814Y.0000000064
- Seyle, K., and C. J. Brown. 2002. “Speech Perception Using Maps Based on Neural Response Telemetry Measures.” Ear and Hearing 23 (1 Suppl): 72S–79S. doi:10.1097/00003446-200202001-00009
- Skinner, M. W., L. K. Holden, T. A. Holden, and M. E. Demorest. 1999. “Comparison of Two Methods for Selecting Minimum Stimulation Levels Used in Programming the Nucleus 22 Cochlear Implant.” Journal of Speech, Language, and Hearing Research : JSLHR 42 (4): 814–828. doi:10.1044/jslhr.4204.814.
- Smoorenburg, G. F., C. Willeboer, and J. E. van Dijk. 2002. “Speech Perception in Nucleus CI24M Cochlear Implant Users With Processor Settings Based on Electrically Evoked Compound Action Potential Thresholds.” Audiology & Neuro-Otology 7 (6): 335–347. https://www.karger.com/Article/FullText/66154. doi:10.1159/000066154.
- Thai-Van, Hung, Eric Truy, Basile Charasse, Florent Boutitie, Jean-Marc Chanal, Nadine Cochard, Jean-Pierre Piron, et al. 2004. “Modeling the Relationship Between Psychophysical Perception and Electrically Evoked Compound Action Potential Threshold in Young Cochlear Implant Recipients: Clinical Implications for Implant Fitting.” Clinical Neurophysiology : Official Journal of the International Federation of Clinical Neurophysiology 115 (12): 2811–2824. https://linkinghub.elsevier.com/retrieve/pii/S1388245704003025. doi:10.1016/j.clinph.2004.06.024
- van der Beek, F. B., J. J. Briaire, and J. H. M. Frijns. 2015. “Population-Based Prediction of Fitting Levels for Individual Cochlear Implant Recipients.” Audiology and Neurotology 20 (1): 1–16. https://www.karger.com/Article/FullText/362779. doi:10.1159/000362779.
- van der Beek, F. B., J. J. Briaire, K. S. van der Marel, B. M. Verbist, and J. H. M. Frijns. 2016. “Intracochlear Position of Cochlear Implants Determined Using CT Scanning Versus Fitting Levels: Higher Threshold Levels at Basal Turn.” Audiology and Neurotology 21 (1): 54–67. https://www.karger.com/Article/FullText/442513. doi:10.1159/000442513.
- van Dijk, Bas, Andrew M. Botros, Rolf-Dieter Battmer, Klaus Begall, Norbert Dillier, Matthias Hey, Wai Kong Lai, et al. 2007. “Clinical Results of AutoNRT a Completely Automatic ECAP Recording System for Cochlear Implants.” Ear and Hearing 28 (4): 558–570. doi:10.1097/AUD.0b013e31806dc1d1
- Vargas, J. L., M. Sainz, C. Roldan, I. Alvarez, and A. de la Torre. 2012. “Long-Term Evolution of the Electrical Stimulation Levels for Cochlear Implant Patients.” Clinical and Experimental Otorhinolaryngology 5 (4): 194–200. doi:10.3342/ceo.2012.5.4.194
- Vroegop, J. L., J. G. Dingemanse, M. P. van der Schroeff, R. M. Metselaar, and A. Goedegebure. 2017. “Self-Adjustment of Upper Electrical Stimulation Levels in CI Programming and the Effect on Auditory Functioning.” Ear and Hearing 38 (4): e232–e240. http://journals.lww.com/00003446-201707000-00015. doi:10.1097/AUD.0000000000000404
- Wagener, K., T. Brand, and B. Kollmeier. 1999. “Entwicklung und Evaluation eines Satztestes in deutscher Sprache III: Evaluation des Oldenburger Satztests.” Zeitschrift für Audiologie 38: 86–95.
- Walravens, Els, Deborah Mawman, and Martin O’Driscoll. 2006. “Changes in Psychophysical Parameters During the First Month of Programming the Nucleus Contour and Contour Advance Cochlear Implants.” Cochlear Implants International 7 (1): 15–32. doi:10.1179/cim.2006.7.1.15.
- Willeboer, C., and G. F. Smoorenburg. 2006. “Comparing Cochlear Implant Users??? Speech Performance with Processor Fittings Based on Conventionally Determined T and C Levels or on Compound Action Potential Thresholds and Live-Voice Speech in a Prospective Balanced Crossover Study.” Ear Hear 27 (6): 789–798. http://journals.lww.com/00003446-200612000-00016. doi:10.1097/01.aud.0000240811.67906.55
- Zinfollino, M., C. Cariddi, A. Ardito, M. Casulli, and P. Malerba. 2020. “Long-Term Evolution of the Electrical Stimulation for Cochlear Implant Adult Patients. The Role of a Progressive Adaptation Method.” Acta Otolaryngol 140 (2): 122–127. doi:10.1080/00016489.2019.1700303.