
Abstract
Objective
This study used the multi-level Tracking of Noise Tolerance (TNT) test to compare Augmented Focus (AF) or split processing over non-AF processing with adaptive directionality (non-AF-dirm) and with an omnidirectional microphone (non-AF-omni).
Design
This was a single-blind, within-subject repeated measures design.
Study sample
Nineteen listeners with a mild-to-moderate hearing loss. The listeners’ task was to determine their tolerable noise level (TNL) in the sound-field at four fixed speech levels (i.e. 62, 68, 75, and 85 dB SPL) in the unaided condition and the different aided conditions. The speech passages were presented from 0° while a continuous speech-shaped noise was presented from 180°. Each condition was tested twice, each in a different counterbalanced order.
Results
AF improved TNL by an average of 2.9 dB over non-AF-dirm. Adaptive directionality improved the aided TNL by 4.7 dB over the non-AF-omni condition. The unaided TNL was similar to the aided non-AF-omni TNL. Whereas a stable TNL was reached in 20–30 s for non-AF-dirm, it took AF < 15 s to reach a stable TNL at all input levels.
Conclusions
This study shows that AF allowed 2.9 dB of signal-to-noise ratio (SNR) improvement over that of non-AF-dirm and 7.6 dB over the aided non-AF-omni condition.
Introduction
Communication in noise is a major challenge for listeners with a hearing loss. Noise masks the audibility of primitive cues used in auditory scene analysis (ASA, Bregman Citation1990) and degrades identification of auditory objects. Noise also adds to the listeners’ annoyance of the listening situations (Cohen and Weinstein Citation1981) and compromises ease of communication. Modern hearing aids (HAs) address this speech-in-noise (SIN) problem using technologies such as directional microphones (DIRMs) and noise reduction (NR) algorithms. Whereas DIRMs work on the assumption of spatial separation between speech and noise sources, NR algorithms use differences in modulation characteristics and the assumption of spectral separation between speech and noise signals to minimise the effect of noise (Chung Citation2004). In traditional HA designs, sounds are first processed by the microphone system followed by compression and NR. Because current microphone systems only provide a single signal stream on which NR and compressor may act, the same compression and NR setting will be applied to the post-microphone signals regardless of any spatial separation between the speech and noise signals in the original input. This design limits possible further improvements to the final SNR. For example, a compressor cannot increase gain for a soft speech signal originating from the front while simultaneously reducing gain for loud noise originating from the back. Similarly, NR cannot selectively reduce the gain in frequency channels determined to be noisy without also affecting the gain applied to speech frequencies that overlap with those channels, even if speech and noise sources are spatially separated.
A solution to the difficulty may be sought from multichannel audio recording. When recording live musical performances where multiple sources are present, e.g. a singer and her band, it is desirable to have microphones placed close to each source so that the singing can be recorded separately from the instruments. This way, the recording engineer can apply different amounts of gain to each source in order to achieve a good mix/contrast between the individual elements of the performance. If only one microphone was used to capture both the singer and the band, then processing such a recording to balance the individual sources would be difficult. For this reason, multi-source recording is the preferred mode of recording in complex situations with multiple signal sources so that split processing, or independent processing for different signal sources, is possible.
Recently, Signia applied split processing as part of its Augmented Focus (AF) signal processing in its Signia AX device to further enhance the contrast between target speech and background sounds beyond what can be achieved from adaptive DIRMs alone (Signia Citation2021). In AF, dual microphones on the hearing aid are configured to yield different polar patterns for capturing the front and back sound sources. The output signals from the front and back hemispheres are then processed separately across 48 frequency channels using an independent set of compression and NR settings. For example, signals from the front source may be provided with more linear gain and less NR to enhance their salience, while signals from the back source may be provided with more compression and more aggressive NR. Afterwards, the outputs of the two processing streams are summed to create the final output. Thus, signals from the front will be more contrasted against the sounds of the listener’s surroundings, thereby improving the SNR for spatially separated signals and potentially improving the wearer’s SIN performance over that of single stream adaptive DIRM. In this Methods section, we provide KEMAR measurements showing 3–9 dB SNR improvements offered by AF processing over adaptive directionality depending on the speech level and the SNR.
The SNR improvements offered by AF may be demonstrated in test configurations where there is spatial separation between speech and noise sources, like those used in the evaluation of DIRMs. Recent research suggests that in addition to speech understanding, SIN problems may also be related to subjective comfort, increased listening effort, cognitive factors (such as the listener’s working memory capacity), and/or emotional reactions to communication in noise (Pichora-Fuller et al. Citation2016). These factors may be the result of poor speech intelligibility, or they may be independent of speech intelligibility. In order to ensure that one can detect performance changes in noise from HAs, one may include outcome measures that allow the listeners to apply their own criteria in the judgement of efficacy. In that regard, a measure of noise acceptance may be desirable because the criteria listeners use to judge noise acceptance likely include all that are relevant (such as intelligibility, comfort, distraction and annoyance) in a communication situation. Such inclusion likely increases the measure’s sensitivity to reflect changes in intervention. Most importantly, this measure may predict and reflect real-world HA satisfaction (Nabelek et al. Citation2006; Seper et al. Citation2019).
The Acceptable Noise Level (ANL) test proposed by Nabelek, Tucker, and Letowski (Citation1991) is one such noise acceptance measure. Mackersie et al. (Citation2021) showed that normal hearing listeners used different weightings of annoyance, distraction, loudness and speech interference in reaching their ANL. Indeed, the ANL has been used as a measure to demonstrate the efficacy of DIRM and NR systems. For example, Freyaldenhoven et al. (Citation2005) reported a 3.5 dB improvement on the ANL from a DIRM while Peeters et al. (Citation2009) showed a DIRM improvement of 4.0 dB. Mueller, Weber, and Hornsby (Citation2006) showed that a combined modulation-based and fast NR algorithm improved the ANL by 4.2 dB over the no-NR condition. Peeters et al. (Citation2009) reported a 2.5 dB improvement from a NR system when the HA was in the omnidirectional mode and 0.6 dB when it was in the directional mode. Wu and Stangl (Citation2013) reported that wide dynamic range compression (WDRC) worsened ANL by 1.5 dB, while NR and DIRM improved ANL by 1.1 and 2.8 dB, respectively.
A potential limitation of the ANL is that noise acceptance is only evaluated at one point in time, and only when speech was presented at the most comfortable listening (MCL) level. In real-life, speech occurs at various input levels. In addition, many present-day HA signal processing algorithms (such as those used in adaptive directionality and sound classification) activate and stabilise to the input levels at different rates. Thus, using ANL (or SIN tests) to evaluate the effect of signal processing, while allowing one to glimpse the magnitude of the effect during the steady state, often misses the temporal information that reflects adaptive processing. While there were studies that measure ANL at multiple input levels, few examined the efficacy of specific HA processing. Measuring noise acceptance over time at multiple input levels could provide additional insights into the efficacy of HAs that engage in a level dependent manner.
Previously, we used the Tracking of Noise Tolerance (TNT) test to measure a listener’s willingness to accept (i.e. tolerate) background noise while trying to follow speech (Seper et al. Citation2019). The TNT was inspired by the ANL but incorporates two notable changes. First, testing occurs at fixed speech levels (e.g. 82 dB SPL) rather than at the MCL. This eliminates a source of variability in the measurement. Second, rather than measuring the background noise level (BNL) at a single point in time, the tolerable noise level (TNL) is ‘tracked’ for 2 min. Tracking provides temporal information on how listeners’ noise acceptance changes over time, mediated by changes in the action of the signal processing algorithm under evaluation. For example, Kuk et al. (Citation2017) used the TNT to compare how quickly two different NR algorithms reached a steady processing state. Furthermore, averaging the TNL over 2 min also minimises random fluctuations in loudness judgement that can reduce the reliability of noise acceptance measures. Indeed, Kuk et al. (Citation2017) reported that the 95% confidence interval (CI) between test-retest measured by the TNT was less than 2 dB, while the magnitudes of improvement offered by DIRM and NR algorithms were similar to those observed using ANL measures.
In this study, we measured the efficacy of AF processing over non-AF processing using the TNT test at several fixed speech input levels. Testing at multiple input levels should provide insight into how noise acceptance changes over a range of natural vocal efforts. It could also foster a better understanding of how speech input levels affect AF processing. Specifically, we compared the static and dynamic changes to TNL that result from AF over non-AF omnidirectional (non-AF-omni) and adaptive DIRM (non-AF-dirm) processing. We also examined if unaided noise acceptance could predict aided noise acceptance and benefit of directional processing. A relationship between aided and unaided performance suggests that noise acceptance is a differentiative listener trait while a relationship between unaided and aided benefit suggests the usefulness of unaided noise acceptance in predicting listeners’ receptivity to noise mitigation technologies.
Methods
Participants
A power analysis was conducted using GLIMMPSE web-based sample size software (Kreidler et al. Citation2013) for calculating power in linear mixed effects models. This analysis determined that a sample of 18 participants would power the study at 80% to detect a significant interaction of HA condition and speech levels given the TNT mean and variance measured in three normal hearing pilot subjects.
Nineteen hearing-impaired listeners (11 females) participated. Their average age was 70.5 years (SD = 13.3 years; range = 37–84 years). All but two participants had a symmetrical (±10 dB) sloping mild-to-moderately severe sensorineural hearing loss. The two participants had asymmetry at some frequencies that reached 20 dB. The average audiograms of the participants (along with standard deviation and maximum/minimum thresholds) are shown in . All participants were native speakers of US English and passed cognitive screening (average score = 27.3) on the Montreal Cognitive Assessment test (MoCA, Nasreddine et al. Citation2005). shows that all but three participants were current hearing aid wearers with an average usage of 18 years. Daily HA usage (hours of wear) ranged from 4 h/day to 16 h/day with an average usage of 11.6 h/day. Only 4 participants used their own HAs for less than 10 h/day. Overall satisfaction for participants’ own HAs in noisy conditions averaged 3 (out of 5, acceptable/neutral). The study was approved by an external, independent Institution Review Board. All participants provided informed consent and were financially compensated for their participation.
Figure 1. Average participant audiogram (n = 19) for the left (black exes) and right ears (grey circles). Error bars represent one standard deviation of the mean. The maximum and minimum thresholds were shown in dotted and dashed lines respectively.
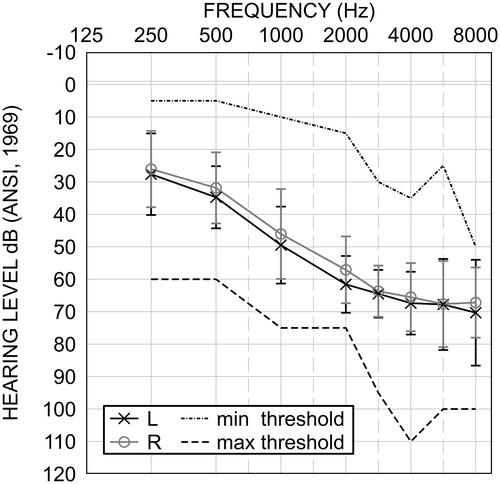
Table 1. Summary of participant demographics and hearing aid experience.
Hearing aids
Because AF processing is integrated within the Signia AX HA (i.e. always active), its action cannot be studied separately. Instead, we compared a full-feature receiver-in-canal version of the Signia AX with a version that did not have AF. The AF HA shares all the existing features found on the non-AF HA, but it also includes an adjustment to pinna effect compensation, binaural jitter elimination, a reduction of binaural link latency and a new analog-to-digital converter. These differences should not affect the current comparison because all binaural features were deactivated and stimuli were presented at levels substantially below input saturation. The microphone system, compression and noise reduction were identical between the AF and non-AF HAs.
Both the AF and non-AF HAs use motion sensors at the input stage that sense the wearer’s motion along with the acoustic signals. Data from the motion sensors help to classify the acoustic signals (e.g. speech in quiet, SIN, etc.) in order to decide how the microphone system should be configured and/or how much compression and NR to apply. The classifier samples the overall sound level, SNR, source location, signal modulation, own voice level, and wearer motion to identify the sound class. Because the participants were seated in a booth and were instructed not to move their heads during the test, the acoustic-motion sensor would be effectively deactivated.
The non-AF HA was used with a standard omnidirectional microphone without compensation for the pinna effect (non-AF-omni), and in an automatic adaptive DIRM mode (non-AF-dirm) that switches between omnidirectional and directional processing to track a moving noise source (Ricketts, Hornsby, and Johnson Citation2005). All directional processing features that required binaural wireless transmission were not activated.
The study HA is a multichannel WDRC hearing aid that utilises both input and output compression with compression ratios typically below 4:1 and adaptive release times. Two simultaneously operating NR algorithms are used. One is a modulation-based algorithm that reduces gain in channels where the dominant signal is relatively steady (i.e. no modulation). The second is an adaptive fast-acting NR filter system (Wiener filter) that tracks the signal envelope and calculates the SNR to update the filter coefficient within each channel. Both systems operate continuously based on the overall levels and SNRs. The NR algorithms were enabled in all HA conditions (non-AF and AF).
In the non-AF mode, input signals (speech and noise) shaped by the polar pattern of the dual microphone system are processed by a single processor with a specified amount of compression (dependent on overall level in each channel) and NR (dependent on SNR and level in each channel). In the AF mode, the same dual microphone set-up in each hearing aid results in a different directional polar pattern for sounds from the front hemisphere and sounds from the back hemisphere. Signals (whether speech or noise) from each hemisphere are processed separately using an independent set of compression and NR settings before being summed.
The SNR benefit of AF and non-AF-dirm processing over non-AF-omni processing was estimated electro-acoustically via KEMAR measurement using the International Speech Test Signal (ISTS, Holube et al. Citation2010) as the speech source presented in front and the International Female Noise (EHIMA Citation2016) that has the same long-term average spectrum as the ISTS placed 1 m behind KEMAR. The hearing aids were programmed with N3 standard hearing loss (Bisgaard, Vlaming, and Dahlquist Citation2010) using NAL-NL2 fitting rationale. Speech levels at 62, 68, 75, and 85 dB SPL were used, each at SNRs between −10 and +10 dB in 5 dB step for each hearing aid condition. The phase inversion technique described by Hagerman and Olofsson (2004) was used to estimate the long-term root-mean-square levels of the speech and noise at 1/3 octave bands with centre frequencies from 160 Hz to 8000 Hz. The narrowband output SNRs were averaged across frequency bands to obtain a single SNR index for each HA and test condition. SNR benefit was quantified as the difference between output SNR measured with AF and non-AF-dirm to that of the non-AF-omni condition. shows such SNR benefit across the SNR range at each speech level.
Figure 2. Electroacoustic signal-to-noise ratio (SNR) benefits of AF and non-AF-dirm conditions over the non-AF-omni condition (reference) across SNRs from −10 to +10 dB at speech levels of 62, 68, 75, and 85 dB SPL.
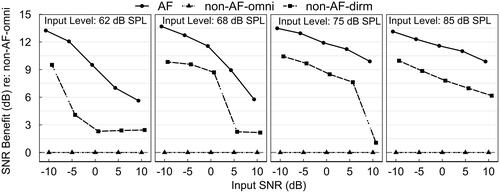
shows that the acoustic SNR benefit of the non-AF-dirm condition ranged from 1 to 10 dB across input levels, decreasing as input SNR increased. This reflects the ideal condition when a single noise source is placed at the null of the polar pattern within the critical distance. The SNR benefit of AF ranged from 6 to 14 dB across input levels, decreasing as the SNR of the listening condition increased. The SNR advantage of AF over non-AF-dirm ranged from 3 to 9 dB depending on the specific speech level and SNR. These observations suggest that AF processing may yield SNR benefits over non-AF conditions on behavioural tasks such as the TNT and SIN tests.
Hearing aid fitting
The study hearing aids were fitted using Connexx software (version 9.4.0.255). Participants wore the study hearing aids in a bilateral mode using instant-fit closed ear domes. Coupler output was matched between the two study hearing aids to the NAL-NL2 target using the ISTS (Holube et al. Citation2010) at 50, 65, and 80 dB SPL with all adaptive features deactivated. No fine-tuning was performed. Listeners were tested in unaided and aided conditions. In the aided conditions, listeners were tested in the non-AF-omni and non-AF-dirm modes with NR enabled. The aided conditions also tested the AF hearing aid which included adaptive directionality and NR. The order of testing the different aided conditions was counterbalanced across participants who remained blind to the HA conditions.
TNT test stimulus
Briefly, the TNT test (Seper et al. Citation2019) included seven 2-min speech passages on different topics (e.g. movies, birds, music) read by a male talker recorded at our laboratory. These materials were made for a fifth-grade level as assessed by the Flesch-Kincaid Grade Level scale (Kincaid et al. Citation1975). The talker spoke at a monitored, normal vocal effort at a rate of about 4 syllables/s. Each passage was normalised to have a similar root-mean-square level throughout the passage. Excessive pauses were removed from the passages. The passages were filtered to create ‘normal’, ‘raised’, ‘loud’, and ‘shouted’ versions using the SII Standards (ANSI S3.5 1997). This involved applying the difference between the normal vocal effort spectrum and the spectra of the other vocal efforts described in the Standards to the normal speech file at one-third octave bands using a custom filter made in Adobe Audition. The overall levels of the speech stimuli were calibrated to 62, 68, 75, and 85 dB SPL representing normal, raised, loud, and shouted speech, respectively (Pearsons, Bennett, and Fidell Citation1977). An ICRA (International Collegium of Rehabilitative Audiology; Dreschler et al. Citation2001) continuous speech-shaped noise was used as the masking stimulus at all speech levels. The noise stimulus was normalised to have the same peak RMS as the speech passages measured by sliding a 50 ms rectangular window across the stimuli and noting the maximum value.
For a given trial, the TNT test software presented a speech passage at one constant level. The initial noise level was set at 10 dB below the speech level. The ongoing background noise level automatically increased by 1 dB/s until the listener pressed the spacebar on a keyboard. This decreased the noise level at the same rate. Once the spacebar was released, the noise level increased again. The rate of noise level change was reduced to 0.5 dB/s after the first 6 reversals. Each tracking trial lasted two minutes. Speech passages and test levels were counterbalanced across participants and test conditions.
Equipment and setup
Testing was performed in a double-wall sound-treated booth (Industrial Acoustics, 3 m × 3 m × 2 m). A GSI-61 audiometer and TDH-50 supra-aural headphones were used for audiometric measurements. The TNT test software was implemented for the Microsoft Windows operating system. The TNT program was developed using VB.net programming language to deliver the stimuli (speech and noise), prompt the participants, and sample the participants’ TNLs. A Niles amplifier and Focusrite 18i20 sound card delivered test stimuli to a pair of KRK ST6 loudspeakers (frequency response from 62 Hz to 20,000 Hz, ±2 dB) placed at 0° (speech) and 180° (noise), with the participants seated in between the two loudspeakers at a distance of one metre. The centre of the loudspeaker driver was 107 cm above the floor.
Procedure
The listeners’ task was to determine their TNLs in the sound-field at the four fixed speech levels as tested in the different conditions. Listeners were trained on the TNL task prior to the actual testing using the following instructions (Seper et al. Citation2019).
You will hear some noise in the background while you listen to the male talker. The noise will automatically get louder. I want you to monitor the noise level and maintain the loudest noise level you can put up with while still understanding 90% of the words in the story. If the noise becomes too loud, where you can no longer put up with it or understand less than 90% of the words in the story, you can turn the noise down by pressing and holding the space bar. If it appears softer than before, you should allow the volume to increase by letting go of the space bar. If it is louder than before, you should turn the volume down to keep at the same level by pressing the space bar again. Your ability to understand speech should never change to below 90%. The test will run for two minutes and then stop.
Listeners’ unaided TNL was always tested first at the four speech levels in a random order. Because of the severity of the participants’ hearing losses, unaided TNLs were measurable only in 9 participants at speech input level of 62 dB SPL, 12 participants at input level of 68 dB SPL, and 16 participants at input level of 75 dB SPL. All 19 participants were able to perform the unaided TNL at the 85 dB SPL input level. Each appropriate input level was tested once in the unaided mode. This was followed by the aided TNL for each HA condition with the order of HA conditions and input levels counterbalanced across participants. Each combination of HA and input level condition was retested in another counterbalanced order. After retest of the HA conditions, the unaided TNL was retested at the participant-appropriate speech levels. Each participant took approximately 2 h to complete testing.
Analysis
Individual TNL tracings were averaged across test and retest for each test condition. Slopes corresponding to the first 30 s of TNL tracings were calculated based on linear least-squares fits. The TNT scores were calculated by subtracting the speech input level from the average TNL tracked between 30 s and 120 s relative to test onset. In this way, TNT scores reflect noise-to-signal ratios (NSRs) where greater values indicate greater noise acceptance. Linear mixed-effects (LME) models analysis (Ime4, Bates et al. Citation2015) was used to assess the fixed effects of hearing aid condition (4 levels: unaided, AF, non-AF-omni, and non-AF-dirm) and speech input level (4 levels: 62, 68, 75, and 85 dB SPL), as well as their interaction, on TNL Slopes and TNT Scores, separately. In addition, two separate LME analyses were performed to assess whether participants’ AIDED TNT scores could be predicted by the fixed effect of UNAIDED TNT scores and whether UNAIDED TNT scores measured at a speech input level of 85 dB SPL could predict aided TNT benefit from AF/non-AF dirm processing. In all analyses, study participants were modelled as random effects. In the latter two LMEs, hearing aid condition, and speech input level were modelled as blocking variables to account for TNT variance related to the test conditions. Visual inspection of residual plots confirmed no obvious deviations from homoscedasticity or normality in either of the analyses. P-values were obtained by Wald tests (Type II SS) of linear hypotheses using the Chi-square statistic.
Results
Average TNL tracking over time
plots the average TNL tracking functions over time (2 min) for each of the four HA conditions and input levels. Two observations are immediate. First, the tracking functions stablized within 1 dB after 30 s for all HAs and input levels conditions. Second, differences in the rate of TNL change among HA conditions, reported as the slope of the TNL function in , were most noticeable before 30 s. The magnitude of the slope reflects how quickly listeners responded to the results of the different processing conditions consequent to the increasing noise levels. In the unaided and non-AF-omni condition, because of the closeness between the starting level and the final TNL, listeners were quick to decrease the noise, resulting in a shallow TNL slope of <0.1 dB/s. On the other hand, listeners permitted the noise to increase further before responding in the directional modes, leading to steeper slopes measured for the non-AF-dirm (0.2 dB/s) and the AF (about 0.3 dB/s) conditions. In most cases, as the input level increased, the slopes decreased.
Figure 3. Tolerable Noise Level (TNL) tracings measured over the 2-min session as averaged across participants and tests/retests. Tracings are plotted for each HA condition (line types) at each speech input level (rows/panels).
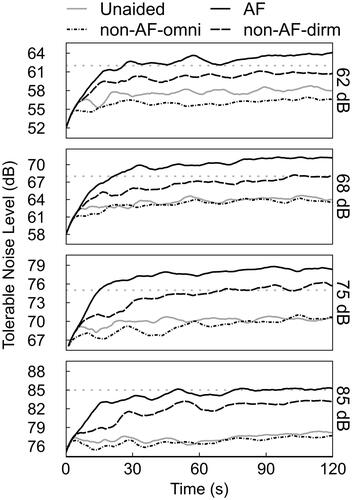
Figure 4. Average slopes (dB/s) of the TNL trace as calculated with linear least-squares fits of the first 30s of testing.
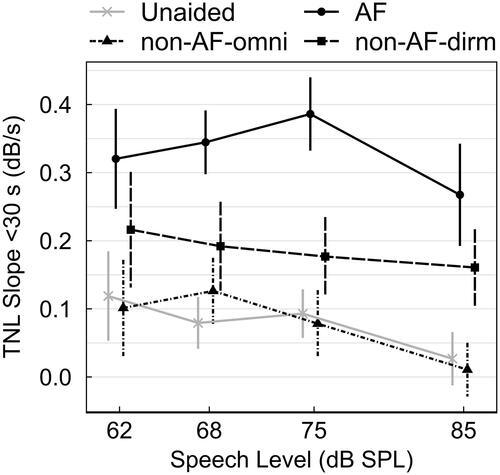
Linear mixed effects analysis confirmed a significant effect of hearing aid condition (χ2(3) = 228.35, p < 0.001) and speech input level (χ2(3) = 19.05, p < 0.001) on the slope of listeners’ TNL. There was no significant interaction of the two fixed effects. Post-hoc analysis of the estimated marginal means indicated that TNL slopes were significantly steeper for the AF condition compared to all other conditions (p < 0.001) and for the non-AF-dirm condition compared to the non-AF-omni or unaided conditions (p < 0.001). Slopes measured for non-AF-omni and unaided conditions did not differ significantly from one another. Across speech levels, post-hoc tests indicated that TNL slopes were significantly shallower at the 85 dB SPL input level compared to all other input levels (p < 0.001).
Average TNT for each HA by level condition
shows the averaged TNT performance across input levels for each HA condition where higher TNT values reflect greater noise acceptance (The individual functions are shown in the Supplementary Figure 1). Averaging across input levels, unaided yielded a TNT of −4.6 dB and non-AF-omni yielded a TNT of −6 dB. The average TNT for the aided non-AF-dirm was −1.3 dB whereas the TNT for the AF condition was 1.6 dB. Thus, the advantage of non-AF-dirm averaged 4.7 dB over that of non-AF-omni while that of AF was an additional 2.9 dB over non-AF-dirm. Overall, TNTs measured with AF averaged 7.6 dB higher than those measured in the aided non-AF-omni condition.
Figure 5. Mean TNTs expressed as NSR for each hearing aid condition. The TNTs were calculated as the difference between TNL (measured between 31 and 120s post onset) and the respective speech levels of each test condition.
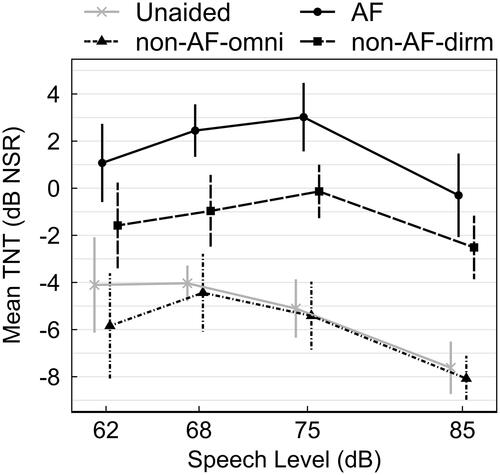
Linear mixed effects analysis confirmed a significant effect of hearing aid condition (χ2(3) = 323.94, p < 0.001) and speech input level (χ2(3) = 41.70, p < 0.001) on listeners’ TNT scores with no significant interaction of the two fixed effects. Post-hoc analysis of the estimated marginal means indicated that TNT scores were significantly higher (i.e. better) for the AF condition compared to all other conditions (p < 0.001) and for the non-AF-dirm condition compared to the non-AF-omni or unaided conditions (p < 0.001), which did not differ significantly from each other. Across speech levels, post-hoc tests indicated that TNT scores were significantly lower at the 85 dB SPL input level compared to 68 dB SPL and 75 dB SPL (p < 0.001) and 62 dB SPL (p < 0.01) input levels for all HA conditions.
Association between unaided TNT and aided TNT and benefit
The LME analysis revealed a significant positive association between listeners’ unaided and aided TNT scores across the different test conditions (β = 0.52, CI = 0.33 − 0.71, χ2(1) = 29.29, p < 0.001). Listeners who exhibited greater noise acceptance in the unaided mode would likely exhibit greater noise acceptance in the aided mode and vice versa. On the other hand, listener’s unaided TNT scores at 85 dB SPL did not significantly predict noise acceptance benefit conferred by AF or non-AF dirm processing (β = −0.24, CI = −0.54 − 0.06, χ2(1) = 2.40, p = 0.122). Nearly all listeners benefitted from AF or non-AF-dirm processing in noise acceptance relative to non-AF-omni.
Discussion
Listeners have to be able to accept the noise in their backgrounds before they can continue their communication successfully. While their criteria for noise acceptance may vary (e.g. Mackersie et al. Citation2021), it is reasonable to expect that those who can accept more noise are more likely to be successful in their SIN communication or be more satisfied with their hearing aids (e.g. Seper et al. Citation2019). In that context, the current study showed that AF processing allowed listeners to accept 2.9 dB more noise over non-AF processing that included adaptive directionality and NR and 7.6 dB over non-AF-omni (plus NR) condition. Adaptive directionality improved listeners’ aided TNT by 4.7 dB over the non-AF-omni condition. Whereas adaptive directionality took between 20 s and 30 s to reach a stable TNL, the effect of AF was fully realised in less than 15 s, observable at all input levels tested. The unaided TNT at 85 dB did not predict aided wearer TNT benefit at any input level from the use of AF or adaptive directionality but did predict wearer noise acceptance in the aided mode at all input levels.
Comparison to previous studies
While this is the first study to examine AF with the TNT test, Kuk et al. (Citation2017) reported a TNT directional advantage of 3.6 dB when used with NR and 4.4 dB when used without NR at a speech input level of 82 dB SPL. In this study, the improvement in aided TNT between the non-AF-dirm and non-AF-omni was 5.5 dB at and above a speech level of 75 dB SPL. The results from the current study were better than those previously reported likely because of the use of adaptive directionality (vs fixed hypercardioid) and the placement of the noise source at 180°. The adaptive DIRM used in the current study could have adapted to a cardioid pattern with the null at exactly the noise azimuth. This would further improve the effectiveness of the DIRM when the noise was presented at 180°. Nevertheless, this reinforces the advantage of directionality on noise acceptance in situations where there is a spatial separation between target signals and noise.
The current study showed similar TNT between the unaided condition and the aided non-AF-omni condition. Previously Kuk et al. (Citation2017) showed that the aided TNT in an omnidirectional microphone, no NR condition was poorer than the unaided TNT but was improved with the use of NR. In this study, the non-AF-omni condition included the actions of the NR algorithm and WDRC. Wu and Stangl (Citation2013) reported that WDRC worsened ANL by 1.5 dB, while NR improved ANL by 1.1 dB. Thus, it is likely that the actions of these two features cancel each other to result in a net-zero change in noise acceptance between the unaided and aided non-AF-omni (w/NR) condition.
The current study measured TNL at multiple speech input levels. Several investigators (e.g. Franklin et al. 2006; Freyaldenhoven et al. Citation2007, Citation2008) also examined the effect of speech input levels on the ANL measured in normal-hearing and hearing-impaired listeners. In general, these authors found that as input level increased, the measured ANL increased (or worsened) because the BNL increased more slowly. Franklin et al. (2006) showed that the slope of ANL-input level function increased by 0.25 dB per dB increase in speech level. Freyaldenhoven et al. (Citation2008) showed that the slope of the function increased by 0.1 dB/dB for full-time HA wearers but 0.22 and 0.26 dB/dB for part-time and non-HA wearers respectively. In this study we observed that the slope of the TNT-input level function for the unaided and aided non-AF-omni conditions changed by about 0.17 dB per dB increase in speech level. The decrease in TNT with speech input level is in line with the observation of increasing ANL with increasing speech inputs in that both suggest less noise acceptance with increasing speech level. On the other hand, the slope of the TNT-input function measured in this study would put our participants somewhere between full-time and part-time wearer categories according to Freyaldenhoven et al. (Citation2008). showed that the 16 participants with HA experience averaged 11.6 h/day of use and most were neutral or satisfied with their own hearing aids. Differences in the type of task (ANL vs TNL), stimulus condition (speech and babble noise front vs speech front continuous noise back) and the use of filtered speech signals to reflect vocal effort in this study may be partially responsible for the differences.
While the TNT-level functions for the unaided and aided non-AF-omni conditions showed a downward trend with input levels (as the ANL-level function), those of the non-AF-dirm and AF conditions increased as input increased from 62 dB SPL to 75 dB SPL and then decreased at a similar rate as the unaided or aided non-AF-omni condition. This observation likely reflects the processing of the adaptive directionality and AF feature. The operation of an adaptive DIRM is dependent not only on the azimuth of the noise signal, but also on the intensity of such inputs. Directional effects increase as the input level increases. Thus, the 3–4 dB improvement of non-AF-dirm over non-AF-omni (and unaided) at 62 dB SPL would suggest that the DIRM was activated. The additional TNT improvement of 1–2 dB at an input of 75 dB SPL would suggest further input-dependent action of the adaptive DIRM. The DIRM was fully activated at 75 dB SPL such that any higher input did not provide additional SNR improvement. Thus, TNT decreased above 75 dB SPL at the same rate as in the unaided and non-AF-omni conditions. Hearing aid technologies that are level dependent could affect the outcome of TNL/BNL measurements conducted at different speech input levels.
Characteristics of AF processing reflected on TNT
Measuring TNL at multiple input levels allowed us to confirm our understanding of the response time of AF processing, its efficacy, and any level dependence associated with the processing. Compared to adaptive directionality alone, AF allowed listeners to accept more noise at all input levels more quickly. Our results suggest that wearers, while wearing HAs with AF processing, can accept 2.9 dB more noise in noisy environments compared with the use of adaptive directionality (and NR), without compromising speech intelligibility. This is similar to the electroacoustic SNR advantage offered by AF processing reported in the Methods section. Intuitively, one may expect wearers to understand more speech as if the SNR had improved by 2.9 dB in an environment with a constant noise level. Indeed, Jensen et al. (Citation2021) reported 4 dB improvement with AF processing over non-AF-dirm processing on the Matrix Speech Test.
The faster responsiveness of AF over the non-AF-dirm condition, as reflected in the slope (0.3–0.4 dB/s vs 0.2 dB/s) of the tracking function would suggest that AF allowed the wearers to reach a stable TNL sooner than wearers of the non-AF adaptive DIRM. In addition, the non-AF-dirm took longer to reach a steady output level (reflected on TNL) as input increased (20 s at 62 dB SPL to over 30 s at and above 75 dB SPL) whereas the AF reached a steady gain state in less than 15 s for all speech levels. In principle, AF is active at all times so a steady output should be reached instantaneoously. Thus, this 15 s likely reflects a limitation of the current TNT implementation because the software only permitted the noise level to change at 1 dB/s and then 0.5 dB/s after the first six reversals. A faster tracking rate should reveal a faster response time for AF. Despite this limitation, it is reasonable to conclude that AF was more responsive than adaptive directionality. A wearer could adapt to the noise environment more quickly with the use of AF than without AF. This could promote communication success as the listeners may be more willing to stay in the listening environments if their HAs adapt to the sound environments sooner. Considering that realistic listening situations are not static but rife with unpredictable changes in sound sources and durations (e.g. cars drive by, someone calling from different sides), a system that responds more quickly to such changes without artefacts could ensure the audibility of sounds that may be important to the listener.
The TNT-level function of the AF paralleled that of the non-AF-dirm condition with a maximum TNT at 75 dB SPL. This suggests that the effect of AF can be realised at all input levels and it could provide additional noise acceptance to that provided by DIRM. This is beneficial given that realistic listening situations change in levels greatly (Wu et al. Citation2018). A maximum AF effect (along with directionality) at 75 dB SPL is especially meaningful since this level is typical of loud, noisy situations (Pearsons, Bennett, and Fidell Citation1977).
It must be cautioned that the current observations were made with a speech front, continuous noise back configuration. Other noise types (such as babble) and configurations (such as noise in front, to the sides etc) may lead to a different outcome. For example, the modulation characteristics of the babble noise could reduce the accuracy of ‘noise’ identification and reduce overall effectiveness. Different spatial relations between the ‘speech’ and ‘noise’ stimuli could interact with the directivity of the microphones used to process sounds from the front and rear hemispheres. Additional studies are needed to evaluate the effectiveness of AF processing in other noise types and speech/noise configurations.
Candidates for AF
The unaided TNT showed highly significant associations with aided TNT in all HA conditions. This suggests that the unaided TNT and the aided TNT likely reflect the same criteria used by participants in their judgments. On the other hand, the unaided TNT was not associated with aided benefit; AF and directionality benefit all HA wearers regardless of their unaided noise acceptance. A caveat is that the participants in this study were all cognitively healthy, satisfied HA wearers (except 3 non-wearers) who have relatively reasonable unaided TNT. It is unclear if the same observation would hold true for listeners with poorer cognition, inexperience with HAs, or extremely poor noise acceptance. Previously Seper et al. (Citation2019) showed that the aided TNT correlated modestly with wearers’ hearing aid satisfaction in real-life noisy situations. Hence, the 2.9 dB improvement in the aided TNL with AF processing over non-AF-dirm suggests that the participants in this study may report a higher level of HA satisfaction in noise for the AF hearing aid than their own hearing aids given that none of them currently uses AF processing. Clearly, further studies are needed to validate these speculations.
Conclusion
By separately treating signals from the front and back hemispheres, AF processing allowed its wearers to accept 2.9 dB more noise than non-AF-dirm processing or 7.6 dB over the aided non-AF-omni condition in a speech-front, noise back configuration. The effect of AF was fully realised sooner than non-AF-dirm at all input levels. Because AF (and DIRM) processing requires spatial separation between speech and noise sources, potential wearers of these systems may be counselled on the mechanisms behind directionality and AF so they can form the right expectations and learn how to navigate their environments to create spatial separation between desirable and undesirable sound sources.
Disclosure statement
All authors are employees of WS Audiology.
References
- ANSI S3.5. 1997. American National Standard Methods for the Calculation of the Speech Intelligibility Index. New York: ANSI.
- Bates, D., M. Mächler, B. Bolker, and S. Walker. 2015. “Fitting Linear Mixed-Effects Models Using lme4.” J Stat Software 67 (1): 1–48.
- Bisgaard, N., M. Vlaming, and M. Dahlquist. 2010. “Standard Audiograms for the IEC 60118-15 Measurement Procedure.” Trends in Amplification 14 (2): 113–120. doi:10.1177/1084713810379609.
- Bregman, A. 1990. Auditory Scene Analysis: The Perceptual Organization of Sound. Cambridge, MA: MIT Press.
- Chung, K. 2004. “Challenges and Recent Developments in Hearing Aids. Part 1. Speech Understanding in Noise, Microphone Technologies and Noise Reduction Algorithms.” Trends in Amplification 8 (3): 83–124. doi:10.1177/108471380400800302.
- Cohen, S., and N. Weinstein. 1981. “Non Auditory Effects of Noise on Behavior and Health.” Journal of Social Issues 37 (1): 36–70. doi:10.1111/j.1540-4560.1981.tb01057.x.
- Dreschler, W., H. Verschuure, C. Ludvigsen, and S. Westermann. 2001. “ICRA Noises: artificial Noise Signals with Speech-like Spectral and Temporal Properties for Hearing Aid Assessment.” Audiology : Official Organ of the International Society of Audiology 40 (3): 148–157. doi:10.3109/00206090109073110
- EHIMA 2016. Description and Terms of Use of the IFFM and IFnoise Signals. EHIMA, European Hearing Instrument Manufacturers Association AISBL.
- Franklin, Clifford A., James W. Thelin, Anna K. Nabelek, and Samuel B. Burchfield. 2006. “The Effect of Speech Presentation Level on Acceptance of Background Noise in Listeners With Normal Hearing.” Journal of the American Academy of Audiology 17 (2): 141–146. doi:10.3766/jaaa.17.2.6.
- Freyaldenhoven, M., A. Nabelek, S. Burchfield, and J. Thelin. 2005. “Acceptable Noise Level as a Measure of Directional Hearing Aid Benefit.” Journal of the American Academy of Audiology 16 (4): 228–236. doi:10.3766/jaaa.16.4.4.
- Freyaldenhoven, Melinda C., Patrick N. Plyler, James W. Thelin, and Mark S. Hedrick. 2007. “The Effects of Speech Presentation Level on Acceptance of Noise in Listeners with Normal and Impaired Hearing.” Journal of Speech, Language, and Hearing Research : JSLHR 50 (4): 878–885. doi:10.1044/1092-4388(2007/062).
- Freyaldenhoven, M., P. Plyler, J. Thelin, and R. Muenchen. 2008. “Acceptance of Noise Growth Patterns in Hearing Aid Users.” Journal of Speech, Language, and Hearing Research : JSLHR 51 (1): 126–135. doi:10.1044/1092-4388(2008/009).
- Hagerman, B., and Å. Olofsson. 2004. “A Method to Measure the Effect of Noise Reduction Algorithms Using Simultaneous Speech and Noise.” Acta Acustica 90 (2): 356–361.
- Holube, I., S. Fredelake, M. Vlaming, and B. Kollmeier. 2010. “Development and Analysis of an International Speech Test Signal (ISTS).” International Journal of Audiology 49 (12): 891–903. doi:10.3109/14992027.2010.506889.
- Jensen, N., E. Hoydal, E. Branda, and J. Weber. 2021. “Augmenting Speech Recognition Using a Split Processing Paradigm.” Hearing Review 28 (6): 24–27.
- Kincaid, J., R. Fishburne, R. Rogers, and B. Chissom. 1975. Derivation of New Readability Formulas for Navy Enlisted Personnel (Research Branch Report No. 8–75). Memphis, TN: Naval Air Station.
- Kreidler, S., K. Muller, G. Grunwald, B. Ringham, Z. Coker-Dukowitz, U. Sakhadeo, A. Barón, and D. Glueck. 2013. “GLIMMPSE: Online Power Computation for Linear Models With and Without a Baseline Covariate.” Journal of Statistical Software 54 (10). PMCID:PMC3882200
- Kuk, F., E. Seper, C. Lau, and P. Korhonen. 2017. “Tracking of Noise Tolerance to Measure Hearing Aid Benefit.” Journal of the American Academy of Audiology 28 (8): 698–707. doi:10.3766/jaaa.16053.
- Mackersie, C., N. Kim, S. Lockshaw, and M. Nash. 2021. “Subjective Criteria Underlying Noise-Tolerance in the Presence of Speech.” International Journal of Audiology 60 (2): 89–95. doi:10.1080/14992027.2020.1813909.
- Mueller, G., J. Weber, and B. Hornsby. 2006. “The Effects of Digital Noise Reduction on the Acceptance of Background Noise.” Trends in Amplification 10 (2): 83–93. doi:10.1177/1084713806289553.
- Nabelek, A., F. Tucker, and T. Letowski. 1991. “Toleration of Background Noise: Relationship with Patterns of Hearing Aid Use by Elderly Persons.” Journal of Speech and Hearing Research 34 (3): 679–685. doi:10.1044/jshr.3403.679.
- Nabelek, Anna K., Melinda C. Freyaldenhoven, Joanna W. Tampas, Samuel B. Burchfiel, and Robert A. Muenchen. 2006. “Acceptable Noise Level as a Predictor of Hearing Aid Use.” Journal of the American Academy of Audiology 17 (9): 626–639. doi:10.3766/jaaa.17.9.2.
- Nasreddine, Z., N. Phillips, V. Bédirian, S. Charbonneau, V. Whitehead, I. Collin, J. L. Cummings, and H. Chertkow. 2005. “The Montreal Cognitive Assessment, MoCA: A Brief Screening Tool for Mild Cognitive Impairment.” Journal of the American Geriatrics Society 53 (4): 695–699. doi:10.1111/j.1532-5415.2005.53221.x.
- Pearsons, K., R. Bennett, and S. Fidell. 1977. Speech Levels in Various Noise Environments (Report No EPA-600/1-77-025). Washington, DC: US Environmental Protection Agency.
- Peeters, H., F. Kuk, C. Lau, and D. Keenan. 2009. “Subjective and Objective Evaluation of Noise Reduction Algorithms.” Journal of the American Academy of Audiology 20 (2): 89–98. doi:10.3766/jaaa.20.2.2.
- Pichora-Fuller, M., S. Kramer, M. Eckert, B. Edwards, B. Hornsby, L. Humes, U. Lemke, et al. 2016. “Hearing Impairment and Cognitive Energy: The Framework for Understanding Effortful Listening (FUEL).” Ear & Hearing 37 (1): 5S–27S. doi:10.1097/AUD.0000000000000312.
- Ricketts, T., B. Hornsby, and E. Johnson. 2005. “Adaptive Directional Benefit in the Near Field: Competing Sound Angle and Level Effects.” Seminars in Hearing 26 (02): 59–69. doi:10.1055/s-2005-871003.
- Signia 2021. Backgrounder Augmented Focus. Signia-Pro. https://www.signia-pro.com/en/blog/global/2021-05-backgrounder-augmented-focus/
- Seper, E., F. Kuk, P. Korhonen, and C. Slugocki. 2019. “Tracking of Noise Tolerance to Predict Hearing Aid Satisfaction in Loud Noisy Environments.” Journal of the American Academy of Audiology 30 (4): 302–314. doi:10.3766/jaaa.17101.
- Wu, Y., and E. Stangl. 2013. “The Effect of Hearing Aid Signal-Processing Schemes on Acceptable Noise Levels: Perception and Prediction.” Ear and Hearing 34 (3): 333–341. doi:10.1097/AUD.0b013e31827417d4.
- Wu, Y., E. Stangl, O. Chipara, S. Hasan, A. Welhaven, and J. Oleson. 2018. “Characteristics of Real-World Signal to Noise Ratios and Speech Listening Situations of Older Adults with Mild to Moderate Hearing Loss.” Ear and Hearing 39 (2): 293–304. doi:10.1097/AUD.0000000000000486.