
Abstract
Objective
We aimed to update the prevalence estimates of hearing loss in older adults in England using a nationally representative sample of adults aged 50 years old and older.
Design
A comparative cross-sectional study design was implemented. Hearing loss was defined as ≥35 dB HL at 3.0 kHz, as measured via Hearcheck in the better-hearing ear.
Study sample
We compared the estimates based on the English census in 2015 to estimates from psychoacoustic hearing data available for 8,263 participants in the English Longitudinal Study of Ageing (ELSA) Wave 7 (2014–2015).
Results
Marked regional variability in hearing loss prevalence was revealed among participants with similar age profiles. The regional differences in hearing outcomes reached up to 13.53% in those belonging to the 71–80 years old group; the prevalence of hearing loss was 49.22% in the North East of England (95%CI 48.0–50.4), versus 35.69% in the South East (95%CI 34.8–36.50).
Conclusion
A socio-spatial approach in planning sustainable models of hearing care based on the actual populations’ needs and not on age demographics might offer a viable opportunity for healthier lives. Regular assessment of the extent and causality of the population’s different audiological needs within the country is strongly supported.
Introduction
Hearing loss (HL) is a significant public health issue; it is estimated that it currently affects over eight million older adults in England and costs the English economy over £25 billion a year in productivity and unemployment (Hill et al. Citation2015). To date, estimates of hearing loss prevalence in England are calculated based on 2,578 individuals with complete audiograms analysed in the Hearing in Adults (hereafter HiA) study by Davis, which summarises findings from the collection of audiological data in the 1980s (Barnett et al. Citation2012). The prevalence (%) per age group from that study’s samples is multiplied by the number of adults of similar age groups given by the Office for National Statistics population data. These are the only available estimates to the Clinical Commissioning Groups (CCGs) in England to determine the local health needs and the provision of hearing aids to the eligible population and are used to update the NHS hearing loss data tool (NHS England Citation2019).
Until recently, far too little attention had been paid to whether the current focus on age profiles alone is suitable for estimating the number of adults with hearing loss (Tsimpida et al. Citation2020). The risks from the paucity of robust epidemiological hearing data in England have been discussed in a previous study, which reported that the increasing trend in hearing loss prevalence is not related to the ageing of the population, as traditionally believed, but potentially to social and lifestyle changes (Tsimpida et al. Citation2020). Furthermore, ineffective policies of rationing NHS hearing aids may deter appropriate referrals to secondary healthcare in regions where the free provision of hearing aids is being ceased (Tsimpida et al. Citation2020), leading to preventable health-care-associated harm to NHS patients (Cooper et al. Citation2018). Therefore, a socio-spatial approach is crucial for planning hearing care models based on the actual population’s needs and reducing hearing health inequalities (Tsimpida et al. Citation2019, Citation2020).
The measurement of hearing loss prevalence is an essential prerequisite for understanding population health. The importance of the HiA study by Davis for the history of hearing care in the UK is widely recognised (Akeroyd et al. Citation2019). However, although the accuracy of hearing loss estimates has not been validated in almost four decades, they currently determine the local hearing health needs in England.
The aim of our study was, therefore, two-fold: (a) to explore regional patterns of psychoacoustic hearing health data in a nationally representative sample of older adults in England, and (b) to examine the validity of the existing prevalence estimates of hearing loss in England, which were solely derived from the cities of Nottingham and Southampton in the 1980s (Barnett et al. Citation2012).
Materials and methods
Study population
We utilised data from the English Longitudinal Study of Ageing (ELSA). The ELSA is a large, population-based, prospective cohort study that collects data from a nationally representative sample of people aged 50 and over who live in private households (Steptoe et al. Citation2013; Zaninotto and Steptoe Citation2019). The study is funded by a consortium of UK government Departments (Department for Health and Social Care; Department for Transport; Department for Work and Pensions), coordinated by the National Institute for Health Research (NIHR), and the United States National Institute on Ageing.
The study is at the leading edge in both survey methodology and content, as it uses the sampling frame of the Health Survey for England (HSE). The sampling strategy in ELSA ensures that a fixed number of addresses are systematically selected from each postcode in England, and each household on the small users’ Postcode Address File (PAF) has an equal chance of inclusion. Thus, that specific sampling method secures the best coverage, as a tiny percentage of private households (less than 1% of all households in England) does not have a chance of inclusion in the study. Furthermore, additional calibration weighting is being applied to adjust the initial household non-response weight, ensuring that the final sample represents the population of interest, defined as ‘adults of 50 years and over in England, living in private households’ (Taylor et al. Citation2007).
The study started in 2002 and has an ongoing 2-year follow-up longitudinal design and currently contains nine waves of data collection. The data collection in Wave 7 (between June 2014 and May 2015) included a series of innovative measures. Among them was a new psychoacoustic hearing acuity test that involved a handheld screening device (HearcheckTM). A total of 8,529 participants aged 50–89 years old, who did not have an ear infection or a cochlear implant, gave consent to have their hearing acuity psychoacoustically measured. Research nurses visited the homes of the participants to take the measurements according to the protocol. The final analytical sample in our study comprised 8,263 participants due to missing data regarding the region of residence of 266 participants (missingness 0.03).
Outcomes
Psychoacoustically measured hearing acuity
The ELSA contains measures for both self-reported and psychoacoustically measured hearing acuity (Zaninotto and Steptoe Citation2019). In our study, we utilised the measures obtained from the HearCheckTM Screener, which is a psychoacoustic hearing assessment tool and tests for the audibility of pure tone beeps (Siemens Audiologische Technik GmbH Citation2007). The ELSA belongs in a family of Global Ageing Surveys modelled according to the Health and Retirement Study (HRS) and are publicly available in the ‘Gateway to Global Ageing’ (https://g2aging.org/) to allow cross-national comparisons. The HearcheckTM Screener was first used in the HRS in 2016, where hearing was also psychoacoustically tested using both the HearcheckTM Screener and the self-reported questions. Following the same study protocol, the ELSA (Wave 7) utilised the HearcheckTM device for the psychoacoustic measurement of hearing acuity (Davis et al. Citation2007).
The device automatically generates a series of six sounds, which have decreasing intensity: the functional test sequence begins with a fixed series of three mid-frequency sounds at 1.0 kHz (55 dB HL, 34 dB HL, and 20 dB HL), and afterwards, another three pure high-frequency sounds at 3.0 kHz (75 dB HL, 55 dB HL, and 35 dB HL) are generated. Hearing loss is detected according to the number of tones that the respondent cannot hear for each sequence per ear. Prerequisites were for the device to make proper contact with the tested ear; hearing aid(s), glasses, earrings, and hair bands to be removed; and the room to be quiet. Participants indicated when they heard each sound by raising their finger.
Hearing loss was defined as hearing sounds greater than 35 dB HL at 3.0 kHz in the better hearing ear (tones heard or not at 75 dB HL and 55 dB HL, but not heard at 35 dB HL). This level of high-frequency hearing loss was the target value of a Health Technology Assessment report into screening for hearing loss in older adults and was considered the level at which intervention with hearing aids is definitely beneficial (Davis et al. Citation2007). This definition has been previously used in the literature for those assessed by the same device to indicate ‘moderate hearing loss and worse’ (Scholes et al. Citation2018; Tsimpida et al. Citation2020). Instead, the ‘normal hearing’ category was defined as having heard all three tones of the hearing screening test at 3.0 kHz.
The accuracy of the HearCheckTM in detecting hearing loss has been assessed in previous studies: in cases of moderate or worse hearing loss, the device fulfils all the criteria of high sensitivity, high specificity, and high positive predictive values to be considered an accurate screening tool for hearing loss, without the need for soundproof audiometry booths (Fellizar-Lopez et al. Citation2011).
Data analysis
The hearing loss population estimates were calculated using data from a) the HiA and b) the ELSA. First, we used prevalence data of the 1,538 subjects aged 50 years old and above with complete audiograms analysed in the HiA study. The digital reprint of the HiA study is provided as Supplemental material in the article of Akeroyd et al. (Citation2019). Next, we multiplied the given estimates of hearing loss (%) of ≥35 dB HL with each one of the CCGs’ populations estimates, mid-2015, as provided by the Office for National Statistics population data for England for the age groups a) 51–50, b) 61–70, c) 71–80, and d) >80 years old. Next, the prevalence of hearing loss ≥35 dB HL observed in 8,263 participants in ELSA Wave 7 (collected in 2014–15) was calculated for the same age groups to generate comparable data.
We utilised the geographical information systems (GIS) approach in public health (Wang Citation2020) to estimate the accuracy of the existing hearing loss data and compare it with the ELSA dataset. Spatial statistics is a distinct area of research; it focuses on examining the distributions, attributes, and relationships of features in spatial data to help gain a better understanding of the data (Scott and Janikas Citation2010). Spatial statistics differentiate from the traditional statistical theory by rejecting the idea of assumed independence of observations. Instead, consider that space and location influence the observations, assuming that nearby units are somehow associated (Getis Citation1999; Fotheringham and Rogerson Citation2013; Griffith Citation2020). The above can be summarised in Tobler’s first law of geography, which argues that “Everything is related to everything else, but near things are more related than distant things” (Tobler Citation1970).
The georeferenced dataset in ELSA had the form of identifiers, such as the Government Office Region (GOR) (Getis and Ord Citation1996), which represent the highest tier of sub-national division in England (North East, North West, Yorkshire and the Humber, East Midlands, West Midlands, East of England, London, South East, South West). We used the spatial join tool to aggregate the number of psychoacoustically measured hearing loss cases to the total responses in each GOR to visualise the normalised prevalence rates of hearing loss per GOR.
Next, we executed the hot spot analysis tool applied the hot spot analysis (Getis-Ord Gi*), This tool works by looking at each feature within the context of neighbouring features and returns z-scores and p-values that indicate where features with high or low values cluster spatially (Tsimpida et al. Citation2020). To be a statistically significant hot spot, a feature will have a high value and be surrounded by other features with high values. Accordingly, a cold spot will be statistically significant where there is a feature with low value, surrounded by other features with low values.
The calculation of Getis-Ord Gi* considered confidence levels of 90%, 95%, and 99%. For statistically significant positive z-scores, the larger the z-score is, the more intense the clustering of high values (hot spot). For statistically significant negative z-scores, the smaller the z-score is, the more intense the clustering of low values (cold spot) (Getis and Ord Citation1996). The definition of the spatial relationship in the tool was the ‘Contiguity Edges Corners’. This selection aimed to allow all neighbouring polygon features that share a boundary or node to influence the target polygon feature’s computations. Stata Software release 16.0 ©2019 (StataCorp LLC, College Station, TX, USA) was used for data analyses and ESRI ArcGIS Desktop 10.7.1 for spatial analyses.
Results
shows estimates of hearing loss prevalence in CCGs in England based on data of 2,578 individuals with audiograms in HiA, as shown in Davis (Barnett et al., Citation2012) and Akeroyd et al. (Citation2019). Of them, 1,538 were 50 years old and above.
Table 1. Estimates of hearing loss prevalence ≥35 dB HL in England based on data from 2,578 individuals with complete audiograms in Hearing in Adults studya.
shows participants’ psychoacoustically measured hearing acuity % (n = 8,263) in the better-hearing ear in the English Longitudinal Study of Ageing (ELSA), Wave 7.
Table 2. Participants’ psychoacoustically measured hearing acuity % (n = 8,263) in the better-hearing ear in English Longitudinal Study of Ageing (ELSA), Wave 7.
More detailed findings regarding the prevalence estimates of hearing acuity in CCGs and regions of England are provided in the Additional File (Supplementary Tables 1 & 2, and Supplementary Figure 1), which is provided as an online supplement. The hearing loss estimates are currently vastly underestimated in most regions of England, particularly for the age groups 51–60, 61–70, and 71–80. For example, the ELSA data revealed that the total hearing loss prevalence in England for age group 61–70 was 152,730 more cases than is currently estimated. The 44,017 of these reside in North West, and 38,136 in Yorkshire and The Humber.
depicts maps with the prevalence of psychoacoustically identified hearing loss in ELSA Wave 7 compared to the current estimates. Although the samples in ELSA had significantly equal means of age among regions (Tsimpida et al. Citation2020), we observed considerable variation in the prevalence rate of psychoacoustically measured hearing loss among different regions of England (normalised per GOR population). The Somers’ D correlation coefficient (Newson Citation2008) between hearing loss and age in the ELSA dataset was 0.45 (95% CI 0.42–0.47), showing a weak correlation between hearing loss and increase of age (Pett Citation2015). However, the difference in prevalence among regions reached 13.53% in those belonging in the age group 71–80 years old, where the prevalence was 49.22% in the North East (95%CI 48.0–50.4) versus 35.69% in the South East (95%CI 34.8–36.50).
Figure 1. Map of England by Government Office Regions, showing prevalence rates of psychoacoustically identified hearing loss ≥35 dB HL in the seventh Wave of the English Longitudinal Study of Ageing (ELSA). This work by Dialechti Tsimpida is licenced under a Creative Commons Attribution 4.0 International Licence.
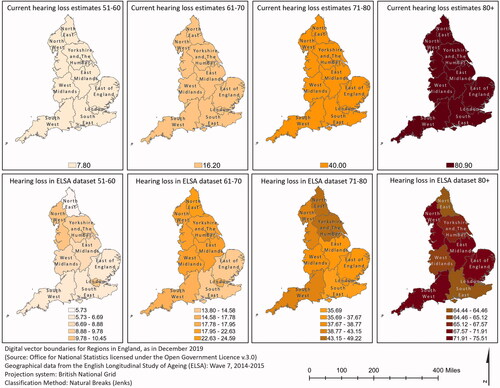
shows the regional differences (%) among the psychoacoustically measured hearing loss prevalence ≥35 dB HL in the English Longitudinal Study of Ageing (ELSA) Wave 7 (n = 8,263), and the current estimates in the NHS hearing loss data tool, based on Davis’s Hearing in Adults study (n = 1,538). The participants residing in the northern part of the country had worse hearing outcomes at an earlier age, and the prevalence in those regions is currently underestimated. The North-South divide was distinct in age groups 61–70 and 71–80. However, we found that the NHS hearing loss tool’s current data overestimates the prevalence in those over 80 years old.
Table 3. Regional differences (%) among the psychoacoustically measured prevalence of hearing loss ≥35 dBHL in the English Longitudinal Study of Ageing (ELSA) Wave 7 (n = 8,263), and the current estimates in NHS Hearing Loss Data Tool based on Davis’s Hearing in Adults study (n = 1,538).
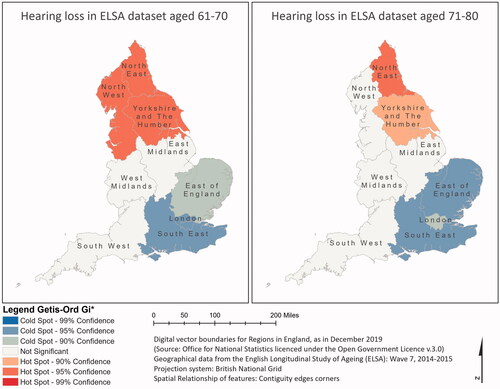
The spatial clusters of hearing loss prevalence according to the hot spot and cold spot analyses using the Getis-Ord Gi* spatial statistic are illustrated in . The analyses revealed statistically significant high values (hot spots) and low values (cold spots) of hearing loss prevalence in age groups 61–70 and 71–80. The spatial distribution of high and low values in the dataset was more clustered in the northern and southern parts of the country than would be expected if the underlying spatial processes were truly random.
Figure 2. Map of England by Government Office Regions showing the spatial clusters of hearing loss prevalence according to Hot Spot and Cold Spot analyses a using the Getis-Ord Gi* statistic in the seventh Wave of the English Longitudinal Study of Ageing (ELSA). aThe Hot Spots and Cold Spots indicate unexpected spatial spikes of high or low values, respectively, showing that the distribution of these values in the dataset is more spatially clustered than would be expected if underlying spatial processes were truly random. This work by Dialechti Tsimpida is licensed under a Creative Commons Attribution 4.0 International License.
Predicted probabilities and 95% confidence intervals of hearing loss prevalence at regions of England in Wave 7 of the English Longitudinal Study of Ageing (ELSA) are shown in and . In the analyses, the factor variables (age, gender, education, occupation, income, wealth, and alcohol consumption) were held at their means for each age group, respectively. The results tell us that if we had two otherwise-average individuals in Wave 7, the probability of them having hearing loss ≥35 dB HL at 3.0 kHz would vary significantly among regions. For example, one’s probability of having hearing loss in the North East would be 11% higher than for an otherwise-comparable participant in South East (North East APM = 0.308, South East APM = 0.198, MEM = 0.308–0.198 = 0.11).
Discussion
Summary of main findings
This study provides an update on the prevalence estimates of hearing loss in older adults in England after nearly four decades. The study is the first to investigate on the basis of geographical patterns of psychoacoustically identified hearing loss in a nationally representative sample of 8,263 older adults in England derived from ELSA Wave 7, and not only on age demographics, thus providing the best available audiological data in England today.
We identified vast regional differences in comparison to the current prevalence estimates in all age groups that we examined. We identified marked regional variability and evidence of a distinct North–South divide in hearing loss prevalence among age groups with similar age profiles. In a previous study, we demonstrated that the variances of the means of age were equal in Waves 7, both between groups and within groups (Tsimpida et al. Citation2020). Thus, we were able to perform robust calculations comparing the hearing loss prevalence of the participants in ELSA to the percentages per age group that currently inform the NHS Hearing Loss Data Tool (51–60: 7.8%, 61–70: 16.2% 71–80: 40%, 80+: 80.9%). The regional differences in the estimates of hearing loss in the ELSA dataset reached up to 13.53% in those belonging to the age group 71–80 years old. Surprisingly, there was a weak correlation between hearing loss and the increase of age, revealing that the accumulation of risk factors other than age per se (Tsimpida et al. Citation2021) might be responsible for the increase in hearing loss prevalence in the successive age groups.
Comparison with previous literature
To date, hearing loss prevalence estimates have been based on age characteristics alone, using data collected in the 1980s (Barnett et al. Citation2012). The HiA study did not identify differences across different residence places (Akeroyd et al. Citation2019). However, it must be noted that the HiA study did not analyse a nationally representative sample of participants. Our findings show that the overall sample frame design in HiA used individuals from Cardiff, Glasgow, Nottingham, and Southampton, and considered that sample “as representative as possible of the adult population living at private addresses in Great Britain” (Barnett et al. Citation2012) is epidemiologically inaccurate.
Our study adds to a recently emerging and novel body of work, which approaches hearing health inequalities through spatial lens (Tsimpida et al. Citation2020). A previous work by Ellis and Fry (Ellis and Fry Citation2010) revealed a north-south divide in various aspects of health outcomes, also using GORs as markers of area. Our study provides, for the first time, evidence of contextual effects in hearing health inequalities identified in a nationally representative sample of older adults using psychoacoustic audiometric data. Previous analyses that used self-reported hearing data (Tsimpida et al. Citation2020) did not allow comparisons between the estimates from the HiA study with reliable, psychoacoustic audiometric measures from a nationally representative cohort study of older adults. This study, therefore, provides robust evidence, revealing for the first time that the estimates that currently inform the NHS hearing loss data tool (Scholes et al. Citation2018) are not appropriate for planning services on local authority and CCGs levels in England.
We also found that the worst hearing health occurred in areas with other economic and social disadvantages—the left-behind places. In ages 61–70 and 71–80, the current NHS data tool underestimates hearing health outcomes in some regions. However, these age groups reflect the population having a significantly increased incidence of multiple diseases that usually co-occur with or due to hearing loss (Barnett et al. Citation2012; McKee et al. Citation2018). Hence, the burden of comorbidity is more prominent in these regions. Hearing loss may also add another layer of difficulty in managing multiple comorbid chronic health conditions due to the increasing barriers in communication with health professionals and access to health services (Tsimpida et al. Citation2019, Citation2021).
Also, the findings showed that people might have worse hearing outcomes in some regions in England at an earlier age. It is possible that the North–South divide that was revealed in ages 61–70 and 71–80 years old might exist at an earlier age as well, though it probably remained hidden due to the small ELSA sample in the group 51–60 years old. The fact that the regional differences become smooth in the age group >80 could be explained due to premature morbidity and mortality in the northern part of the country, attributable to socioeconomic inequality (Lewer et al. Citation2020; Marmot Citation2020). That phenomenon may explain why there was a decrease in the hearing loss regional heterogeneity as the population grows older (); the differences in the acceleration of the ageing process among people living in the northern and the southern part of the country may be reflected in the mortality rate differences between these regions. Many of those with hearing loss might experience premature mortality and, therefore, not reach the age of +80 (Lewer et al. Citation2020). Further studies are urgently needed to verify the extent and the causality of the different audiological needs of the population across the country.
Strengths and limitations
The main strength of our study is that it provided a significant opportunity to update the population estimates of the number of older adults in England with hearing loss after nearly four decades. The profound multidisciplinary professional and experimental care in the National Study of Hearing is broadly recognised; however, our study showed that this data does not remain accurate and generalisable.
Not only is the sample in our study (8,263) over five times larger than the sample of individuals with complete audiograms aged 50 years old and above analysed in the HiA study (1,538) (Barnett et al. Citation2012). Moreover, the current hearing loss data in England are based on estimates solely derived from two cities in England: Nottingham and Southampton (Davis Citation1989; Barnett et al. Citation2012), while the sample in our study was derived from a nationally representative cohort of older adults.
In contrast to methodological limitations in the HiA study, an important strength of the ELSA study is that any issues concerning differences in response rates and possible bias due to possible differences in selection and response trends at different locations have been overcome through the additional calibration weighting. Thus, the methodology that was applied in ELSA to adjust the initial household non-response weight ensures that the study sample in ELSA is representative of the equivalent English population, not only in socioeconomic terms but also in relation to place (Zaninotto and Steptoe Citation2019).
However, there are significant limitations. First, the high level of our analyses (regions) had a low geographic resolution, which did not allow advanced statistical modelling to distinguish between the variation in hearing health outcomes due to characteristics of individuals and contextual effects (Kawachi et al. Citation2002). The available geographical data in ELSA were georeferenced only at the regional level, which did not allow us to estimate proportions at the CCG level and compare them with the estimates from the HiA study. Though, even if data existed, such an estimation would contradict our central argument, which suggests that we should not apply the same prevalence estimates to different CCGs; the heterogeneity of hearing outcomes of the population according to the place they live was evident even at the regional level. These findings instead highlight the need for future research that should build on this analysis using routinely collected health data in England, allowing the application of multilevel analytical approaches to model heterogeneity at several levels, from the individuals’ lifestyle choices to neighbourhoods and the regions’ socioeconomic characteristics (Lloyd Citation2016; Marmot Citation2020).
Another limitation is that in our study, the level of hearing loss ≥35 dB HL was calculated through a three-tone, two-level screening test (Scholes et al. Citation2018). Even though this method is considered more efficient than audiograms (Akeroyd et al. Citation2019), it does not provide the precision that can be acquired using specialist equipment and booths and cannot give information about the type of hearing loss (Probst Citation2004). In addition, no information is provided in ELSA documentation regarding the calibration of the equipment. Also, the HearCheckTM Screener did not provide comparable frequencies to the HiA data other than the ≥35 dB HL at 3 kHz. Future work should consider undertaking spatial analyses in more frequencies, such as 25, 45, 65, and 95 dB.
Furthermore, even though the ELSA is considered a nationally representative cohort of older adults in England, it concentrates on community-dwelling adults. Individuals living in institutions (e.g. residential and nursing homes) have been excluded from data collection (Steptoe et al. Citation2013).
Research and policy implications
Hearing loss is a significant health topic on the world health agenda, appearing in the top ten leading causes of disability for adults aged 50 years old and above (Vos et al. Citation2020). In England alone, hearing loss is the third leading cause of years lived with disability (Vos et al. Citation2017). However, hearing loss remains largely unrecognised and untreated in England (Benova et al. Citation2015; Tsimpida et al. Citation2020). People often cannot recognise that their hearing has been affected, and many hearing loss cases may remain undiagnosed (Tsimpida et al. Citation2020) and untreated, particularly those belonging to high-risk groups (Tsimpida et al. Citation2019). Therefore, advancing our knowledge of the current hearing data’s appropriateness for planning sustainable hearing care models through this study was highly important. This updated analysis of hearing loss prevalence could inform the NHS England and Department of Health’s health policy strategies, particularly regarding the new governmental programme, ‘Action Plan on Hearing Loss’ (Hill et al. Citation2015).
The risk from the paucity of recent prevalence data in planning efficient, effective, and sustainable models of hearing care based on actual needs could be understood in the following example: in the CCG North Staffordshire, the estimated number of adults aged 61–70 years old in 2015 was 28,292. According to the HiA study’s estimates, 4,583 of them (16.2%) may have hearing loss ≥35 dB HL. However, our study showed that this percentage is underestimated by 23%; in ELSA, 21.1% of those aged 61–70 in that Region (West Midlands) are estimated to have hearing loss, which equals 5,975 people. That points to an estimation of additional 1,392 people with ‘moderate or worse hearing loss’. Prior knowledge of these socio-spatial inequalities in hearing health could have potentially led to different decision-making processes in the North Staffordshire CCG’s, who decided in 2015 to end the routine free provision of hearing aids for people with mild or moderate HL in their area of duty. Fortunately, the North Staffordshire CCG approved a recommendation in 2021 to remove any restrictions for patients with moderate hearing loss.
Our study also has significant implications in current practice: the hearing loss cases are currently represented by a static number that is dragged on the population’s age demographics at a specific point of time (e.g. year). Having a percentage for all regions means that the northern part of the country may be left behind in terms of its needs. Therefore, applying a single hearing loss percentage equally to different regions in the northern and southern parts of England that have a history of socioeconomic and health disparities (Doran et al. Citation2004; Buchan et al. Citation2017) may exacerbate existing hearing health inequalities in the country (Lorenc et al. Citation2013; Tsimpida et al. Citation2020), or even generate mental health inequalities (Tsimpida et al. Citation2021).
Our study also has important implications for global hearing health policy and practice. The population’s age demographics are used in all countries to inform hearing loss prevalence estimates and inform each country’s hearing health policy. The global estimates of hearing loss prevalence are currently calculated from a compilation of fifty-three epidemiological studies from 31 countries—only three analysed audiological data from nationally representative samples (Pascolini and Smith Citation2009). The findings from our study have the realistic potential to encourage many researchers internationally to investigate whether there are regional differences in the hearing loss prevalence among adults with similar age profiles in other countries. The hearing measures in the English Longitudinal Study of Ageing (ELSA) are comparable to many other global ageing surveys with harmonised physical and anthropometric measurements (Eunjee Kwon Citation2018), which are publicly available in the ‘Gateway to Global Ageing’ (https://g2aging.org/). Thus, our study offers a unique opportunity for cross-national comparisons of the regional patterns and trends of hearing loss prevalence through the harmonised national surveys.
Area effects are particularly important to consider as, even when they are small in magnitude, they affect a large number of people living within them. Future research that will generate epidemiological hearing data using nationally representative larger datasets is crucially needed to better understand the impact of socioeconomic inequalities and personal characteristics on hearing loss outcomes during the life-course and investigate more localised patterns and determinants of place-to-place hearing loss differences in England (Hill et al. Citation2015; Tsimpida et al. Citation2021). Robust hearing data are also crucial for accurate cost analyses; the figures are currently based on a prevalence-based costing model that may underestimate the actual global economic cost or the cost-effectiveness of intervention to prevent and tackle hearing loss (McDaid et al. Citation2021).
Therefore, our findings might have important implications for informing global strategies to minimise socioeconomic risks for hearing loss and improve access to hearing health services and hearing aids. However, whether the differences in socioeconomic inequality among countries affect the prevalence of hearing loss linearly or whether other factors, such as differences in health care systems, drive potential differences among countries remains to be examined.
Conclusions
This study revealed a significant north-south divide on poor hearing health and premature morbidity. Population samples with similar age profiles had significant variation in their psychoacoustically identified hearing loss outcomes, depending on the place they live. This novel finding supports a new conceptualisation of hearing loss, which argues that the different rate of decline in hearing ability occurs due to the accumulation (or not) of layers of contextual and individual risk factors when people grow old, not necessarily because they grow old. Therefore, the study revealed that the current estimates based on the population’s age per se and not on their actual needs might exacerbate existing hearing health inequalities in England’s northern and southern parts. These findings point to the need for a robust health policy response, including universal hearing screening and the redesign of audiological services, considering socioeconomic and lifestyle risk factors for hearing loss. Tackling hearing health inequalities is necessary to unleash the potential of the whole country.
Ethics approval
Ethical approval for all the ELSA Waves was granted from the National Research and Ethics Committee (MREC/01/2/91).
Informed consent from participants
Written informed consent was obtained from all participants. Details of the ELSA study design, sample and data collection are available at the ELSA’s project website (https://www.elsa-project.ac.uk/).
Author contributions
DT was responsible for the conceptualisation, and all authors were responsible for developing the design of the study. DT was responsible for conducting the analyses and mapping, interpreting the results, and drafting the manuscript. DT, MP, and EK critically revised the manuscript. All authors have read and approved the final manuscript.
Supplemental Material
Download MS Word (343.5 KB)Acknowledgements
DT thanks Amy Craddock, Research and Policy Officer at the Royal National Institute for Deaf People (RNID), for the collaboration in summarising the prevalence of hearing loss at ≥35 dB HL in Hearing in Adults study, including the table reference (provided as ).
Disclosure statement
No potential conflict of interest was reported by the authors.
Data availability statement
The English Longitudinal Study of Ageing dataset is available via the UK Data Service (http://www.ukdataservice.ac.uk). Statistical code is available from the corresponding author upon request at [email protected].
Additional information
Funding
References
- Akeroyd, M. A., G. G. Browning, A. C. Davis, and M. P. Haggard. 2019. “Hearing in Adults: A Digital Reprint of the Main Report from the MRC National Study of Hearing.” Trends in Hearing 23: 2331216519887614. doi:10.1177/2331216519887614.
- Barnett, K., S. W. Mercer, M. Norbury, G. Watt, S. Wyke, and B. Guthrie. 2012. “Epidemiology of Multimorbidity and Implications for Health Care, Research, and Medical Education: A Cross-Sectional Study.” Lancet (London, England) 380 (9836): 37–43. doi:10.1016/S0140-6736(12)60240-2.
- Benova, L., E. Grundy, and G. B. Ploubidis. 2015. “Socioeconomic Position and Health-Seeking Behavior for Hearing Loss among Older Adults in England.” The Journals of Gerontology Series B: Psychological Sciences and Social Sciences 70 (3): 443–452. doi:10.1093/geronb/gbu024.
- Buchan, I. E., E. Kontopantelis, M. Sperrin, T. Chandola, and T. Doran. 2017. “North-South Disparities in English Mortality1965–2015: Longitudinal Population Study.” Journal of Epidemiology and Community Health 71 (9): 928–936. doi:10.1136/jech-2017-209195.
- Cooper, Jennifer, Huw Williams, Peter Hibbert, Adrian Edwards, Asim Butt, Fiona Wood, Gareth Parry, et al. 2018. “Classification of Patient-Safety Incidents in Primary Care.” Bulletin of the World Health Organization 96 (7): 498–505. doi:10.2471/BLT.17.199802.
- Davis, A. C. 1989. “The Prevalence of Hearing Impairment and Reported Hearing Disability among Adults in Great Britain.” International Journal of Epidemiology 18 (4): 911–917. doi:10.1093/ije/18.4.911.
- Davis, A., P. Smith, M. Ferguson, D. Stephens, and I. Gianopoulos. 2007. “Acceptability, Benefit and Costs of Early Screening for Hearing Disability: A Study of Potential Screening Tests and Models.” Health Technology Assessment (Winchester, England) 11 (42): 1–294. doi:10.3310/hta11420.
- Davis. 1995. Hearing in Adults: The Prevalence and Distribution of Hearing Impairment and Reported Hearing Disability in the MRC Institute of Hearing Research’s National Study of Hearing. London: Whurr Publishers London.
- Doran, T., F. Drever, and M. Whitehead. 2004. “Is There a North-South Divide in Social Class Inequalities in Health in Great Britain? Cross Sectional Study Using Data from the 2001 Census.” Journal of Epidemiology Community Heal 58: 869. doi:10.1136/bmj.328.7447.1043.
- Ellis, A., and R. Fry. 2010. “Regional Health Inequalities in England.” Regional Trends 42 (1): 60–79. doi:10.1057/rt.2010.5.
- Eunjee Kwon, P. H. Harmonisation of Cross-National Studies of Aging to the Health and Retirement Study User Guide: Physical and Anthropometric Measurement. 2018. https://cesr.usc.edu/documents/Report_2018_001.pdf.
- Fellizar-Lopez, K. R., G. T. Abes, M. Reyes-Quintos, T. Rina, M. Tantoco, and S. Leah. 2011. “Accuracy of Siemens HearCheckTM Navigator as a Screening Tool for Hearing Loss.” Philippine Journal of Otolaryngology-Head and Neck Surgery 26 (1): 10–15. doi:10.32412/pjohns.v26i1.593.
- Fotheringham, S., and P. Rogerson. 2013. Spatial Analysis and GIS. United States: CRC Press.
- Getis, A., and J. K. Ord. 1996. “Local Spatial Statistics: An Overview.” In: P. Longley, and M. Batty (Eds.), Spatial Analysis: Modeling in A GIS Environment (pp. 261–277). New York: John Wiley & Sons.
- Getis, A. 1999. “Spatial Statistics.” Geographical Information System 1: 239–251.
- Griffith, D. A. 2020. “Introduction: The Need for Spatial Statistics.” In: Practical Handbook of Spatial Statistics. United States: CRC Press; 1–15.
- Hill, S., K. Holton, and C. Regan. 2015. Action Plan on Hearing Loss. London UK NHS Engl Dep Heal.
- Kawachi, I., S. V. Subramanian, and N. Almeida-Filho. 2002. “A Glossary for Health Inequalities.” Journal of Epidemiology and Community Health 56 (9): 647–652. doi:10.1136/jech.56.9.647.
- Lewer, Dan, Wikum Jayatunga, Robert W. Aldridge, Chantal Edge, Michael Marmot, Alistair Story, Andrew Hayward, et al. 2020. “Premature Mortality Attributable to Socioeconomic Inequality in England between 2003 and 2018: An Observational Study.” The Lancet Public Health 5 (1): e33–41–e41. doi:10.1016/S2468-2667(19)30219-1.
- Lloyd, C. D. 2016. “Spatial Scale and Small Area Population Statistics for England and Wales.” International Journal of Geographical Information Science 30 (6): 1187–1206. doi:10.1080/13658816.2015.1111377.
- Lorenc, T., M. Petticrew, V. Welch, and P. Tugwell. 2013. “What Types of Interventions Generate Inequalities? Evidence from Systematic Reviews.” Journal of Epidemiology and Community Health 67 (2): 190–193. doi:10.1136/jech-2012-201257.
- Marmot, M. 2020. “Health Equity in England: The Marmot Review 10 Years on.” British Medical Journal (Clinical Research edition) 368: m693. doi:10.1136/bmj.m693.
- McDaid, D., A.-L. Park, and S. Chadha. 2021. “Estimating the Global Costs of Hearing Loss.” International Journal of Audiology 60 (3): 162–170. doi:10.1080/14992027.2021.1883197.
- McKee, M. M., M. L. Stransky, and A. Reichard. 2018. “Hearing Loss and Associated Medical Conditions among Individuals 65 Years and Older.” Disability and Health Journal 11 (1): 122–125. doi:10.1016/j.dhjo.2017.05.007.
- Newson, R. 2008. “Identity of Somers’ D and the Rank Biserial Correlation Coefficient.” International Journal of Educational Methodology 6 (1): 207‒221. doi:10.12973/ijem.6.1.207.
- NHS England 2019. Hearing Loss Data Tool. https://www.england.nhs.uk/publication/joint-strategic-needs-assessment-toolkit/2016.
- Pascolini, D., and A. Smith. 2009. “Hearing Impairment in 2008: A Compilation of Available Epidemiological Studies.” International Journal of Audiology 48 (7): 473–485. doi:10.1080/14992020902803120.
- Pett, M. A. 2015. Nonparametric Statistics for Health Care Research: Statistics for Small Samples and Unusual Distributions. Los Angeles: Sage Publications.
- Probst, R. 2004. “Subjective and Objective Audiometry.” Therapeutische Umschau. Revue Therapeutique 61 (1): 7–14. doi:10.1024/0040-5930.61.1.7.
- Scholes, S., J. Biddulph, A. Davis, and J. S. Mindell. 2018. “Socioeconomic Differences in Hearing among Middle-Aged and Older Adults: Cross-Sectional Analyses Using the Health Survey for England.” British Medical Journal Open 8 (2): e019615. doi:10.1136/bmjopen-2017-019615.
- Scott, L. M., and M. V. Janikas. 2010. “Spatial Statistics in ArcGIS.” In: Handbook of Applied Spatial Analysis. Berlin, Heidelberg: Springer; 27–41. doi:10.1007/978-3-642-03647-7_2.
- Siemens Audiologische Technik GmbH 2007. Hear Check Screener User Guide. PUBLICIS. http://www.connevans.info/image/connevans/38shearcheck.pdf.
- Steptoe, A., E. Breeze, J. Banks, and J. Nazroo. 2013. “Cohort Profile: The English Longitudinal Study of Ageing.” International Journal of Epidemiology 42 (6): 1640–1648. doi:10.1093/ije/dys168.
- Taylor, R., L. Conway, L. Calderwood, C. Lessof, H. Cheshire, K. Cox, et al. 2007. “Health, Wealth and Lifestyles of the Older Population in England: The. 2002 English Longitudinal Study of Ageing Technical Report.” London: London Institute of Fiscal Studies.
- Tobler, W. R. 1970. “A Computer Movie Simulating Urban Growth in the Detroit Region.” Economic Geography 46: 234–240. doi:10.2307/143141.
- Tsimpida, D., E. Kontopantelis, D. Ashcroft, and M. Panagioti. 2020. “Comparison of Self-Reported Measures of Hearing with an Objective Audiometric Measure in Adults in the English Longitudinal Study of Ageing.” Journal of the American Medical Association Network Open 3 (8): e2015009–e2015009. doi:10.1001/jamanetworkopen.2020.15009.
- Tsimpida, D., E. Kontopantelis, D. Ashcroft, and M. Panagioti. 2019. “Socioeconomic and Lifestyle Factors Associated with Hearing Loss in Older Adults: A Cross-Sectional Study of the English Longitudinal Study of Ageing (ELSA).” British Medical Journal Open 9 (9): e031030. doi:10.1136/bmjopen-2019-031030.
- Tsimpida, D., E. Kontopantelis, D. Ashcroft, and M. Panagioti. 2021. “Conceptual Model of Hearing Health Inequalities (HHI Model): A Critical Interpretive Synthesis.” Trends Hear 25: 1–19. doi:10.1177/23312165211002963.
- Tsimpida, D., E. Kontopantelis, D. M. Ashcroft, and M. Panagioti. 2020. “Regional Patterns and Trends of Hearing Loss in England: Evidence from the English Longitudinal Study of Ageing (ELSA) and Implications for Health Policy.” Bio Med Central Geriatrics 20 (1): 1–14. doi:10.1186/s12877-020-01945-6.
- Tsimpida, D., E. Kontopantelis, D. M. Ashcroft, and M. Panagioti. 2021. “The Dynamic Relationship between Hearing Loss, Quality of Life, Socioeconomic Position and Depression and the Impact of Hearing Aids: Answers from the English Longitudinal Study of Ageing (ELSA).” Social Psychiatry and Psychiatric Epidemiology 12: 1–10. doi:10.1007/s00127-021-02155-0.
- Tsimpida, D., P. Galanis, and D. Kaitelidou. 2019. “Inequalities in Access to Health Services Faced by the Population with Hearing Loss in Greece: A Cross-Sectional Study.” European Journal for Person Centered Healthcare 7:2. doi:10.5750/ejpch.v7i2.1721
- Vos, Theo, Amanuel Alemu Abajobir, Kalkidan Hassen Abate, Cristiana Abbafati, Kaja M. Abbas, Foad Abd-Allah, Rizwan Suliankatchi Abdulkader, et al. 2017. “Global, Regional, and National Incidence, Prevalence, and Years Lived with Disability for 328 Diseases and Injuries for 195 Countries, 1990–2016: A Systematic Analysis for the Global Burden of Disease Study 2016.” The Lancet 390 (10100): 1211–1259. doi:10.1016/S0140-6736(17)32154-2.
- Vos Theo, Stephen S. Lim, Cristiana Abbafati, Kaja M. Abbas, Mohammad Abbasi, Mitra Abbasifard, Mohsen Abbasi-Kangevari, et al. 2020. “Global Burden of 369 Diseases and Injuries in 204 Countries and Territories, 1990–2019: A Systematic Analysis for the Global Burden of Disease Study 2019.” The Lancet 396 (10258): 1204–1222. doi:10.1016/S0140-6736(20)30925-9.
- Wang, F. 2020. “Why Public Health Needs GIS: A Methodological Overview.” Annals of GIS 26 (1): 1–12. doi:10.1080/19475683.2019.1702099.
- Zaninotto, P., and A. Steptoe. English Longitudinal Study of Ageing. In: Encyclopedia of Gerontology and Population Aging. 2019. p. 1–7. https://www.elsa-project.ac.uk/study-documentation.