
Abstract
Objective
The Vibrant Soundbridge (VSB) is one of the most widely used implantable hearing devices. It consists of a vibrating floating mass transducer (FMT) that is connected to a middle ear structure. The standard coupling devices for sensorineural hearing loss are short process (SP) or long process (LP) couplers.
Design and study sample
This study directly compared the electro-mechanical performance of the SP- and LP-coupled FMT of the VSB in the same temporal bone specimen (n = 10). We measured velocity magnitudes and total harmonic distortions (THD) of the stapes (ST) and the round window (RW) using laser Doppler Vibrometry (LDV).
Results
Comparison shows a maximally 10 dB higher magnitude for the LP coupler at ST and RW for frequencies below 600 Hz, whereas the SP coupler shows a maximally 20 dB higher magnitude at the ST and RW for frequencies above 600 Hz. THD show similar behaviour with less distortion at 500 Hz for the LP coupler and less distortions for the SP coupler in higher frequencies.
Conclusions
Our experiments showed that the SP coupling may be mechanically favourable, in terms of magnitude and distortion, for the transmission of FMT vibrations at higher frequencies.
Introduction
Patients with sensorineural hearing impairment and ear canal problems can benefit from implantable middle ear hearing aids (Fisch et al. Citation2001; Lenarz et al. Citation2001). The most frequently used system is the Vibrant Soundbridge (VSB, MED-EL, Innsbruck, Austria) which consists of an external audio processor attached to an implantable receiver and the vibrating floating mass transducer (FMT) connected to a middle ear structure. The original FMT was crimped to the long process of the incus (LP). The first FMT was implanted in a patient with sensorineural hearing loss in 1996 (Ball Citation2010). In 2006, the indication criteria were extended to mixed hearing loss with the introduction of the round window (RW) application, whereby the FMT was connected directly to the RW membrane (Colletti et al. Citation2006; Mojallal et al. Citation2015; Marino et al. Citation2013). Other sites of attachment include the oval window (Huttenbrink, Beutner, and Zahnert Citation2010), stapes (ST) (Beleites et al. Citation2011; Huttenbrink et al. Citation2011) or a third window (Pau and Just Citation2010).
Schraven et al. (Schraven et al. Citation2014) reported another attachment for use in patients with sensorineural hearing loss and an intact ossicular chain, connecting an original LP crimp (VORP 502) to the short process of the incus (SP). Their experimental work in human temporal bone specimens using laser Doppler vibrometry (LDV) measurements showed similar magnitudes in motion compared to the standard LP coupling. The surgical procedure for SP coupling requires an antrotomy without the additional posterior tympanotomy for LP coupling (Schraven et al. Citation2014).
A dedicated SP coupler was developed that showed a similar overall performance to the original LP crimping but had an increased velocity-magnitude response around 1000 Hz in a temporal bone study (Mlynski et al. Citation2015). Implantation surgery of the SP coupler was significantly faster than LP vibroplasty by crimping (Lee et al. Citation2017; Schraven et al. Citation2018), as well as shorter hospital stays (Lee et al. Citation2017). Audiometric improvement is comparable between LP and SP (Edlinger et al. Citation2021; Lee et al. Citation2017; Schraven et al. Citation2018).
Also for the LP a dedicated coupler with a double elastic self-retaining titanium clip was developed. Compared to its crimped precursor, the LP coupler showed similar responses with enhanced velocity-magnitude around 1000 Hz and reduced responses between 2000 and 6000 Hz in experimental work (Schraven et al. Citation2016).
The current version of the FMT (VORP 503) no longer contains a pre-fixed crimp; it can be connected to the coupler of choice. The patient’s individual anatomy needs to be taken into consideration when choosing SP or LP coupler. One difference between the SP and LP coupler is the absence of an arm between the clamps of the FMT and the clamps for the ossicles. Apart from this, the decision mainly depends on the surgeon (Rahne et al. Citation2021).
A direct experimental comparison between LP and SP couplers in the same temporal bone specimen has not been reported yet. In this study, we provide LDV measurement results including absolute magnitudes and quality assessment of the sound transmission by reporting total harmonic distortions (THD).
Material and methods
Temporal bone specimens
The study was conducted on 10 human temporal bones (5 right, 5 left) from six donors (Science Care, Phoenix (AZ), USA; mean age 76 years, range 59–91 years, 5 males and 1 female). None had reported hearing loss or previous middle ear surgery. Initially, a microscopic inspection of the external auditory canal and the tympanic membrane was performed. Debris was removed using suction. Approval was given by the local ethics commission (EKNZ BASEC 2016-00599).
Surgical preparation and experimental protocol
The temporal bones were stabilised in a temporal bone holder (Storz & Co., Tuttlingen, Germany). A subtotal mastoidectomy and posterior tympanotomy were performed. The surgical preparation of the specimens followed clinical procedures. Two of the temporal bones required the mastoidal segment of the facial nerve to be dissected to obtain a perpendicular view of the RW. Adhesions on the RW membranes were removed. The external ear canal as well as ligaments and tendons of the middle ear were preserved.
Our experimental protocol consisted of the following 13 steps:
Acoustic stimulation without FMT for comparison to ASTM standard (ASTM 2005)
Determination of the ST magnitude for THD measurements
Insertion of FMT with SP coupler * ()
Acoustic simulation with SP coupled FMT
Electrical stimulation of the SP coupled FMT
THD measurement with SP stimulation
Removal of FMT with SP coupler *
Insertion of FMT with LP coupler *
Acoustic simulation with LP coupled FMT
Electrical stimulation of the LP coupled FMT
THD measurement with LP stimulation
Removal of FMT with LP coupler *
Acoustic stimulation without FMT
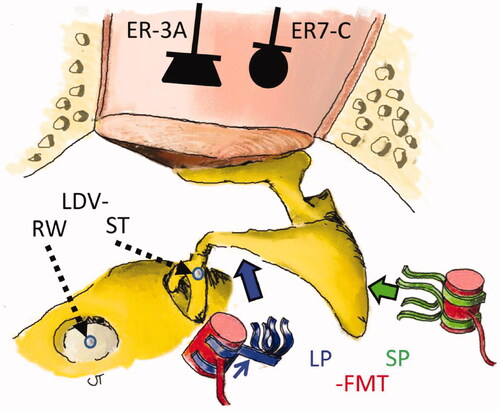
Figure 1. Experimental setup. For acoustical stimulation, sound was provided to the external auditory canal by the loudspeaker ER-3A and sound pressure was measured with the probe microphone ER-7C. For electrical stimulation, the floating mass transducer (FMT) was either coupled to the short process (SP) or long process (LP) depicted with wide arrows. Laser Doppler vibrometry (LDV) measurements at the stapes (ST) or round window (RW) are depicted with dashed arrows. Small arrow: LP coupler arm.
Steps 3, 7, 8 and 12 (marked with *) were surgical manipulations. To avoid bias from coupler deformation, we used new couplers for each temporal bone. In case of unexpectedly low magnitude response levels compared to known FMT output, we optimised position and coupling (Step 3 and 8) and repeated the acoustic and electrical measurements. We considered only our best measurements for the final analysis.
Measurement set-up
The measurement consists of an LDV with acoustic and electric stimulation. The acoustic stimulation was reported by Graf et al. (Graf et al. Citation2021). A glass-backed coupler (Polytec, Waldbronn, Germany) with an insert earphone (ER-3A; Etymotic Research, Elk Grove Village, IL, USA) and a probe microphone (ER-7C, Etymotic, Elk Grove Village, IL, USA) was entered into the external auditory canal. The LDV (CLV-2534, Polytec, Waldbronn, Germany), attached to an operating microscope. A joystick-controlled aiming prism (HLV MM2, Polytec, Waldbronn, Germany) allowed to position the laser beam on the microbeads placed on the ST head and the centre of the RW. The measurement angle on the stapes was approximately 45° in relation to the footplate and perpendicular to the RW membrane. We did not compensate for the angle in this study, as the primary goal was to compare the couplers and not focus on the absolute amplitude.
A sweep with frequencies between 100 to 8000 Hz was used in all experiments. The sweep contained 50 logarithmic uniformly distributed frequencies. Each sinus was repeated 10 times.
Electrical stimulation
The FMT (VORP 503) was stimulated with 150 mV which provides a stapes motion similar to an acoustic stimulation of approximately 105-110 dB SPL at 1000 Hz at the tympanic membrane as measured by LDV (Dietz, Ball, and Katz Citation1997).
Total harmonic distortion (THD)
THD for the FMT stimulation was measured for nine frequencies: 250, 500, 750, 1000, 1500, 2000, 3000, 4000 and 6000 Hz at the intensity level corresponding to 100 dB HLeq (hearing level equivalent). First, the hearing level was transformed into sound pressure level by using reference equivalent sound pressure level (RETSPL) of insert earphones like ER-3A measured in an acoustic coupler [IEC 389-2:1994]. The driving voltage of the ER-3A was manually adjusted to match the transformed RETSPL levels at the ER-7C. Second, we measured the ST velocity by LDV. In a third step, the FMT was stimulated with the nine individual driving voltages to produce the same velocity of the ST as for the acoustic stimulation. THD was registered with LDV. THD is known as one objective measure for sound quality in hearing systems (Chan and McPherson Citation2015; Dillon Citation2008; Lotterman and Kasten Citation1967).
Data analysis and statistics
Data were imported into Microsoft® Excel® 2016 (Microsoft Corporation, Redmont, WA, USA) for further analysis. Graphs were drawn with GraphPad Prism® (Version 8.4.3, GraphPad Software, San Diego, CA, USA).
The vibration transfer function of the stapes and RW membrane against sound stimulation (mm/s/Pa) and electromechanical stimulation (mm/s/V) was computed, including magnitude and phase. Phase differences were calculated for frequencies below 1000 Hz to confirm opposite volume velocities between ST and RW (Chien et al. Citation2007; Stieger, Rosowski, and Nakajima Citation2013). We performed non-parametric, one-sample paired Wilcoxon signed-rank statistical tests for magnitude and THD comparison. Level of significance was defined as p < 0.05.
Results
The initial compliance tests of the 10 specimens showed stapes motion within the ASTM standard for most frequencies (ASTM 2005). Below 500 Hz, all specimens were within the ASTM range. In the middle frequencies between 500 and 2000 Hz the magnitude of one specimen partially exceeded while two specimens partially fell below the ASTM range. Around 2000–5000 Hz, there is a systematic peak (Supplementary Figure 1). The expected phase difference of about half a cycle between ST and RW motions at low frequencies was observed. The mean phase shift between ST and RW for frequencies below 1000 Hz was 178.4° (standard deviation (STD) 14.4, range 151.8 to 200.4), a −1.6° difference from the expected 180° (Stieger, Rosowski, and Nakajima Citation2013).
The mean magnitude of stapes transfer function after the last manipulation differed less than 2.5 dB (range −4.1 to +5.2) from the initial measurement for frequencies below 1000 Hz and less than 5.5 dB for all frequencies.
Passive coupling
shows the effect of the FMT mass on the vibration transfer function following acoustic stimulation measured on the ST and RW. The graphs depict the difference between an acoustically stimulated ear with and without an FMT coupled to the ossicular chain.
Figure 2. Effect of the FMT mass on the stapes (ST) and round window (RW) movement with acoustic stimulation for the short process (SP) and long process (LP) couplers. Coloured lines: single measurements. Dots: mean values; a significant difference (p > 0.05) is marked with filled dots.
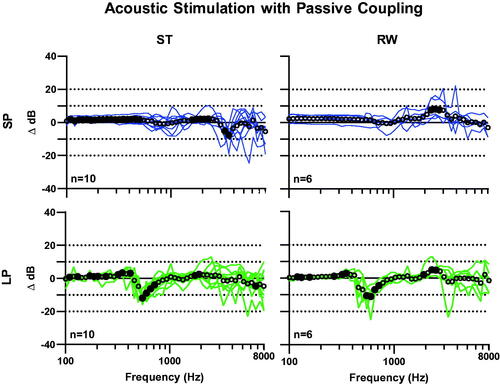
With SP coupling, the mean value for the entire frequency range changes by 0.3 dB (STD 2.2, range −7.7 to 2.1) and 2.2 dB (STD 2.2, range −3.0 to 8.2) for the ST and RW, respectively. Wilcoxon signed-rank test revealed significant differences in 25 out of 50 frequencies on the ST and in 3 out of 50 on the RW.
LP coupling led to a mean difference over all frequencies of −0.5 dB (STD 3.0, range −11.9 to 3.4) and −0.3 dB (STD 3.3, range −11.0 to 5.0) for the ST and RW, respectively. At both the ST and RW, there is a peak deterioration for all individuals at the frequencies between 547 and 598 Hz of 11.9 dB (STD 2.9) and 11.0 dB (STD 7.4), respectively. Wilcoxon signed-rank test revealed significant differences in 16 out of 50 frequencies on the ST and in 13 out of 50 on the RW.
Magnitudes and ratios of transfer functions of electrical stimulation (FMT)
For ST measurements, the LP coupler shows a significantly higher magnitude in the frequency range between 382 and 457 Hz, with a mean difference of 8.4 dB (STD 0.8, range 7.5 to 9.0) (). The SP coupler shows a significantly higher magnitude at 654–715Hz (mean difference 5.6 dB, STD 0.1, range 5.5 to 5.7), 935-1463Hz (mean difference 8.4 dB, STD 1.4, range 6.8 to 10.1) and 2092–5116Hz (mean difference 12.1 dB, STD 3.4, range 6.9 to 17.7).
Figure 3. Mean transfer functions (upper plots) of electromechanical stimulation for SP- and LP-coupling and ratio between SP- and LP-coupling (lower plots) on the stapes (ST, left plots) and round window (RW, right plots). Error bars: confidence interval; Dots: means. Significant difference (p < 0.05) between SP and LP couplers are marked with filled dots.
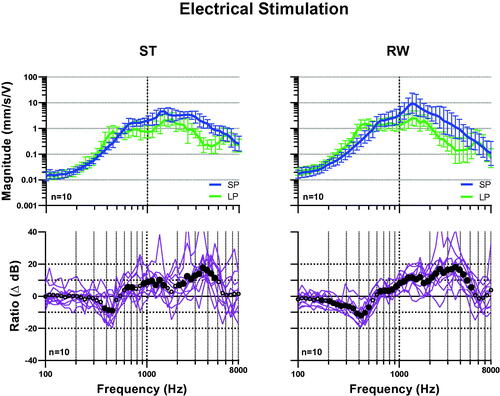
For RW measurements, the LP coupler shows a significantly higher magnitude between 171 and 500 Hz, with a mean difference of 6.4 dB (STD 3.1, range 2.6 to 12.0). The SP coupler shows a significantly higher magnitude at 654-5116Hz, with a mean difference of 10.6 dB (STD 4.7, range 3.1 to 18.0). The magnitudes of transfer functions for electrical stimulation at the ST and RW with SP and LP coupling for all individuals are shown in the Supplementary Figure 2.
Total harmonic distortions
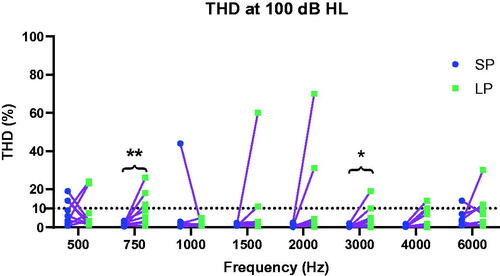
shows the percentage of total harmonic distortions at a stimulation level of 100 dB HL equivalent at eight audiological frequencies for each ear with SP and LP coupling. At 500 Hz, the mean THD of the SP coupler (7.9%) is slightly higher than for the LP coupler (7.7%). Above 500 Hz, the mean THD is 2.1% for SP coupling and 6.7% for LP coupling; 7 of 10 ears showed at least one THD value above 10% for LP coupling, with only 1 of 10 ears exhibiting the same for SP coupling. The SP coupler had statistically significant lower THD at 750 Hz and 3000 Hz. Because of output limitation of the ER-3A and noise level of the LDV, the THD at 250 Hz was only measurable in one ear and therefore not shown.
Figure 4. Total harmonic distortions (THD) of SP and LP coupling at eight frequencies at 100 dB HL eq. n = 10. Bullets: SP coupler, squares: LP coupler, lines: same ear. Paired Wilcoxon rank-sign test *: p < 0.05, **: p < 0.01.
Discussion
This study provides a direct comparison of the electro-mechanical performance between the SP and LP coupled FMT of the VSB in the same temporal bone specimen.
In electrical stimulation, LP coupling had a mean 12.0 dB higher magnitude in a narrow low-frequency band (382–457 Hz), whereas SP coupling showed an up to 18.0 dB higher magnitude in middle and high frequencies (598-5594 Hz). Our data support findings from Mlynski and Schraven who compared the original LP crimp to the LP and SP couplers (Mlynski et al. Citation2015; Schraven et al., Citation2016). The inferiority of the SP coupler in frequencies around 400–500 Hz is a cumulative effect. While Mlynski described the SP coupler to have had a 10 dB deterioration compared to the original crimped LP in these frequencies (Mlynski et al. Citation2015), the LP coupler had an additional non-significant negative trend compared to the LP crimp in low frequencies (Schraven et al. Citation2016). The superiority of the SP coupler in middle and high frequencies seems to be due to a combination of higher performance in middle frequencies and deficit of the LP coupler versus the crimped LP in high frequencies.
Besides magnitude, sound quality is also important for a successful hearing rehabilitation (Dillon Citation2008). Typical THD-values for receiver-in-the-cannel hearing aids are less than 1–2%, for high power hearing aids less than 4%. These measurements are performed at a stimulation level of approximately 60 dB SPL. In our setup we decided to set the level of excitation to 100 dB HLeq in order to provide confident LDV values above the noise level in all measured frequencies. Therefore, we chose an arbitrary THD-value of 10% for analysis assuming that this might be negatively perceived by the patient. Still, most of the results for the SP coupler are below 2%. The LP coupler shows more outliers than the SP coupler over all frequencies. Additionally, the SP coupler shows significantly lower THD at two frequencies. Since most patients with sensorineural hearing loss and an intact middle ear suffer from a presbycusis with high frequency loss, the SP coupler would be more beneficial to this group.
In some experiments, we decided to adjust the coupling in case of unexpected low initial LDV magnitudes or high distortions at multiple frequencies. LDV measurements for final analysis were achieved after a mean of 1.7 attempts to fix the SP coupler (in 4 out of 10 experiments) and 2.4 attempts for the LP coupler (in 7 out of 10 experiments). An explanation for more inconsistent results of the LP coupling may be that there are two dimensions to adjust: the distance of the FMT to the lenticular process can vary but it can also be rotated around the axis of the long incus process. The SP coupler varies only in one dimension, i.e. closer or further away from the tip of the short incus process.
A passive coupled FMT on the SP does not seem to influence the acoustic sound transmission because the decrease of the LDV signal seen at 3500 Hz at the ST is not present at the RW (). Thus, it may solely represent the 3 dimensional movement around another axis of the stapes, for example creating a rocking motion at higher frequencies. However, the LP coupling decreases the acoustic transfer function at 500 Hz by 10 dB at the ST as well as at the RW, which is to be expected in lower frequencies with the piston-like stapes motion (Heiland et al. Citation1999). A similar negative peak was observed in VORP 502 LP-crimping and coupling (Chen et al. Citation2017; Schraven et al. Citation2014, Citation2016). When an SP coupler with an arm between the crimping site and the FMT is used (Mlynski et al. Citation2015), a similar negative peak is observed. A compact coupler without any arm between the crimping location and the FMT seems to be favourable to prevent detrimental passive effects of the FMT. Statistical analysis of passive coupling showed a significant difference predominantly in frequencies below 1000 Hz; however, the numeric values were small (1.5 dB for SP coupling at ST), which supports the clinical experience observed by Snik et al. that their patients experienced no hearing deterioration with passive coupling (Maier et al. Citation2015; Snik et al. Citation2001). On the other hand, it shows the accuracy of the measurements and manipulations within the study. As a limitation RW measurements for passive coupling were only performed in 6 out of the 10 specimens because this step was initially not in the measurement protocol.
The magnitude of transfer function for acoustic stimulation was within the ASTM standard for most of the frequencies (ASTM 2005). All specimens were included in the final analysis. We experienced a systematic resonance higher than the ASTM standard between 3000 and 4500 Hz, which was related to the fact that the distance between the tympanic membrane and the probe microphone in our set-up (4–7 mm) was greater than that of the ASTM (2–3 mm) (Graf et al. Citation2021) due to the glass-backed coupler of the LDV system. All temporal bone specimens had a 180° phase shift between ST and RW motion in low frequencies and thus a supposedly intact and fluid-filled cochlea (Graf et al. Citation2021; Stieger, Rosowski, and Nakajima Citation2013). All specimens stayed visually intact during the coupling- and measurement procedure and manipulation did not deteriorate the audiological properties. This also indicates that multiple coupling and uncoupling does not affect the middle ear micromechanics. We did not observe a function loss of the VORP503 despite the fact that the same device was connected and disconnected to a coupler 20 times (data not shown).
Assuming that the device is perfectly connected, the main difference between the two couplers is the distance of the vibrating FMT to the rotational axis of the whole ossicular chain. Given that the FMT always produces the same force for a constant excitation, with a greater lever arm, the LP coupler produces more torque, which is especially effective at low frequencies. Nevertheless, a placement of the LP coupler close to the incudostapedial joint is more favourable as documented in the clinical study of Lee et al. (Citation2017). An even longer distance will increase the torque but might reduce the vibration transferred to the stapes. In contrast to Lee et al., at low frequencies, our experimental findings show higher magnitudes for the LP coupling. This would be consistent with the theory of low efficiency of the FMT in low frequencies due to its floating mass that requires a higher torque to move the ossicular chain. In middle and high frequencies a FMT placement even closer (and opposite) to the ossicular chain axis like in SP coupling is more efficient because less torque seems to be required. However, to answer these questions in detail, a modelling analysis including impedances, rotation axes of the middle ear and FMT coupling parameters would be needed.
For stimulations higher than 1000 Hz where rocking and tilting motions of the stapes become more prominent, any forced motion by an actuator on the incus seems to contribute to the stapes and round window motion and its resulting volume velocity. Therefore, the proximity to the main rotational axis of the SP compared to the LP coupler is beneficial. The explanation for more inconsistent results and the higher THD of the LP coupler might be the higher variance during the implantation. A re-design of the LP coupler with tighter fixation might reduce the high variation of the THD and the need for re-coupling. In the meantime, a modified LP coupler with narrow legs for easier coupling that still has an arm between the FMT and the coupling site is available.
Our experiments did not record movements in all dimensions. Rotational movements of the ST around its roll and pitch axis (Heiland et al. Citation1999) were not accessed, especially after attaching a vibrating weight on different positions of the incus. Measurements at the RW using single-point LDV are difficult due to complex movement patterns in frequencies above 1000 Hz (Stenfelt, Hato, and Goode Citation2004). However, magnitude differences in electromechanical stimulations with the FMT were passed to the RW almost unaltered and the detection point at the RW was untouched between the measurements of both couplers.
Comparisons of the described differences between SP and LP coupling on the outcome in clinical studies are limited as for our data showing the efficiency of the system. This might have an impact on the battery lifetime and not influence the clinical performance as long as the transducer is driven within its working range. Nevertheless, a higher efficiency could enlarge the indication range. As in a clinical setup, direct comparison of two couplers in the same specimen is impossible. Some studies show no significant difference in terms of word recognition (Lee et al. Citation2017; Rahne et al. Citation2021). However, Schraven et al. (Citation2018) found an increased speech perception with SP couplers, what is supported by our findings of a significantly increased efficiency for the SP coupler in speech relevant frequencies.
Conclusion
According to our experiments, the SP coupling may be mechanically favourable for the transmission of the FMT vibrations in terms of magnitude and distortion in higher frequencies.
| Abbreviations | ||
| ASTM | = | American standard practice for describing system output in implantable middle ear hearing devices |
| CI | = | Confidence interval |
| FMT | = | Floating mass transducer |
| LDV | = | Laser Doppler vibrometry |
| LP | = | Long process of the incus |
| mm/s/Pa | = | Millimeter/second/Pascal |
| mm/s/V | = | Millimeter/second/Volt |
| RW | = | Round window |
| ST | = | Stapes |
| STD | = | Standard deviation |
| SP | = | Short process of the incus |
| THD | = | Total harmonic distortions |
| TM | = | Tympanic membrane |
| VORP 503 | = | Vibrant ossicular prosthesis 503 (actual model of the FMT) |
Supplemental Material
Download MS Word (1.3 MB)Acknowledgments
The authors thank Noelani Peet for proof reading and English corrections.
Disclosure statement
J.L. and H.M. have been employed by the manufacturer of the Vibrant Soundbridge (MED-EL).
Correction Statement
This article has been republished with minor changes. These changes do not impact the academic content of the article.
Additional information
Funding
References
- ASTM 2005. International F2504-05: Standard Practice for Describing System Output of Implantable Middle Ear Hearing Devices.
- Ball GR. 2010. “The vibrant soundbridge: design and development.” Advances in Otorhinolaryngology 69: 1–13. doi: 10.1159/000318516.
- Beleites, T., M. Neudert, D. Beutner, K. B. Huttenbrink, and T. Zahnert. 2011. “Experience with Vibroplasty Couplers at the Stapes Head and Footplate.” Otology and Neurotology 32 (9): 1468–1472. Decdoi:10.1097/MAO.0b013e3182380621.
- Chan, Z. Y., and B. McPherson. 2015. “Over-the-Counter Hearing Aids: A Lost Decade for Change.” BioMed Research International 2015: 827463. doi:10.1155/2015/827463.
- Chen, T., L.-J. Ren, D.-M. Yin, J. Li, L. Yang, P.-D. Dai, T.-Y. Zhang, et al. 2017. “A Comparative Study of MED-EL FMT Attachment to the Long Process of the Incus in Intact Middle Ears and Its Attachment to Disarticulated Stapes Head.” Hearing Research 353: 97–103. Sepdoi:10.1016/j.heares.2017.06.006.
- Chien, W., M. E. Ravicz, J. J. Rosowski, and S. N. Merchant. 2007. “Measurements of Human Middle- and Inner-ear Mechanics with Dehiscence of the Superior Semicircular Canal.” Otology and Neurotology 28 (2): 250–257. doi:10.1097/01.mao.0000244370.47320.9a.
- Colletti, V., S. D. Soli, M. Carner, and L. Colletti. 2006. “Treatment of Mixed Hearing Losses via Implantation of a Vibratory Transducer on the Round Window.” International Journal of Audiology 45 (10): 600–608. doi:10.1080/14992020600840903.
- Dietz, T. G., G. R. Ball, and B. H. Katz. 1997. “Partially Implantable Vibrating Ossicular Prosthesis.” In Proceedings of International Solid State Sensors and Actuators Conference (Transducers' 97), Vol. 1, 433–436. New York: IEEE.
- Dillon, H. 2008. Hearing Aids. New York: Thieme Medical Publishers Inc.
- Edlinger, S. H., M. Hasenzagl, P. Schoerg, S. Muck, A. Magele, G. M. Sprinzl. 2021. “Long-Term Safety and Quality of Life after Vibroplasty in Sensorineural Hearing Loss: Short/Long Incus Process Coupler.” Audiology and Neurotology : 1–9. doi: 10.1159/000516144. Online ahead of print.
- Fisch, U., C. W. Cremers, T. Lenarz, B. Weber, G. Babighian, A. S. Uziel, D. W. Proops, et al. 2001. “Clinical Experience with the Vibrant Soundbridge Implant Device.” Otology and Neurotology 22 (6): 962–972. doi:10.1097/00129492-200111000-00042.
- Graf, L., A. Arnold, K. Roushan, F. Honegger, M. Muller-Gerbl, and C. Stieger. 2021. “Effect of Conservation Method on Ear Mechanics for the Same Specimen.” Hearing Research 401: 108152. doi:10.1016/j.heares.2020.108152.
- Heiland, K. E., R. L. Goode, M. Asai, and A. M. Huber. 1999. “A Human Temporal Bone Study of Stapes Footplate Movement.” The American Journal of Otology 20 (1): 81–86.
- Huttenbrink, K. B., D. Beutner, and T. Zahnert. 2010. “Clinical Results with an Active Middle Ear Implant in the Oval Window.” Advances in Oto-Rhino-Laryngology 69: 27–31. doi:10.1159/000318519.
- Huttenbrink, K. B., D. Beutner, M. Bornitz, J. C. Luers, and T. Zahnert. 2011. “Clip Vibroplasty: experimental Evaluation and First Clinical Results.” Otology and Neurotology 32 (4): 650–653. Jundoi:10.1097/MAO.0b013e318218d180.
- Lee, J. M., Y. H. Lee, J. Jung, S. H. Kim, I. S. Moon, and J. Y. Choi. 2017. “Audiologic Gain of Incus Short Process Vibroplasty with Conventional Incus Long Process Vibroplasty: A Retrospective Analysis of 36 Patients.” Otology and Neurotology 38 (8): 1063–1070. doi:10.1097/MAO.0000000000001496.
- Lenarz, T., B. P. Weber, P. R. Issing, D. Gnadeberg, K. Ambjørnsen, K. F. Mack, M. Winter, et al. 2001. “Vibrant Sound Bridge System. A New Kind Hearing Prosthesis for Patients with Sensorineural Hearing Loss. 2. Audiological Results.” Laryngo-Rhino-Otologie 80 (7): 370–380. Vibrant Soundbridge System: Ein neuartiges Horimplantat fur Innenohrschwerhorige. Teil 2: Audiologische Ergebnisse. doi:10.1055/s-2001-15707.
- Lotterman, S. H., and R. N. Kasten. 1967. “Nonlinear Distortion in Modern Hearing aids.” Journal of Speech and Hearing Research 10 (3): 586–592. doi:10.1044/jshr.1003.586.
- Maier, H., A.-L. Hinze, T. Gerdes, S. Busch, R. Salcher, B. Schwab, T. Lenarz, et al. 2015. “Long-Term Results of Incus Vibroplasty in Patients with Moderate-to-Severe Sensorineural Hearing Loss.” Audiology and Neuro-Otology 20 (2): 136–146. doi:10.1159/000368387.
- Marino, R., N. Linton, R. H. Eikelboom, E. Statham, and G. P. Rajan. 2013. “A Comparative Study of Hearing Aids and Round Window Application of the Vibrant Sound Bridge (VSB) for Patients with Mixed or Conductive Hearing Loss.” International Journal of Audiology 52 (4): 209–218. doi:10.3109/14992027.2012.750431.
- Mlynski, R., E. Dalhoff, A. Heyd, D. Wildenstein, K. Rak, A. Radeloff, R. Hagen, et al. 2015. “Standardized Active Middle-Ear Implant Coupling to the Short Incus Process.” Otology and Neurotology : Official Publication of the American Otological Society, American Neurotology Society [and] European Academy of Otology and Neurotology 36 (8): 1390–1398. doi:10.1097/MAO.0000000000000822.
- Mojallal, H., B. Schwab, A.-L. Hinze, T. Giere, and T. Lenarz. 2015. “Retrospective Audiological Analysis of Bone Conduction versus Round Window Vibratory Stimulation in Patients with Mixed Hearing Loss.” International Journal of Audiology 54 (6): 391–400. doi:10.3109/14992027.2014.986690.
- Pau, H. W., and T. Just. 2010. “Third Window Vibroplasty: An Alternative in Surgical Treatment of Tympanosclerotic Obliteration of the Oval and Round Window Niche.” Otology and Neurotology 31 (2): 225–227. Febdoi:10.1097/MAO.0b013e3181cc07fd.
- Rahne, T., P. H. Skarzynski, R. Hagen, A. Radeloff, L. Lassaletta, M. Barbara, S. K. Plontke, et al. 2021. “A Retrospective European Multicenter Analysis of the Functional Outcomes after Active Middle Ear Implant Surgery Using the Third Generation Vibroplasty Couplers.” European Archives of Oto-Rhino-Laryngology 278 (1): 67–75. Jandoi:10.1007/s00405-020-06064-x.
- Schraven, S. P., E. Dalhoff, D. Wildenstein, R. Hagen, A. W. Gummer, and R. Mlynski. 2014. “Alternative Fixation of an Active Middle Ear Implant at the Short Incus Process.” Audiology and Neuro-Otology 19 (1): 1–11. doi:10.1159/000354981.
- Schraven, S. P., W. Gromann, K. Rak, W. Shehata-Dieler, R. Hagen, and R. Mlynski. 2016. “Long-Term Stability of the Active Middle-Ear Implant with Floating-Mass Transducer Technology: A Single-Center Study.” Otology and Neurotology 37 (3): 252–266. Mardoi:10.1097/MAO.0000000000000943.
- Schraven, S. P., K. Rak, M. Cebulla, A. Radeloff, W. Grossmann, R. Hagen, R. Mlynski, et al. 2018. “Surgical Impact of Coupling an Active Middle Ear Implant to Short Incus Process.” Otology and Neurotology 39 (6): 688–692. Juldoi:10.1097/MAO.0000000000001830.
- Schraven, S. P., R. Mlynski, E. Dalhoff, A. Heyd, D. Wildenstein, K. Rak, A. Radeloff, et al. 2016. “Coupling of an Active Middle-Ear Implant to the Long Process of the Incus Using an Elastic Clip Attachment.” Hearing Research 340: 179–184. doi:10.1016/j.heares.2016.03.012.
- Snik, A. F., E. A. Mylanus, C. W. Cremers, N. Dillier, U. Fisch, D. Gnadeberg, T. Lenarz, et al. 2001. “Multicenter Audiometric Results with the Vibrant Soundbridge, a Semi-Implantable Hearing Device for Sensorineural Hearing Impairment.” Otolaryngologic Clinics of North America 34 (2): 373–388. Aprdoi:10.1016/s0030-6665(05)70337-6.
- Stenfelt, S.,. N. Hato, and R. L. Goode. 2004. “Round Window Membrane Motion with Air Conduction and Bone Conduction Stimulation.” Hearing Research 198 (1-2): 10–24. Decdoi:10.1016/j.heares.2004.07.008.
- Stieger, C., J. J. Rosowski, and H. H. Nakajima. 2013. “Comparison of Forward (ear-canal) and reverse (round-window) sound stimulation of the cochlea.” Hearing Research 301: 105–114. doi:10.1016/j.heares.2012.11.005.