
Abstract
Objective
To explore the detection of cortical responses to continuous speech using a single EEG channel. Particularly, to compare detection rates and times using a cross-correlation approach and parameters extracted from the temporal response function (TRF).
Design
EEG from 32-channels were recorded whilst presenting 25-min continuous English speech. Detection parameters were cross-correlation between speech and EEG (XCOR), peak value and power of the TRF filter (TRF-peak and TRF-power), and correlation between predicted TRF and true EEG (TRF-COR). A bootstrap analysis was used to determine response statistical significance. Different electrode configurations were compared: Using single channels Cz or Fz, or selecting channels with the highest correlation value.
Study sample
Seventeen native English-speaking subjects with mild-to-moderate hearing loss.
Results
Significant cortical responses were detected from all subjects at Fz channel with XCOR and TRF-COR. Lower detection time was seen for XCOR (mean = 4.8 min) over TRF parameters (best TRF-COR, mean = 6.4 min), with significant time differences from XCOR to TRF-peak and TRF-power. Analysing multiple EEG channels and testing channels with the highest correlation between envelope and EEG reduced detection sensitivity compared to Fz alone.
Conclusions
Cortical responses to continuous speech can be detected from a single channel with recording times that may be suitable for clinical application.
Introduction
The assessment of speech perception in audiology clinics is typically based on either behavioural measures of speech intelligibility or subjective evaluations of speech quality (BSA Citation2018). However, such measures are not possible in all patient groups, such as infants or patients with cognitive disabilities. In such groups, objective measures of speech perception may be useful to assess hearing function and evaluate the benefit of interventions, such as hearing aids. Initial approaches to measure evoked responses to speech explored auditory evoked potentials (AEPs) to short consonant-vowel speech stimuli, such as “da.” This is still an active area of research (Skoe and Kraus Citation2010; Easwar, Purcell, et al. 2015; BinKhamis et al. Citation2019). Typically an onset component and frequency following component are seen and such responses can be recorded reliably at high stimulation levels and with sufficient recording time (BinKhamis et al. Citation2019), although the reliability of specific peaks in the evoked potential at lower levels may be less than for click responses (Novis and Bell Citation2019). Responses to repeating short stimuli provide a limited evaluation of how the auditory system process the broad range of speech temporal characteristics (Lalor and Foxe Citation2010). There have been attempts to represent more of the features of natural speech in complex repeating stimuli (e.g. Easwar, Beamish, et al. Citation2015; Easwar, Purcell, et al. Citation2015; Easwar et al. Citation2020), but these approaches still lack the range of acoustic features of running speech. Using natural running speech can provide a more ecologically valid measure of speech processing, with potential for hearing aid evaluation. It may also overcome the issue of neural activity suppression caused by stimulus repetition (Grill-Spector, Henson, and Martin Citation2006). Response to continuous speech can better evaluate how hearing aid users perform in actual life speech-in-noise situations (Decruy, Vanthornhout, and Francart Citation2020). For these reasons, the use of running speech has become increasingly popular in studies of objective speech perception, including studies of attention modulation (Power et al. Citation2012; O'Sullivan et al. Citation2015; Vanthornhout, Decruy, and Francart Citation2019), speech-in-noise perception (Ding and Simon Citation2013; Vanthornhout et al. Citation2018) and speech processing at the phoneme level (Di Liberto, O'Sullivan, and Lalor Citation2015).
Measuring auditory evoked responses to continuous running speech can be accomplished in two ways. The first is to measure the maximum cross-correlation between the EEG response and specific features of the speech signal (Aiken and Picton Citation2008; Kong, Mullangi, and Ding Citation2014). Previous work has shown that both the temporal envelope (Kong, Mullangi, and Ding Citation2014) and the fundamental frequency of speech (Forte, Etard, and Reichenbach Citation2017) correlate with the EEG signal. The second approach is typically referred to as a temporal response function (TRF) which estimates the relationship (transfer function) between the features of input speech and the corresponding EEG (Lalor et al. Citation2009). The model assumes that the auditory system's output (the EEG response) is the convolution of the input stimuli with an impulse response. The impulse response, which defines the relationship, is estimated through a least-squares approach, where the error between the output (e.g. the actual EEG) and its estimate (based on the input signal convolved with the impulse response) is minimised. Through the TRF approach, EEG responses can be estimated from the speech stimuli (forward modelling), or the speech envelope can be reconstructed from EEG responses (backward modelling). In most studies, the significance of the correlation between the actual response and the predicted or reconstructed response is used to detect auditory processing of the stimulus. When using forward modelling, only one study has used detection based on the peak of the TRF filter to measure the effect of attention. Both the cross-correlation and the TRF approaches can detect cortical responses to running speech and have been widely used (Di Liberto, O'Sullivan, and Lalor Citation2015; Di Liberto and Lalor Citation2017; Vanthornhout, Decruy, and Francart Citation2019; Vanheusden et al. Citation2020). However, a comparison of detection sensitivity between the two approaches has not yet been made, nor has there been an exploration of how TRF filter waveform parameters, such as the peak value or the power might compare with those parameters for detection purposes.
Developing a clinical tool requires consideration of practicalities. The time duration of testing, for example, is crucial. To date, only one study has measured the minimum time needed to detect cortical entrainment to specific phonemic features of continuous speech in normal-hearing adults (Di Liberto and Lalor Citation2017). The authors examined the time required to obtain a significant correlation using the forward model. For each subject, responses were predicted using either a subject-specific model or a generic model. The subject-specific model was a multivariate-TRF (mTRF) fitted on data from only the subject tested, whereas the generic model included the averaged subject-specific mTRFs from all other subjects. It was found that in the subject-specific model, 30 min or more of an EEG data recording was required to measure significant correlation using TRF-forward modelling. Such a recording duration would be problematic for clinical use. When a generic model was instead used (based on recordings from nine previous subjects) only 10 min of the recording were needed. However, for this approach to be used in the clinic, such a generic model would need to be available in advance. It is also unclear how representative a normal-hearing subject model would be if applied to hearing-impaired subjects. Recording time varies between different participants, and it is uncertain how much time is required to detect responses in all subjects. In many studies, average responses across subjects are presented that do not show individual variability in response detection.
The feasibility of mTRF measurements with hearing aids and cochlear implants has begun to be explored. Vanheusden et al. (Citation2020) used the backward mTRF model to demonstrate that it is possible to record responses to running speech from subjects with mild to moderate sensorineural hearing loss with and without hearing aids, with bootstrapping used to indicate the presence of responses. A 25 min recording time was used, and a significant response was found in most, but not all, subjects. However, variability in detection times across individuals was not assessed. Somers, Verschueren, and Francart (Citation2019) have demonstrated that it is possible to use the backward model in CI users to predict the speech envelope and have shown the feasibility of using neural tracking of continuous speech in CI users to measure speech detection and understanding. Furthermore, a recent study by Verschueren, Somers, and Francart (Citation2019) measured the speech understanding in CI users using the backward model, showing that the correlation value between reconstructed and actual speech envelope increased with increasing speech understanding.
Another important requirement for clinical use is the availability and suitability of equipment. Detecting EEG responses to continuous speech is usually carried out using a multichannel recording system. In addition to increasing the setup and testing time, multichannel systems with 32 or more electrodes are costly and not typically available in audiology clinics or suitable for use with infants. For practical purposes, it would be preferable to use a single channel for clinical measurement. In the current study, the forward model was considered the most appropriate approach, as the model is estimated based on data from a single channel. However, the ability to detect single-channel responses to running speech has not been well-explored in previous works, nor has the position of the best single-channel been identified. An advantage of using multiple channels may be that the best-performing channel does not need to be selected in advance, removing the risk of only recording a sub-optimum single channel. However, a disadvantage of using multiple channels could be the need to compare multiple parameters which can result in inflated false-positive rates or reduced detection sensitivity. As yet, a comparison of single-channel detection with multichannel has not been made for the purpose of speech evoked responses.
For standard AEP measurement, cortical responses typically exhibit high amplitude in the frontal area. Aiken and Picton (Citation2008) suggest that the source of cortical responses to the onset of speech sentences is in the superior region of both temporal lobes. The Hearlab system protocol developed by Carter et al. (Citation2010) to measure standard AEPs to short speech sounds uses the Cz location to detect cortical responses to speech sounds. Another common measurement location is Fz, as it has good response amplitude but avoids the need to put electrodes in the hairline (Hall Citation2015). A comparison of these single-channel measurement positions in terms of detection time for responses to running speech has not yet been made. An alternative could be to use multichannel measurement and select the best single channel for each subject. Although this would be more complicated for clinical use, it might be worthwhile if it achieves a significant reduction in test time. A possible downside to the approach is that selecting the strongest statistical parameter, such as correlation from multiple channels will increase the values obtained both with and without responses present and thus raise the threshold beyond which any response can be deemed statistically significant. This will be addressed in the current work.
Previous studies have demonstrated that it is possible to measure the cortical response to a continuous speech from multichannel EEG using cross-correlation and TRF approaches. In summary, it is not clear if available methods are suitable for clinical application in terms of test time and if complex multichannel setups provide sufficient benefit for their application in clinical work. The feasibility of single-channel measurement for this application and the variability of detection times and methods across subjects is not well-understood. This current study compares detection sensitivities for running speech using different parameters extracted from the TRF and cross-correlation. Aims were (1) to compare the sensitivity of analysis methods/parameters to detect cortical responses to continuous running speech using a single channel and to determine which of the cross-correlation and the TRF parameters are most sensitive for detection. (2) To explore whether using a single channel is better than using multiple channels and selecting the best of those channels for analysis.
Materials and methods
The EEG data in this paper was previously collected by Vanheusden et al. (Citation2020). EEG data were recorded from 17 native English speakers (11 males, six females, age 65 ± 5 years) with bilateral mild-to-moderate sensorineural hearing loss. Hearing levels were assessed using pure-tone audiometry. shows the mean and the standard deviation of hearing levels at each frequency for both ears. All participants were regular HA users and were tested under aided and unaided conditions. They were awake and attentive to the stimulus during the sessions. For the current work, only the unaided condition was included in the analysis. The condition was chosen to exclude the possible complication of hearing aid processing: our aim was to compare the performance of different detection parameters, not to further explore the effects of aiding, so using only the unaided data made comparisons between methods simpler. If we can identify the best performing method for unaided data, it is reasonable to assume it will also work to detect aided responses.
Table 1. Subject average hearing levels.
This experimental stimulus was an English narrative continuous complex running speech from an audiobook that lasted for 25 min. It was divided into eight segments of roughly 3 min played contiguously (Vanheusden et al. Citation2020). The speech stimulus was sampled at 44,100 Hz and low-pass filtered at 3000 Hz. These parameters were chosen because of previous findings that frequencies above 3000 Hz have no significant effect when measuring low-frequency cortical entrainment to speech (Vanheusden et al. Citation2020). The stimulus was presented at 70 dBA-equivalent sound pressure (LeqA SP) through loudspeakers placed 1.2 m in front of the subject. Attention was ensured by asking questions after each segment. EEG responses were collected using a 32-channel system (Biosemi, Netherland, sampling rate of 2048 Hz). The electrodes were placed according to the 10–20 standard configuration and referenced to the averaged EEG responses over all electrodes.
The speech envelope was calculated using the absolute value of the Hilbert transform. The envelope was then down-sampled from 44,100 to 128 Hz and filtered with a zero-phase filter (1–30 Hz).
EEG data analysis
EEG responses were recorded from 32 channels, down-sampled to 128 Hz, and referenced to the two mastoid electrodes. The EEG was filtered between 1 and 30 Hz, covering the same band as the speech signal's envelope. In the first analysis, responses were detected using either the single Cz, or the single Fz channel. In the second analysis, the channel with the highest correlation between EEG and the speech envelope out of either all 32 channels or six channels was selected. The six channels Cz, Fz, F3, F4, FC1, and FC2, were chosen based on both our observations and data from previous studies exploring electrodes where the highest correlation between the speech envelope and EEG was detected. Channels in the frontocentral area of the scalp had the highest correlation value between predicated and actual speech envelope, reported by Di Liberto and Lalor (Citation2017). Recorded EEG data were analysed with two approaches: cross-correlation of the speech envelope with the EEG signal and the TRF forward model.
The TRF method was based on determining the impulse responses of the system by assuming a simple linear convolution between the input (the envelope of the speech signal) and the output (the EEG of each channel). The predicted EEG responses were computed from the speech envelope and the estimated forward model using the MATLAB TRF toolbox (Crosse et al. Citation2016). Before TRF analysis, the EEG data and speech envelope were normalised by dividing by their standard deviation. Artefact rejection was applied to the EEG data in blocks of 100 samples, with blocks that included values exceeding ±5 SD of amplitude being excluded from both the EEG data and the corresponding speech envelope. Here we are applying the “forward model,” predicting the EEG from the speech envelope at each channel. This model allows the neural activity at each electrode to be investigated at different latencies. The resulting impulse responses displayed some similarities to those of CAEPs following short tone-bursts (Vanthornhout, Decruy, and Francart Citation2019).
Based on the results of the decoding, three main parameters were calculated to indicate response quality. First, the TRF peak (TRF-peak) peak was measured in terms of the filter response peak-to-peak value. The second parameter was the power of the TRF (TRF-power): the average of the squared amplitude of the TRF filter across the window of interest (0–375 ms). The third parameter was the accuracy of the model's prediction (TRF-COR), given by the correlation coefficient (Pearson's r) between the actual and predicted EEG response in each channel.
A bootstrap statistical analysis method was used to determine whether a given parameter's magnitude was significantly different from random variation. In evoked potential studies, bootstrapping has been used (Lv, Simpson, and Bell Citation2007; Chesnaye et al. Citation2018; Vanheusden et al. Citation2019) to construct the null distribution for a specific statistical parameter of interest. The distribution is estimated by repeatedly and randomly drawing samples with replacement from the ongoing EEG data and calculating each sample's statistical parameters (Chesnaye et al. Citation2018). Here, this involved comparing the parameter values (e.g. the TRF-peak) obtained when the envelope and EEG were correctly aligned, to the bootstrap distribution values when they are repeatedly and randomly misaligned (giving, e.g. the TRF-peak* with * indicating bootstrap values). It was then tested whether this bootstrap distribution differed significantly from the original (with correctly aligned signals) value at a chosen significance level (here p < 0.05). This bootstrap approach allows significance to be tested in each individual recording rather than only testing for significant effects across the cohort.
For the TRF-peak and TRF-power parameters, 500 TRFs were calculated with random misalignment between the speech envelope and the EEG responses. The misalignment always had a minimum value of 2000 samples (15.6 s) to avoid random alignments where the EEG coincided with the speech envelope. This produced a bootstrap estimate of each parameter's null distribution (an estimate of what was expected when no responses were present will be denoted as TRF-peak* and TRF-power*, respectively). To find the significance of the TRF-peak, maximum and minimum values for each TRF-peak across a time window from 0 to 375 ms were determined. The minimum and maximum values were then sorted to determine the upper- and lower-2.5% thresholds, resulting in a total 5% false-positive rate. A response was considered present when the detected parameter value exceeded the 5% confidence interval (the TRF-peak values exceeded the upper or lower 2.5% of TRF-peak*). For the TRF-power, only the maximum 5% values were determined to detect the response's presence. The response was considered significant if the TRF-power exceeded the upper 5% of TRF-power*.
For the TRF-COR parameter, the bootstrap null-distribution of correlation values was determined using again the 500 random misalignments of the EEG and speech envelope described above, to provide TRF-COR*. A response was identified as significant if the correlation value of TRF-COR exceeded the upper 5% of TRF-COR* (i.e. the probability of achieving this TRF-COR value under the null hypothesis was p < 0.05).
We also explore the maximum of the cross-correlation function between the EEG and speech envelope (without using the TRF) for response detection. First, the EEG data and speech envelope were normalised to have a standard deviation of 1. Artefact rejection was applied as mentioned in the TRF analysis. The cross-correlation function between the aligned EEG data and speech envelope (XCOR) was calculated over a range of lags between the signals, from 0 to +375 ms. The maximum and minimum (usually the peak negative value) of the cross-correlation function were selected, and the significance of the peak or trough was determined again from the bootstrap distribution of XCOR*, following the same method as used for other parameters. Because the correlation between the EEG responses and the speech envelope was estimated, both strong positive and negative correlations may be deemed significant (Aiken and Picton Citation2008). A response was thus considered present when XCOR exceeded the upper or lower 2.5% of XCOR*.
False-positive rates were also tested to verify that the proposed methods of analysis were working as expected. Tests were applied to the four parameters (TRF-COR, TRF-peak, TRF-power, and XCOR) using white noise as the input and output signals. A false-positive rate of ∼5% in 1000 simulations was obtained.
Both analysis methods were tested for false positives using the time-reversed speech envelope as a control condition (we would not expect a significant correlation between the time-reversed speech envelope and the EEG).
Single-channel detection time analysis
The minimum time required for the response to be detected (detection time) was recorded for each subject. The purpose was to compare the performance of the four parameters outlined above (TRF-peak, TRF-power, TRF-COR, and XCOR). The data were divided into segments of increasing length from 1 min up to 25 min in 1 min increments. For each segment, the detection parameter outlined above were determined to indicate whether a response was present. The detection time specified for each subject was the minimum recording period for which a significant response was first detected. In cases where a subject showed no detection, the detection time was set to 26 min (i.e. longer than the recording) to avoid missing data in the statistical analysis.
Analysis of the best channels from multichannel data
This study looked at detection for Cz and Fz (the most commonly used single channels in clinical practice). However, we also explored detection when we selected the “best” channel from multiple channels. Two sets of multichannel analysis were assessed: (1) across all 30 channels (32 channels were recorded, but the two mastoids were used as the reference) and (2) across the frontal/central six channels that were most likely to contain a response (Aiken and Picton Citation2008). The results of these analyses were compared to the results from a single fixed channel. The detection rates were calculated in increments of 5 min rather than 1 min to reduce the analysis time. Two parameters were included in this analysis: TRF-COR and XCOR as they showed the best result in the earlier analysis. The bootstrap significance test for each of the parameters was similar to the one-channel analysis. However, to overcome the possibility of multiple comparisons producing false positive detections, the bootstrap analysis was then repeated for each of the other channels. Rather than using the 5% confidence interval for a single channel and 500 random misalignments, the 5% confidence interval was calculated across 500 random misalignments, selecting the highest value from all channels of data to provide the null distribution for the significance of the result in the “best” channel.
Results
Analysis of responses from single channels Fz and Cz
The first aim of the analysis was to explore the detection of cortical responses to continuous running speech using EEG data from one channel only. shows an example of the cross-correlation function results from one subject and shows the TRF filter for the same subject. shows detection times for Fz (panel A) and Cz (panel B). For Fz, the best detection rates were achieved with the TRF-COR and the XCOR parameters, exhibiting detection in all subjects (17) after 17 min. With TRF-power and TRF-peak, 15 subjects exhibited a detection after 19 and 22 min, respectively. The Cz channel results showed detection in 16 subjects with TRF-COR and XCOR after 20 and 21 min, respectively, and in 14 subjects for both TRF-power and TRF-peak after 18 min.
Figure 1. An example of the cross-correlation function between speech envelope and EEG from subject 1 for channel Fz. The x-axis indicates delay between envelope and EEG in ms. The y-axis indicates correlation value. The area between the dotted lines indicates the 5% bootstrap confidence interval. The maximum value corresponds to the XCOR index for this recording, and is clearly statistically significant.
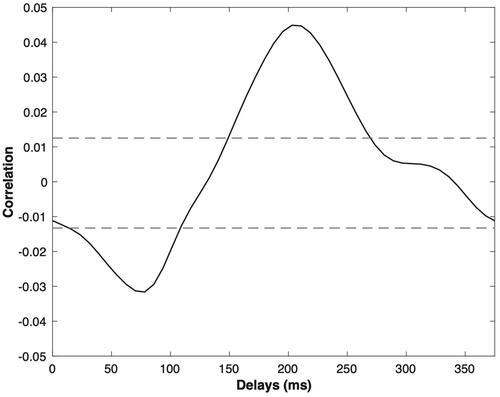
Figure 2. An example of the TRF-filter waveform from subject 1 for channel Fz. The x-axis indicates delay between envelope and EEG in ms. The y axis indicates the magnitude of the TRF impulse response.
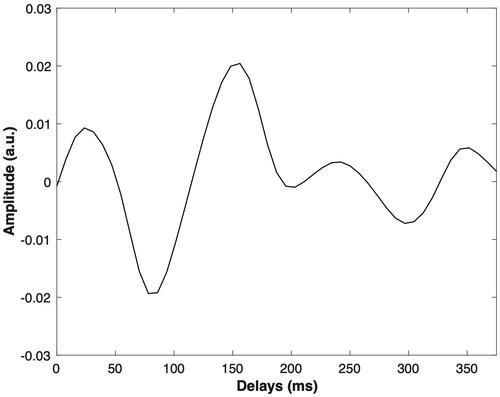
Figure 3. The number of subjects showing responses for each of the four parameters used in the analysis with progressively increasing amounts of data. (A) EEG data from the Fz channel. (B) EEG data from the Cz channel. Results are shown for forward speech and reverse speech (null hypothesis). For the latter, fewer than three detections were expected according to the 95% range of a binomial distribution of 17 measurements at p < 0.05.
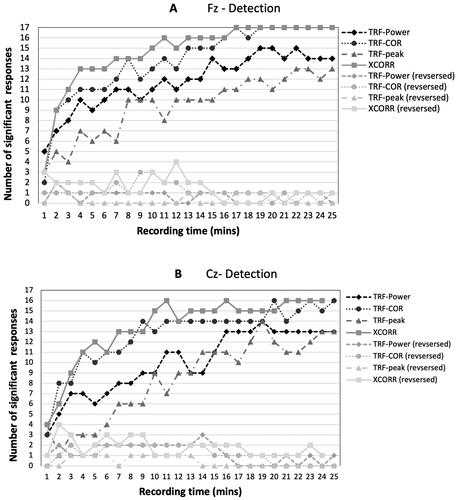
For the time-reversed speech, any detections are false positives. shows that these are well-controlled, remaining within the expected range (0–3 significant responses) in all cases except one in both panels A and B. Given the large number of tests carried out, a small number of exceptions can be expected.
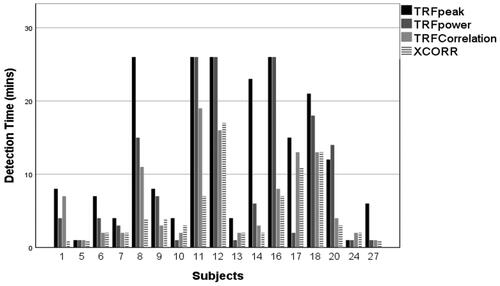
As the highest single-channel sensitivity was found at Fz, this channel was then used to compare mean detection times; shows mean detection times across subjects for the four parameters, Shapiro Wilk testing revealed that recording time data was not normally distributed (p < 0.05). A non-parametric Friedman test showed an overall significant difference between the parameters (p < 0.05). Wilcoxon Signed Ranks tests for related samples were conducted across pairs of parameters. The mean detection time for XCOR at 4.82 min, was significantly lower than both the TRF-power and TRF-peak (p < 0.05 and p < 0.01, respectively). The TRF-COR mean detection time of 6.41 min was significantly lower than that of the TRF peak (p < 0.01). shows the distribution of all subjects' detection time for EEG data recorded from Fz. A detection time of 26 min indicated that no response had been detected at 25 min into the recording. High variability in detection time across the subjects can be seen (e.g. XCOR showed detection after 2 min in subject 13, and 17 min in subject 17). In some subjects (e.g. 5and 24), all methods detected responses rapidly, e.g. by 3 min, while the methods struggled to detect responses in other subjects (e.g. 11 and 12).
Figure 4. Mean detection times of the four parameters (TRF-peak, TRF-Power, TRF-COR, and XCOR) at Fz. Error bars represent standard error.
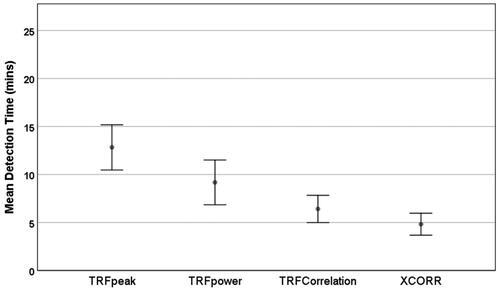
Figure 5. Detection times for individual subjects at Fz with each of the four detection parameters (TRF-Power, TRF-COR, TRF-Peak, and XCOR).
Detection times selecting the best correlated channel from multiple channels
The analysis was repeated to test the possibility of improving detection rates by analysing multichannel data, then selecting the channel with the highest correlation value. Only the TRF-COR and XCOR parameters were used for this analysis because they exhibited the best performance in the previous section. shows the detection rates of TRF-COR and XCOR when using one channel only (Fz), when selecting the channel with the highest correlation value from the set of 6 channels and when selecting the channel with the highest correlation value from all 30 channels. Due to long computational times, results are displayed only for 5 min increases in time. As expected, detection rates increase with recording time with all methods. Selecting the best channel for each subject yielded a reduction in sensitivity compared to the use of Fz alone at all time-points (except when all signals showed a response at 20 or 25 min). The decrease was more significant when all the 30 channels were included, compared to using only six channels in the fronto-central scalp region.
Figure 6. Detection rate of (A) XCOR and (B) TRF-COR parameters, analysed with three sets of EEG data: Fz only (dotted line), the best from 30-channels (dash-dotted line) and the best channel from six channels [Cz, Fz, F3, F4, FC1, and FC2] (dashed line).
![Figure 6. Detection rate of (A) XCOR and (B) TRF-COR parameters, analysed with three sets of EEG data: Fz only (dotted line), the best from 30-channels (dash-dotted line) and the best channel from six channels [Cz, Fz, F3, F4, FC1, and FC2] (dashed line).](/cms/asset/57c8bd27-2efe-4839-b75e-ee870dbd22e6/iija_a_2035832_f0006_b.jpg)
For the single-channel Fz analysis, 17 subjects show significant responses after 20 min using both parameters. When using six channels, XCOR detected responses in all subjects (17) after 20 min, but TRF-COR did not reach 100% detection. Using all channels did not achieve detection in all subjects for either parameter. The maximum number of subjects in which detection was achieved using all channels was 16 for TRF-COR, and 15 for XCOR. The overall multichannel analysis did not perform as well as single-channel analysis at Fz.
shows the measured false positive rate for each of the parameters. All the methods produced a false positive rate close to the expected value of 5%, or 50 out of 1000 (within the 95% range of detection rate values expected from the binomial distribution when using a test at p < 0.05 with 1000 repetitions, i.e. between 37 and 64 false positives).
Table 2. Analysis of false positives (FP) rates for all analysis methods using white noise as input and output signals.
Discussion
Our main objective was to assess the feasibility of using EEG data from a single channel to detect cortical responses to continuous running speech. Two approaches for analysis were compared to determine the presence of responses; cross-correlation and parameters obtained from the TRF analysis. Cortical responses were detectable in all subjects from the Fz channel using the cross-correlation (XCOR) and the TRF correlation (TFR-COR) parameters. The detection rate reached 100 percent after 17 min for both parameters. The mean detection time for XCOR of 4.82 min was numerically lower than that of TRF-COR at 6.41 min, but the difference was not statistically significant in this relatively small sample. A post-hoc power analysis indicated that, for a difference of 1.59 min between XCOR and TRF-COR, 41 subjects would be needed to detect this with 80% power at p < 0.05. Our study was therefore underpowered to detect this relatively small difference; a larger study would be needed to explore this possible difference further. The performance of both parameters suggests good potential for single-channel clinical measurements. The cross-correlation parameter has an additional advantage in that it is computationally less complex than the TRF-COR calculation. In contrast, response detection using TRF parameters TRF-peak and TRF-power failed to reach 100% detection in either channel even after 25 min, clearly suggesting that they are less sensitive, with significantly elevated detection times compared to those of XCOR. It should be noted that the current study used a Biosemi system with active electrodes. Other systems with passive electrodes may have different noise levels, and it may be useful to compare detection times on other systems in the future.
In the present work, the correlation coefficient values for XCOR and TRF-COR were consistent with what has been found in previous literature. The XCOR correlation coefficient means were r = + 0.04 (maximum peak) SD (0.004) and r = −0.03 (minimum trough) SD (0.004). This finding is broadly in line with correlation coefficient values reported by Kong, Mullangi, and Ding (Citation2014), r = +0.07 and r = −0.03. In the TRF analysis, the mean correlation coefficient between the predicted and the actual speech envelope was r = 0.06 ± 0.005 SD. Previous work by Di Liberto, O'Sullivan, and Lalor (Citation2015) and Di Liberto and Lalor (Citation2017) showed similar correlations of r = 0.05 and r = 0.06, respectively.
When using the TRF method, the correlation coefficient between predicted and actual responses is currently the most popular parameter for assessing model performance (Di Liberto, O'Sullivan, and Lalor Citation2015; Di Liberto and Lalor Citation2017; Kalashnikova et al. Citation2018; Drennan and Lalor Citation2019; Jessen et al. Citation2019). However, other parameters from the waveform of the filter, such as peak and latency, may potentially give additional information regarding the responses. Attention effects on cortical tracking show a significant increase in TRF peak-to-peak amplitude when attending to the stimuli (Vanthornhout, Decruy, and Francart Citation2019). In the present study, the detection sensitivity of the parameters TRF-peak and TRF-power was compared to the TRF-COR at the individual level. TRF-COR was able to detect responses in all subjects whereas TRF-peak and TRF-power (which represent the shape of the TRF) showed non-significant responses in some subjects. One possible explanation for the weak detection performance of those parameters is the use of single-channel instead of multichannel analysis. Vanthornhout, Decruy, and Francart (Citation2019) used a multichannel approach instead. As in the current paper they applied forward modelling, however, the final TRF was the average of the channels that contributed most to the difference in response between conditions per a cluster-based analysis. Their finding indicates that the peak-to-peak amplitude of the TRF has a higher sensitivity when multiple channels are combined.
Another explanation for the poor performance of single-channel parameters that are based on the shape of the TRF might be related to the modelling of noise from frequencies irrelevant to the response. Because the impulse response attempts to model all frequencies in the input and output, frequencies above the filter cut-off frequency of 30 Hz to half the sampling rate contain little information regarding the input-output relationship and this may have impacted the reliability of the TRF-peak and TRF-power parameters. The issue may not be important when using TRF-COR as that parameter is not affected by the shape of the TRF response specifically.
Both the cross-correlation and the TRF approaches were successfully used previously in detecting the auditory system's responses to continuous running speech (Lalor et al. Citation2009; Kong, Mullangi, and Ding Citation2014). It should be noted that the TRF and cross-correlation would be identical for white-noise inputs, but TRF takes the autocorrelation function (i.e. the spectrum) of the input signal also into account (Crosse et al. Citation2016). Calculating the statistical significance of the peak of cross-correlation cannot easily be done using conventional statistical methods as (1) the samples in each signal are correlated (i.e. the signals are not white), and (2) the maximum cross-correlation value needs to be determined within specific response time lags and then compared to the maximum cross-correlation of similar lags in noise, it is not just a case of finding significance at each time-lag. In the present study, the effect of autocorrelation on the XCOR parameter test statistic was taken into account through bootstrap analysis, which uses the original signals, but with random misalignment (to reflect the null hypothesis).
The minimum time required to detect significant cortical responses was assessed previously by Di Liberto and Lalor (Citation2017). Using a subject-specific model, they found that at least 30 min of recording were needed to detect a significant level of phoneme activity across subjects. They used the correlation value between the predicted and actual EEG responses to assess the model's accuracy. Contrary to the outcome of Di Liberto and Lalor (Citation2017), in the current study the time needed to detect a significant correlation (TRF-COR) in all subjects is just 17 min, and in some subjects responses were detected in 1 min (e.g. subjects 5 and 24) (). However, when comparing these results to Di Liberto and Lalor's, some differences must be noted. First, Di Liberto and Lalor (Citation2017)’s model was built using specific phonemic speech features rather than the overall speech envelope, and individual phoneme responses may be harder to detect than the response to the speech envelope. Second, they averaged the correlation value across 12 channels in the fronto-central region, while the present analysis used a single channel. Averaging multiple channels meant Di Liberto and Lalor might include weak responses, which may actually reduce sensitivity compared to single-channel analysis.
After comparing single-channel detection at Cz and Fz, we explored selecting the best channel from each subject (i.e. the channel with a maximum correlation coefficient between the EEG and the speech envelope) using either six central/frontal electrodes or 30 channels. The aim was to measure any change in the detection rate using the best channel compared to Fz. This approach comes with a high risk of selection bias, as choosing channels with the strongest response can increase the probability of false positives (Kilner Citation2013). To avoid this, each response's statistical significance was determined by estimating the bootstrap distribution across multiple channels. This selection approach may achieve higher correlation values; however, the multichannel bootstrap distribution's critical value is also expected to be higher than that of a single-channel case. As a result, an increase or a loss in sensitivity could conceivably occur with the multichannel method. Indeed, our results show a reduction in sensitivity when analysing responses across many channels and then selecting the best channel compared to using Fz alone. This reduction in sensitivity with multiple channels was most evident when all channels were included, compared to only six pre-selected channels. This suggests that using fewer channels can improve sensitivity because noisy channels without responses are removed. Montoya-Martínez, Bertrand, and Francart (Citation2019) showed that by reducing the number of channels from 64 to 20 in a backward model, the correlation between the reconstructed and actual speech envelopes improved substantially. Of course, this can only be expected if the best channels are retained.
One consideration in the current analysis is the method of validation used. Most previous studies used different sets of EEG data to train and test the model for cross-validation (O'Sullivan et al. Citation2015; Di Liberto and Lalor Citation2017; Vanthornhout, Decruy, and Francart Citation2019). The “leave one out” method is commonly applied, where roughly 80% of the data is used to train the model and the remaining 20% to test it (Crosse et al. Citation2016). However, as one of the present study's analysis objectives was to investigate the effect of time (every minute) on response detection, this approach was not appropriate. It is also debateable if cross-validation is needed when simply detecting responses. We are not using machine learning that is trained on one set of data and then tested on another set. Instead, we measure the TRF parameters and then ask whether they are significant compared to the TRFs of non-aligned data. Although using the same data for training and testing could result in bias and higher correlation values than the “leave one out” method without bootstrapping, by testing the significance using the bootstrap method, critical values used compensate for the potentially biased estimator and hence false positives are avoided. To our knowledge, this approach has not been used previously for cortical responses to speech.
The methods used to analyse responses to continuous speech might potentially be improved in future work: the forward model performance using one channel could be compared to the backward model. This will assess whether the backward model that uses multiple channels can improve detection sensitivity. Other potential developments of methods include limiting the frequency range used to record the TRF-peak parameter (excluding estimation of the transfer function at frequencies not in the response) and focussing the analysis of cross-correlation parameters to more specific time lags where we expect responses to occur.
Conclusion
This paper explored the detection of cortical responses to running speech using a single channel. It was possible to detect significant responses in all subjects (N = 17) using the Fz channel with either the cross-correlation parameter XCOR or the TRF correlation measure TRF-COR. Numerically the XCOR method appears most sensitive with a mean detection time of 4.8 min compared to 6.4 min for TRF-COR, but this difference did not reach statistical significance in this sample. Detection times for the parameters TRF-peak value and TRF-power were significantly higher. The approach of selecting the channel with the highest correlation from multiple channels resulted in a reduction in sensitivity compared to single-channel analysis, most likely due to increases in critical values when using multiple channels. These results are promising for clinical applications using single-channel EEG recordings to detect cortical responses to continuous running speech. However, more work needs to be done to optimise the experimental and analysis protocols, especially for target groups of infants and difficult-to-test adults.
Acknowledgments
This project was funded by the Engineering and Physical Sciences Research Council, United Kingdom (Grant No. EP/M026728/1).
Disclosure statement
No potential conflict of interest was reported by the authors.
References
- Aiken, S. J., and T. W. Picton. 2008. “Human Cortical Responses to the Speech Envelope.” Ear and Hearing 29 (2):139–157. doi:10.1097/aud.0b013e31816453dc.
- BinKhamis, G., Forte, Elia A., Reichenbach, T., O'Driscoll, M., and Kluk K. 2019. “Speech Auditory Brainstem Responses in Adult Hearing Aid Users: Effects of Aiding and Background Noise, and Prediction of Behavioral Measures.” Trends in Hearing 23: 1–20. doi:10.1177/2331216519848297
- BSA. 2018. “Practice Guidance Assessment of Speech Understanding in Noise in Adults with Hearing Difficulties.” In edited by B. Downes, H. Mueller, and L. Turton. British Society of Audiology.
- Carter, L., M. Golding, H. Dillon, and J. Seymour. 2010. “The Detection of Infant Cortical Auditory Evoked Potentials (CAEPs) Using Statistical and Visual Detection Techniques.” Journal of the American Academy of Audiology 21 (5): 347–356. doi:10.3766/jaaa.21.5.6.
- Chesnaye, M. A., S. L. Bell, J. M. Harte, and D. M. Simpson. 2018. “Objective Measures for Detecting the Auditory Brainstem Response: Comparisons of Specificity, Sensitivity and Detection Time.” International Journal of Audiology 57 (6): 468–478. doi:10.1080/14992027.2018.1447697.
- Crosse, M. J., G. M. Di Liberto, A. Bednar, and E. C. Lalor. 2016. “The Multivariate Temporal Response Function (mTRF) Toolbox: A MATLAB Toolbox for Relating Neural Signals to Continuous Stimuli.” Frontiers in Human Neuroscience 10: 604. doi:10.3389/fnhum.2016.00604.
- Decruy, L., J. Vanthornhout, and T. Francart. 2020. “Hearing Impairment is Associated with Enhanced Neural Tracking of the Speech Envelope.” Hearing Research 393: 107961. doi:10.1016/j.heares.2020.107961.
- Di Liberto, G. M., and E. C. Lalor. 2017. “Indexing Cortical Entrainment to Natural Speech at the Phonemic Level: Methodological Considerations for Applied Research.” Hearing Research 348: 70–77. doi:10.1016/j.heares.2017.02.015.
- Di Liberto, G. M. O'Sullivan, J. A. and Lalor E. C. 2015. “Low-Frequency Cortical Entrainment to Speech Reflects Phoneme-Level Processing.” Current Biology 25 (19): 2457–2465.
- Ding, N., and J. Z. Simon. 2013. “Adaptive Temporal Encoding Leads to a Background-Insensitive Cortical Representation of Speech.” The Journal of Neuroscience 33 (13): 5728–5735.
- Drennan, D. P., and E. C. Lalor. 2019. Cortical Tracking of Complex Sound Envelopes: Modeling the Changes in Response with Intensity. eNeuro 6: 1–11.
- Easwar, Vijayalakshmi, Laura Beamish, Steven Aiken, Jong Min Choi, Susan Scollie, and David Purcell. 2015. “Sensitivity of Envelope following Responses to Vowel Polarity.” Hearing Research 320: 38–50. doi:10.1016/j.heares.2014.11.008.
- Easwar, V., D. W. Purcell, S. J. Aiken, V. Parsa, and S. D. Scollie. 2015. “Effect of Stimulus Level and Bandwidth on Speech-Evoked Envelope following Responses in Adults with Normal Hearing.” Ear and Hearing 36 (6): 619–634. doi:10.1097/AUD.0000000000000188.
- Easwar, V., S. Scollie, S. Aiken, and D. Purcell. 2020. “Test-Retest Variability in the Characteristics of Envelope following Responses Evoked by Speech Stimuli.” Ear and Hearing 41 (1): 150–164. doi:10.1097/AUD.0000000000000739.
- Forte, A. E., O. Etard, and T. Reichenbach. 2017. “The Human Auditory Brainstem Response to Running Speech Reveals a Subcortical Mechanism for Selective Attention.” eLife 6: e27203. doi:10.7554/eLife.27203.
- Grill-Spector, K., R. Henson, and A. Martin. 2006. “Repetition and the Brain: Neural Models of Stimulus-Specific Effects.” Trends in Cognitive Sciences 10 (1): 14–23. doi:10.1016/j.tics.2005.11.006.
- Hall, J. W. 2015. eHandbook of Auditory Evoked Responses.
- Jessen, S., L. Fiedler, T. F. Munte, and J. Obleser. 2019. “Quantifying the Individual Auditory and Visual Brain Response in 7-Month-Old Infants Watching a Brief Cartoon Movie.” Neuroimage 202: 116060. doi:10.1016/j.neuroimage.2019.116060.
- Kalashnikova, M., V. Peter, G. M. Di Liberto, E. C. Lalor, and D. Burnham. 2018. “Infant-Directed Speech Facilitates Seven-Month-Old Infants' Cortical Tracking of Speech.” Scientific Reports 8 (1): 13745. doi:10.1038/s41598-018-32150-6.
- Kilner, J. M. 2013. “Bias in a Common EEG and MEG Statistical Analysis and How to Avoid It.” Clinical Neurophysiology 124 (10): 2062–2063. doi:10.1016/j.clinph.2013.03.024.
- Kong, Y.-Y., A. Mullangi, and N. Ding. 2014. “Differential Modulation of Auditory Responses to Attended and Unattended Speech in Different Listening Conditions.” Hearing Research 316: 73–81. doi:10.1016/j.heares.2014.07.009.
- Lalor, E. C., and J. J. Foxe. 2010. “Neural Responses to Uninterrupted Natural Speech Can Be Extracted with Precise Temporal Resolution.” The European Journal of Neuroscience 31 (1): 189–193. doi:10.1111/j.1460-9568.2009.07055.x.
- Lalor, E. C., A. J. Power, R. B. Reilly, and J. J. Foxe. 2009. “Resolving Precise Temporal Processing Properties of the Auditory System Using Continuous Stimuli.” Journal of Neurophysiology 102 (1): 349–359. doi:10.1152/jn.90896.2008.
- Lv, J., D. M. Simpson, and S. L. Bell. 2007. “Objective Detection of Evoked Potentials Using a Bootstrap Technique.” Medical Engineering & Physics 29 (2): 191–198. doi:10.1016/j.medengphy.2006.03.001.
- Montoya-Martínez, J., A. Bertrand, and T. Francart. 2019. “Optimal Number and Placement of EEG Electrodes for Measurement of Neural Tracking of Speech.” bioRxiv 800979.
- Novis, K., and S. Bell. 2019. “Objective Comparison of the Quality and Reliability of Auditory Brainstem Response Features Elicited by Click and Speech Sounds.” Ear and Hearing 40 (3): 447–457. doi:10.1097/AUD.0000000000000639.
- O'Sullivan, James A., Alan J. Power, Nima Mesgarani, Siddharth Rajaram, John J. Foxe, Barbara G. Shinn-Cunningham, Malcolm Slaney, et al. 2015. “Attentional Selection in a Cocktail Party Environment Can Be Decoded from Single-Trial EEG.” Cerebral Cortex 25 (7): 1697–1706. doi:10.1093/cercor/bht355.
- Power, A. J., J. J. Foxe, E.-J. Forde, R. B. Reilly, and E. C. Lalor. 2012. “At What Time is the Cocktail Party? A Late Locus of Selective Attention to Natural Speech.” European Journal of Neuroscience 35 (9): 1497–1503. doi:10.1111/j.1460-9568.2012.08060.x.
- Skoe, E., and N. Kraus. 2010. “Auditory Brain Stem Response to Complex Sounds: A Tutorial.” Ear and Hearing 31 (3): 302–324. doi:10.1097/AUD.0b013e3181cdb272.
- Somers, B., E. Verschueren, and T. Francart. 2019. “Neural Tracking of the Speech Envelope in Cochlear Implant Users.” Journal of Neural Engineering 16 (1): 016003. doi:10.1088/1741-2552/aae6b9.
- Vanheusden, F. J., M. A. Chesnaye, D. M. Simpson, and S. L. Bell. 2019. “Envelope Frequency following Responses Are Stronger for High-Pass than Low-Pass Filtered Vowels.” International Journal of Audiology 58 (6): 355–362. doi:10.1080/14992027.2018.1562243.
- Vanheusden, Frederique J., Mikolaj Kegler, Katie Ireland, Constantina Georga, David M. Simpson, Tobias Reichenbach, Steven L. Bell, et al. 2020. “Hearing Aids Do Not Alter Cortical Entrainment to Speech at Audible Levels in Mild-to-Moderately Hearing-Impaired Subjects.” Frontiers in Human Neuroscience 14: 109–109. doi:10.3389/fnhum.2020.00109.
- Vanthornhout, J., L. Decruy, and T. Francart. 2019. “Effect of Task and Attention on Neural Tracking of Speech.” Frontiers in Neuroscience 13: 977. doi:10.3389/fnins.2019.00977.
- Vanthornhout, J., L. Decruy, J. Wouters, J. Z. Simon, and T. Francart. 2018. “Speech Intelligibility Predicted from Neural Entrainment of the Speech Envelope.” Journal of the Association for Research in Otolaryngology 19 (2): 181–191. doi:10.1007/s10162-018-0654-z.
- Verschueren, E., B. Somers, and T. Francart. 2019. “Neural Envelope Tracking as a Measure of Speech Understanding in Cochlear Implant Users.” Hearing Research 373: 23–31. doi:10.1016/j.heares.2018.12.004.