
Abstract
Objective
Objective measurement of audibility (verification) using bone conduction devices (BCDs) has long remained an elusive problem for BCDs. For air conduction hearing aids there are well-defined and often used objective methods, and the aim of this study is to develop an objective method for BCDs.
Design
In a novel setup for audibility measurements of bone-anchored hearing aid (BAHA) attached via a soft band, we used a skin microphone (SM) on the forehead measuring in-situ sound field thresholds, maximum power output (MPO) and international speech test signal (ISTS) responses.
Study sample
Five normal-hearing persons.
Result
Using the electrical output of SM it was possible to objectively measure the audibility of a skin drive BCD, presented as an eSPL-o-gram showing thresholds, MPO and ISTS response. Normalised eSPL-o-gram was verified against corresponding FL-o-grams (corresponding force levels from skull simulator and artificial mastoid (AM)).
Conclusion
The proposed method with the SM can be used for objective measurements of the audibility of any BCDs based on thresholds, MPO and speech response allowing for direct comparisons of hearing and BCD output on the same graph using an eSPL-o-gram. After normalisation to hearing thresholds, the audibility can be assessed without the need for complicated calibration procedures.
Introduction
In the technical part of hearing rehabilitation, the goal is to create conditions for good hearing by providing as much audibility as possible (Hodgetts et al. Citation2010). To measure the audibility of the individual user, objective measuring methods are used. In conventional air-conduction hearing aids, individual real ear measurements (REM) are used where both the targets for amplification and the actual maximum power output (MPO) of the device can be visible in the same Speechmap. REM is a well-defined and validated method to determine the patient is receiving an accurate level of amplification in air conduction devices.
While several objective REM equivalents have been proposed for bone conduction devices (BCD) (Hodgetts et al. Citation2011, Citation2018), a clinically viable objective method to determine audibility is still lacking. In the late 80 s, the skull simulator TU-1000 was developed to objectively measure the frequency response of percutaneous BCDs (Håkansson and Carlsson Citation1989). By using the skull simulator, it is possible to measure the hearing aid's MPO and gain with an artificial load. In this paper, the MPO can be in several domains (sound pressure, force, or voltage) but we keep this notation consistently for all these.
A laboratory study by Hodgetts et al. (Citation2011) showed that an audibility-derived fitting procedure of percutaneous BCDs resulted in better audiometric outcomes than a traditional technology-limited fitting and a patient-derived fitting. The audibility of a BCD is defined by how much of a speech sound really is heard by the patient, i.e. that falls into the dynamic range (DR) of the device. To measure audibility, Hodgetts et al. (Citation2010) investigated three different methods to determine the limiting parameters for measuring the in-situ dynamic range in percutaneous BCDs which were: “Aided sound field approach” where all measures are referred to SPL using a sound probe at the BCD microphone; “Real-ear approach” where all measures are referred to SPL using a sound probe in the occluded ear canal near the tympanic membrane; “Accelerometer approach” where the mechanical input to the skull was measured using an accelerometer at the rear side of a specially designed transducer. It was found that the “Accelerometer approach” was the most accurate method but it is still not in clinical use, probably because quite special arrangements are needed, and that this method is only possible to use with percutaneous BCDs. When the first programmable bone-anchored hearing aids were launched in 2009 it became possible to measure the individual bone conduction (BC) in-situ hearing thresholds using the device transducer via the software. This is similar to the “Accelerometer approach” in Hodgetts et al. (Citation2010) and this procedure was an improvement for the fitting process of BCDs. Still, there is no possibility to visualise the dynamic range in something like a Speechmap. In the absence of other methods, most clinicians working with BCDs are using aided sound field thresholds to evaluate the fitting of the BCD despite the limitations of this method such as test-retest reliability, calibration issues and the need for a response from the individual.
An alternative method based on “effective gain” to determine the fitting ranges of various BCD models has been suggested (Snik et al. Citation2019). The effective gain is based on how well the BCD can close the air-bone gap and is defined by unmasked audiometric bone thresholds minus aided sound field thresholds, both in dB HL.
Also, Mertens et al. (Citation2014) presented a study where they measured the MPO of the BoneBridge (MED-EL, Innsbruck, Austria) using the Auricle REM systems with a probe microphone placed in the contralateral ear canal. In the study, input/output measures were obtained and the individual dynamic range calculated.
When the Bone Conduction Implant was introduced for a clinical study in 2012 (Eeg-Olofsson et al. Citation2014; Håkansson et al. Citation2010), a new question arose on how to verify that the implantable transducer was functioning properly at surgery and afterwards. In a study by Reinfeldt et al. (Citation2019), it was shown that measurements through the nostril, nasal sound pressure, were found to give a higher signal-to-noise ratio than ear canal sound pressure and provide a verification tool for implant function even during surgery. This method works fine as a research tool but is a bit technically challenging to incorporate into clinical practice.
To improve the in-situ audibility measurement methods in view of the drawbacks discussed above we propose in this study to use a modified design of a skin microphone (SM) originally developed by Hodgetts et al. (Citation2018). This SM is placed at the central forehead between the hairline and the eyebrows using a soft band. In this study, also some additional sound isolation of the SM was used to avoid direct aerial sound transmission. With this solution, it is possible to measure not only percutaneous devices but also passive and active transcutaneous devices. In this method, all output variables (threshold, MPO and speech sound) are measured at the same spot and with the same equipment. The dynamic range and audibility of speech can be presented normalised by the subjects' individual hearing thresholds. By normalisation, tricky calibration and transformation procedures are not needed which may further make this method clinically useful. This method should be verified by comparison to FL-o-gram based on a skull simulator and an artificial mastoid as discussed by Hodgetts et al. Citation2018).
Aim of study
The primary aim of this pilot study is to measure the audibility of a BCD in-situ, on normal hearing subjects, using a novel method based on a forehead placed skin microphone. A secondary aim is to verify these results with similar measurements when the BCD is attached to a skull simulator and an artificial mastoid.
Methods and material
Measurement setup
The complete setup for the audibility measurements is presented in Supplemental Figure 1. All measures were taken in a sound-insulated test room with a volume of approximately 16 m3. The custom-made and battery-operated SM in Supplemental Figure 1a consists of an off-the-shelf microphone and a preamplifier circuit incorporated in a sound-insulated metallic casing (Hodgetts el al. 2018). Interiorly, the microphone and the preamplifier are further insulated by foam sealing and a soft ring muff leaving only the microphone inlet open in a hollow portion of the centre. In Supplemental Figure 1b it is shown how the SM is attached to the forehead using a soft band. To reduce the direct sound influence and aerial sound leakage from the speakers, which otherwise may bypass the sound transmission via the BCD during the test, further exterior sound insulation of the SM was provided using an earmuff (Peltor Optime III), as shown in Supplemental Figure 1c.
An Intenso from Cochlear BAS (Mölnlycke, Sweden) was used as a test device and it was attached to the right ear side in all subjects by a soft band towards the skin over the temporal bone. The Intenso was chosen as it is a linear device without non-linear signal processing features besides a soft output limiting compressor. The gain of the device was set to the same level in all subjects with both gain and tone control at max and volume fixed at 2 where 3 is max.
The following different sound field power spectrum measurements were made from the SM comprising: hearing thresholds and MPO using warble tones; International speech test signal (ISTS) at three sound levels; and finally, noise floor and by-pass leakage of sound. Active engagement from the test subjects was only required during the hearing threshold measurements. The uncalibrated voltage output from the SM was measured using a Fast Fourier Transform (FFT) power spectrum and presented in dB re 10 µVolt where the reference level was chosen to give convenient dB values. Graphs of the FFT power spectra are in this paper collectively named “eSPL-o-gram” which is based on the idea to present hearing thresholds and device output with the same reference as in Audiograms (dB re HL), FL-o-grams (dB re 1 µN) and SPL-o-grams (dB re 20µPa), see Hodgetts et al. Citation2018. In this application, SPL values do not have a psycho-acoustic relevance as the SM is only measuring the sound emission from bone vibrations at the skin surface and therefore the prefix “e” is used to refer to the electrical output voltage instead of sound pressure. Furthermore, graphs of speech levels and MPO can also easily be presented normalised by the hearing threshold subtraction. This simplifies the calibration of the full system as sensitivities, window effects, FFT, etc. are all identical for these measures and will thus be cancelled out.
The audibility of a speech signal in a specific patient using a certain BCD is in the eSPL-o-gram illustrated by the part of the speech spectrum falling into the audible range between threshold and MPO. This audible range is also sometimes defined as the maximum audible dynamic range available with that device. Whereas this maximum dynamic range is fixed for a certain device on a certain patient the speech sound spectra can be moved by sound processor software in the fitting process to make the best possible use of the dynamic range thus maximising the audibility.
There are different speech materials developed and it was here decided to use the ISTS. This choice was based on the that it is internationally validated and represents ordinary speech, which is assumed to have less interference with automatic noise and feedback reduction systems used in more advanced sound processors (Holube et al. Citation2010).
For sound field measurements of the thresholds and MPO, the loudspeaker was placed at the level of the subject’s head at 1 m in the frontal direction. This speaker was driven from an AC40 audiometer (Interacoustics AS, Assens, Denmark) via a power amplifier (Rotel RB-976MkII) calibrated for sound field dB HL at the BCD microphone location. The ISTS sound was presented from a miniature speaker (Edifire) placed 25 cm laterally of the BCD microphone under test. Presentation and calibration in dB SPL of the ISTS sound were made using a Callisto system (Interacoustics AS, Assens, Denmark). A reference microphone was controlling the output sound level at the test levels which were 55, 65, and 75 dB SPL respectively. For the sound field threshold and MPO measurements using the BCD, warble tones from the audiometer were used.
In all measurements, the output signal from the SM was measured using an AC coupled, auto-ranging, Agilent 35670 A signal FFT analyser (Keysight Technologies, Santa Rosa, CA, USA) calculating a 400 line amplitude spectrum in Vrms linearly spaced over the frequency range 100–12.9 kHz (Δf = 32 Hz). To improve the signal-to-noise ratio, 40 averages were used requiring a total measurement time of approximately 20 seconds. All power spectra data were exported to Microsoft Excel for postprocessing and presentation. In the spreadsheet, the power average for the standard 1/3 octave frequency band, which have centre frequencies close to the audiometric test frequencies 250, 500, 750, 1k, 1.5k, 2k, 3k, 4k, 6k and 8k Hz, were calculated from the SM response of the ISTS signal (using the average of the quadratic summation of the measured linear Vrms components falling within 1/3 octave bands).
In the aided sound field measurements, deeply inserted earplugs (EARTM ClassicTM, 3 M, USA) were placed bilaterally to avoid direct hearing via the ear canal otherwise bypassing the BCD. No masking was used as a BCD uses both cochleae for the perception of speech cues. Attenuation of these plugs was tested in all subjects by thresholds in a sound field with and without plugs. This attenuation was found to be 35 dB PTA4 (average of 500, 1k, 2k and 4k Hz) with a range of 29–45 dB for the frequencies 250–8k Hz.
To avoid SM noise floor interference that may conceal the true threshold level, the audiometer attenuator at the threshold setting was raised by 30 dB for read-off when the warble tone was presented continuously. A manually placed cursor was used to measure the average Vrms value of the spectrum pulse (width ± 5% around the test frequency). Afterwards, this value was reduced mathematically by 30 dB to obtain the true threshold value.
The MPO was finally determined by increasing the attenuator setting of the warble tone to approximately 80 dB SPL at the BCD microphone. This sound level is assumed to saturate the device and represent the maximum output level of that device. For higher dB SPL values, there is a risk that body conduction or direct leakage may give false and too high MPO values. The cursor was again placed manually to the average Vrms value representing the MPO of the device.
In order to investigate the intra-subject variability of this method, five repeated test-retests using ISTS 65 dB SPL were made on one subject where all equipment was removed (BCD on soft band, earmuff, SM and Callisto ref mic) between each measurement. Test-retest variability was found to be within a PTA4 range of 7.4 dB and with an SD of 2.5 dB. This range was reduced to 4 dB if the equipment was not removed in between.
Material
A total of 5 subjects (3 males, 2 females) participated, who are all members of the research group behind this study. Their average age when tested was 43.6 years (range 24–67 years) and their average PTA4 of the test ear was found to be 5.8 dB HL (range 1.3–10 dB HL), see Supplemental Table 1 for more details.
Due to the limited number of subjects, the statistics made on the results include only averages and standard deviations. The study was conducted in accordance with the principles stated in the Declaration of Helsinki where applicable. Participation in the study was voluntary and no remuneration was given to the test subjects. Ethical approval was approved by Ethical Review Board (Dnr 2019-05103).
Results
eSPL-o-grams of the five test subjects are presented in Supplemental Figure 2 together with the average of all subjects. Threshold and MPO results (squares in Supplemental Figure 2) are based on the warble tone measurement and thus exist only at the audiometric frequencies tested, whereas the speech sound power spectrum is a wideband speech signal which is here presented from 250 to 8 kHz. Values outside this frequency range, down to 100 and up to 12.9 kHz, were left out as they are essentially down in the noise floor and outside the frequency range of interest.
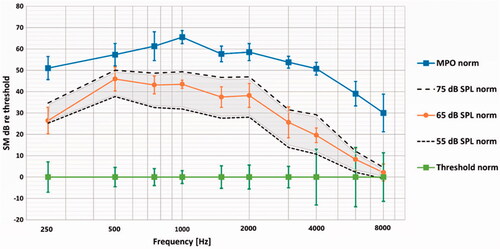
To illustrate the audibility of the ISTS speech sound with the present BCD, the average of all subjects is shown normalised by thresholds set to zero dB in . The area between the 55 and 75 dB SPL curves (dashed lines) are shaded and can represent a sort of speech banana for this speech material in these subjects using the same BCD. As seen in , most of the speech sounds are audible except at the highest frequencies. This loss of sensitivity is expected as skin damping will gradually limit the high-frequency response.
Figure 1. Average MPO and ISTS speech spectrum normalised by thresholds (set to 0 dB) at audiometric frequencies. Corresponding ±1 standard deviations are shown for thresholds, 65 dB SPL and MPO.
Discussion
Method
It has for a long time been a desire to find an objective method to measure the audibility of a BCD in-situ. In this paper, we propose a method based on a sound-insulated SM placed on the forehead as a sensor for bone vibration that seems to have the potential to solve this challenge/problem. We use the power spectrum at the SM output of both speech signal as well as warble tones at the hearing threshold and MPO. Justification for this comparison can be found in Rogala and Letowski (Citation2015) who investigated the literature for comparing hearing thresholds obtained with pure tones and narrow-band noise and found them effectively identical up to 4000 Hz for earphone listening. They found no studies comparing free field or diffuse field thresholds but stated that it is commonly assumed that narrow-band signals with a width less than a critical band, like 1/3 octave band noise, produce hearing thresholds like pure tones.
The choice of forehead placement of the SM can be discussed but it is easier to use clinically as compared to a nasal probe (Reinfeldt et al. Citation2019) or an ear canal placement (Mertens et al. Citation2014). A forehead location is also independent of which side is used for the BCD.
eSPL-o-grams
Regarding the average results as seen in , the lower average audibility at higher frequencies can probably be explained by poorer sound transmission using a skin drive BCD, as the Intenso attached with the soft band (Håkansson et al. Citation1984). Moreover, direct-drive BCDs are expected to give higher audibility at high frequencies which will be investigated in a future study on such patients.
On the individual level (Supplemental Fig. 2) one of the subjects (No 3) has a high-frequency hearing loss. It should be noted that if a patient has a more severe sensory-neural hearing loss, the threshold response signal from the SM will be higher and a +30 dB read-off procedure may not be necessary.
Noise floor and aerial sound leakage
At higher frequencies, the 55, 65 and 75 dB SPL ISTS speech responses merge in Supplemental Figure 2 indicating that they are limited by the noise floor of the system and close to the hearing thresholds in that frequency region. The noise floor and leakage of external sound directly to the SM were therefore further investigated. Contributions to the noise floor were measured via the BCD and the SM combined “Noise floor Intenso ON”; only the SM “Noise floor Intenso OFF”; and the leakage of external speech sound directly to the SM without passing through the BCD “75 dB SPL Intenso OFF”. All results are presented in Supplemental Figure 3. The BCD noise floor can be assumed to originate from a combination of the room background noise and its microphone inherent noise whereas the SM noise floor is assumed to originate from its microphone inherent noise and body sounds (heartbeat and breathing). The influence of breathing was investigated separately and found to slightly elevate the noise floor at low and medium frequencies but was considered negligible. Holding the breath was not used during these investigations but the subject was instructed to breath calmly during the measurement time of approximately 20 seconds.
From these noise floor results in Supplemental Figure 3 one can conclude that the noise floor of the SM and the BCD is far below the speech level of main interest (ISTS 65 dB SPL) for all frequencies. With the Intenso ON, microphone noise or possibly amplified test room noise is a bit higher than the SM noise alone (Intenso OFF) in the mid-frequency range, see dashed line in Supplemental Figure 3. It was also found that the sound insulation provided by the SM casing and the additional earmuff is sufficient as even the leakage from 75 dB SPL speech sound level picked up by the SM with the Intenso OFF, is sufficiently below the aided 65 dB SPL speech sound (Intenso ON) over the whole frequency range of interest.
Verification eSPL-o-gram using skull simulator and artificial mastoid
To verify the present eSPL-o-gram in-situ results obtained on the five subjects using the SM approach, a comparison was made with the FL-o-gram measured on couplers for direct drive BCD (skull simulator) and skin drive BCD (artificial mastoid). These force measurements should theoretically give the same results in terms of audibility if normalised by hearing thresholds.
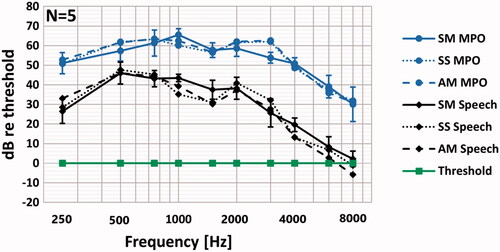
In this investigation the Intenso was attached via snap coupling to a skull simulator TU-1000 (Håkansson and Carlsson Citation1989) and via a soft band to an artificial mastoid (B&K 4930) with approximately 4 Newtons contact force. The Intenso had the same fixed gain and frequency response settings as in the SM investigation. Both couplers were placed in the position for the subject’s head and were fixed to the test neck support of the chair. Same warble tone levels for threshold and MPO as well as the ISTS 65 dB SPL speech as was used in the SM measurement were presented to the Intenso. The normalised audibility results from the three methods are shown in . Obviously, the normalised speech and MPO levels are very similar across methods.
Figure 2. Present normalised eSPL-o-gram in dB relative to the threshold of the Intenso attached in-situ with soft band compared to normalised FL-o-gram obtained by the same device attached to a Skull simulator (SS) and an Artificial mastoid (AM). Thresholds, MPO and speech spectrum from ISTS 65 dB SPL, with standard deviation are shown at audiometric frequencies.
This resemblance across methods is a strong indication for that the proposed, relatively simple method using the SM at the forehead for audibility measurement of BCDs in-situ, is a viable method. This novel method will be further investigated in planned studies on real patients to measure the in-situ audibility and possibly also improve the fitting of their BCDs.
Conclusions
In this study, the audibility of normal hearing subjects using a skin drive BCD, was measured in situ. The dynamic range was obtained from a skin surface microphone at the same spot on the forehead measuring thresholds, MPO and speech levels.
The results were verified with similar measurements with the BCD attached to a skull simulator and an artificial mastoid. The proposed novel method to objectively measure the audibility, normalised by hearing thresholds, was found to be feasible in a clinical setup and can be used for any BCD without the need for calibration procedures.
Supplemental Material
Download MS Word (138.7 KB)Supplemental Material
Download MS Word (301 KB)Supplemental Material
Download MS Word (362.8 KB)Supplemental Material
Download MS Word (26.5 KB)TIJA-2021-07-0293-File002.docx
Download MS Word (12.5 KB)Disclosure statement
The authors report no declaration of interest.
Additional information
Funding
References
- Eeg-Olofsson, Måns, Bo Håkansson, Sabine Reinfeldt, Hamidreza Taghavi, Henrik Lund, Karl-Johan Fredén Jansson, Emil Håkansson, and Joacim Stalfors. 2014. “The Bone Conduction implant-first implantation, surgical and audiologic aspects.” Otology and Neurotology 35 (4): 679–685. doi:10.1097/MAO.0000000000000203.
- Håkansson, B., and P. Carlsson. 1989. “Skull Simulator for Direct Bone Conduction Hearing Devices.” Scandinavian Audiology 18 (2): 91–98. doi:10.3109/01050398909070728.
- Håkansson, B., S. Reinfeldt, M. Eeg-Olofsson, P. Östli, H. Taghavi, J. Adler, and G. Granström. 2010. A novel bone conduction implant (BCI): engineering aspects and pre-clinical studies.
- Håkansson, B., A. Tjellström, and U. Rosenhall. 1984. “Hearing Thresholds with Direct Bone Conduction versus Conventional Bone Conduction.” Scandinavian Audiology 13 (1): 3–13. doi:10.3109/01050398409076252.
- Hodgetts, W., D. Scott, P. Maas, and L. Westover. 2018. “Development of a Novel Bone Conduction Verification Tool Using a Surface Microphone: Validation with Percutaneous Bone Conduction Users.” Ear and Hearing 39(6): 1157–1164. doi:10.1097/AUD.0000000000000572.
- Hodgetts, W. E., P. Hagler, B. E. V. Håkansson, and S. D. Soli. 2011. “Technology-Limited and Patient-Derived versus Audibility-Derived Fittings in Bone-Anchored Hearing Aid Users: A Validation Study.” Ear and Hearing 32 (1): 31–39. doi:10.1097/AUD.0b013e3181f0b685.
- Hodgetts, W. E., B. E. V. Håkansson, P. Hagler, and S. Soli. 2010. “A Comparison of Three Approaches to Verifying Aided Baha Output.” International Journal of Audiology 49 (4): 286–295. doi:10.3109/14992020903142676.
- Holube, I., S. Fredelake, M. Vlaming, and B. Kollmeier. 2010. “Development and Analysis of an International Speech Test Signal (ISTS).” International Journal of Audiology 49 (12): 891–903. doi:10.3109/14992027.2010.506889.
- Mertens, G., J. Desmet, A. F. M. Snik, and P. v d Heyning. 2014. “An Experimental Objective Method to Determine Maximum Output and Dynamic Range of an Active Bone Conduction Implant: The Bonebridge.” Otology and Neurotology 35 (7): 1126–1130. doi:10.1097/MAO.0000000000000347.
- Reinfeldt, S., C. Rigato, B. Håkansson, K. J. Fredén Jansson, and M. Eeg-Olofsson. 2019. “Nasal Sound Pressure as Objective Verification of Implant in Active Transcutaneous Bone Conduction Devices.” Medical Devices: Evidence and Research 12: 193–202. doi:10.2147/MDER.S197919.
- Rogala, T., and T. Letowski. 2015. Perceptual Calibration of Narrow-Band Noise Signals For Audio Applications. 16th International Symposium on Sound Engineering and Tonmeistering, Warszawa, 8–10 October 2015.
- Snik, Ad, Hannes Maier, Bill Hodgetts, Martin Kompis, Griet Mertens, Paul van de Heyning, Thomas Lenarz, and Arjan Bosman. 2019. “Efficacy of Auditory Implants for Patients with Conductive and Mixed Hearing Loss Depends on Implant Center.” Otology and Neurotology 40 (4): 430–435. doi:10.1097/MAO.0000000000002183.