
 ?Mathematical formulae have been encoded as MathML and are displayed in this HTML version using MathJax in order to improve their display. Uncheck the box to turn MathJax off. This feature requires Javascript. Click on a formula to zoom.
Abstract
Objective
The delay in digital hearing aids is known to cause distortions due to the mixing of the delayed hearing aid sound with the undelayed direct sound. The most apparent delay-based distortion is a pitch sensation referred to as coloration-pitch. This study investigated coloration-pitch discrimination at the lower end of typical hearing aid delays and aimed at establishing thresholds where a large change in coloration-pitch is just perceptible.
Design
Simulations were verified against a reference hearing aid for numerous conditions of delay, insertion gain and incident direction. The simulations were used in a psycho-acoustics experiment in which coloration-pitch discrimination thresholds were measured as a function of hearing aid delay and gain. Participants discriminated between coloration-pitches produced by delay changes of 12%. Insertion gains compensating for mild to moderate hearing losses were used.
Study Sample
Nine normal-hearing and twelve hearing-impaired participants with mild to moderate hearing loss participated.
Results
The simulations accurately reflected the acoustics of the open-fit hearing aid. Discrimination thresholds were between 0.3 ms and 1 ms depending on insertion gain and hearing status.
Conclusions
High sensitivity for changes in coloration-pitch was found for delays >1 ms. For shorter delays participants were increasingly insensitive to changes in coloration-pitch.
Introduction
Digital hearing-aids (HA) have an inherent delay which is defined as the time that elapses between the acoustic signal being picked up by the HA microphones and the processed signal being played back via the HA loudspeaker. The delay depends on the signal processing and both the amount and frequency shape varies among HA manufacturers, see e.g. Balling et al. (Citation2020).
For HA users the sound of an event reaches the eardrum on three possible paths: bone-conducted, air-conducted through the vent and leakage of the hearing device (direct sound), and air-conducted via the amplified sound of the HA. The bone-conducted path only has relevance for the perception of the own voice, whereas the two air-conducted paths are interacting for all other stimuli coming from outside. This paper will disregard the bone-conducted pathway and only deal with the two air-conducted pathways. When the processed and delayed HA sound mixes with the direct and undelayed sound, distortions occur in the spectrum of the mixed signal. These delay-based distortions have the shape of periodic notches and peaks in the spectrum and are referred to as the comb-filter effect. The amount of distortions depends on the delay, the gain in the HA and the type of earmold used. For HAs with open fittings or large vents the delay is particularly critical, because HAs with such fittings typically exhibit a pronounced comb-filter effect and an extended frequency range where direct and HA sound are approximately equal in level.
The perception of HA delay has often been investigated by measuring the disturbance of a sound with a given delay or by ratings of sound quality. Researchers were typically interested in establishing the upper limit of acceptable HA delays. Groth and Birkmose (Citation2004), for example, measured the disturbance of sound produced by delays of 2, 4, and 10 ms in non-occluding hearing aid fittings. No disturbance was reported with 2 ms delay and small disturbance of own voice was reported at 4 ms. Stone et al. (Citation2008) used simulated HAs and evaluated delays of 1 to 15 ms. They found that shorter delays generally resulted in better ratings, but even a delay as short as 1 ms could cause some disturbance, depending on the gain provided by the HA.
Aiming at assessing thresholds for the perception of HA delays, Denk, Ohlmann, and Kollmeier (Citation2021) investigated the detectability of highly controlled delay-based spectral distortions in a simulated HA. Their simulations contained an additional compensation stage that either completely removed the comb-filter or only removed the peaks in the spectrum, thus leaving only the cancellations. Detection thresholds depended on several simulation parameters and the stimulus type. For pink noise, detection thresholds were as low as 0.1 ms on average. Although this work revealed that detectability of spectral distortions due to HA delay are possibly extremely low, the used compensation stages are not applicable in real HAs.
The perceptually most prominent delay-based distortion is the comb-filter effect (Bramsløw Citation2010), which is resulting in a perceived “coloration” of the sound. The perception of a coloration has mainly been investigated in relation to reflections from surrounding surfaces in rooms superimposing the direct sound. A reflection introduces the sensation of a pitch or coloration of the sound (Bilsen Citation1968) and hence this phenomenon has also been referred to as coloration-pitch. Several studies have investigated the perception of coloration due to a single reflection. For broadband noise Atal, Schroeder, and Kuttruff (Citation1962) and Bilsen (Citation1968) measured the detection threshold of coloration, defined as the level of the reflection relative to the direct sound. They found the lowest thresholds at delays between 2 and 5 ms. For longer and shorter delays the thresholds were increased. Buchholz (Citation2011) measured the detection threshold of the coloration as a function of spectral content and delay. The highest sensitivity was found for the shortest measured delay of 2 ms. A general increase of the detection threshold was found with decreasing bandwidth and increasing delay.
In the body of work related to rippled noise pitch, Yost and Hill (Citation1978) used the name “repetition-pitch” for the sensation of the coloration-pitch. Repetition-pitch experiments typically involve a discrimination task for the listener. In a series of experiments Yost and Hill (Citation1978) found that normal-hearing (NH) participants could best distinguish two repetition-pitches in a broadband stimulus at delays between 2 ms and 5 ms. For delays below 1 ms and above 10 ms, discrimination abilities were considerably worse with the lowest sensitivity at a delay of 0.5 ms. Leek and Summers (Citation2001) found a similar result for hearing-impaired (HI) listeners with the highest sensitivity at a delay of 4 ms and declining discrimination abilities below and above.
The sensation of a coloration-pitch is particularly of relevance for HA users as it is the most apparent perception of delay-based spectral distortions. The sound in open-fitted HAs is often rated as poor and described as “tube-sound”, “can-sound” or alike (Bramsløw Citation2010). The present work focussed on this distinct perception.
The first aim of this study was to establish the relation between coloration-pitch discrimination and HA delay for listeners with normal and impaired hearing. The research question was to what extent a large change in coloration-pitch continues to be perceivable with decreasing HA delay. The knowledge of coloration-pitch discrimination thresholds may contribute to establish a lower boundary for HA delays, at which a further reduction of delay is beyond the limit of what is perceivable. In previous studies participants rated the disturbance caused by the HA delay or detected delay-based distortions. Detection tasks require test participants to compare a delayed stimulus with an undelayed reference. This implies that cues besides the coloration-pitch may be available to the listener. These include e.g. changes in the spatial qualities of a sound, or temporal cues, such as the perception of an echo. By employing a discrimination task, the only cue available to a listener is the change in coloration. Furthermore, an undelayed reference stimulus is not applicable in real HAs and can only be derived artificially. In the development of HAs or other audio systems where delay is a critical parameter, the question is in practice often if the decrease (or increase) of a given delay is audible and may result in some user benefit (or detriment). This is effectively a discrimination task.
The second aim of this study was to investigate coloration-pitch at very low delays in a realistic manner. Previous studies that employed real HAs (or similar real-time processing devices), were limited by the hardware which was preventing delays at the lower end to be investigated, particularly delays below 1–2 ms. Some studies were circumventing this limitation by using simulations. These have though the disadvantage that important acoustic properties of open-fitted HA were typically disregarded. Particularly, the frequency and phase responses of the HA playing into the open-fit ear-canal and of the direct sound entering the partially obstructed ear-canal have not been considered properly. Omitting the phase or frequency response, the interaction of the direct sound and HA sound may result in unrealistic comb-filter shapes, e.g. erroneous placed peaks and notches in the resulting spectrum or an inaccurate frequency range where the direct and the HA sound interact. Such unrealistic comb-filter shapes may in turn produce coloration-pitch percepts different from those occurring in real HAs. Hence, in order to evaluate coloration-pitch perception in a realistic manner, the acoustic properties of the open-fitted HA must be preserved in simulations. The present study therefore introduces a simulation framework based on impulse responses measured in real open-fitted HAs.
Methods
The simulations presented in this paper aim to predict the aided gain and thus the shape of the comb-filter in open-fit HAs. The predictions were verified against measurements of a real hearing aid for a variety of conditions, including different insertion gains (IG), HA delays and different incident directions of the incoming sound. The latter was necessary as the phase of the incoming sound is dependent on the incident direction. Subsequently, the simulation framework was used for generating the stimuli for the coloration-pitch discrimination experiment.
Simulations setup and equipment
The KEMAR Head and Torso (GRAS 45BB) was placed in an anechoic chamber together with a custom-built loudspeaker at a distance of 1 m away from the KEMAR. The KEMAR could be rotated such that the simulations could be examined at different horizontal incident directions. The KEMAR was equipped with ear-simulators GRAS RA0045 and a standard pinna. Logarithmic sweeps were played from the loudspeaker and recorded with the ear-simulators and additionally with the microphone of a RIC HA in order to retrieve impulse responses as further described below. A FocusRite Scarlett 18i8 sound card and custom-made MATLAB scripts were used for recording with a sampling frequency of 44.1 kHz. The excitation signals were not equalised for the frequency response of the loudspeaker, as this is automatically accounted for in the aided gain measure. The aided gain is defined as the level of the aided response subtracted by the level of the response of the excitation signal, which was derived from a single measurement with a GRAS 40AG microphone, that replaced the KEMAR.
Reference
Widex MOMENT RB2D 440 HAs were used for defining a reference for the aided gain. The HAs operated with a sampling frequency of 33.1 kHz and were fitted with an instant open ear-tip and an M-type receiver. The HAs were placed on the KEMAR head, with the receiver in the canal of the artificial ear. All adaptive features such as noise-reduction, feedback cancellation, sound classification etc. were disabled. No compression was applied and linear amplification was set to one of four different settings; insertion gains (IG) of flat 0 dB and 10 dB and another two IGs compensating for an N2 and S1 hearing loss (Bisgaard, Vlaming, and Dahlquist Citation2010), using an NAL-NL2 rationale with an input of pink noise at 65 dB SPL. Small IGs suitable for mild hearing impairment, were chosen since these gains are most relevant with regards to the comb-filter effect. Initially a fifth IG setting compensating for an N3 hearing loss was planned, however, the measurements were discarded due to problems with feedback since feedback cancellation was deactivated.
The HAs were set up with two programs which differed in the delay. The first program had an almost flat delay of approximately 0.5 ms across the frequency range from 0.5 kHz to 8 kHz. The second program had a frequency-dependent delay of 4 ms at 1 kHz and 2 ms at 8 kHz, with an average delay of 2.6 ms measured in third octave bands from 0.5 kHz to 8 kHz. The gains in the two programs were equivalent with a deviation ≤4 dB.
Typically, open-fit HAs are reducing amplification below 1 kHz in order to minimise the comb-filter effect and achieve better sound quality (Bramsløw Citation2010). However, in order to challenge the simulations with a wide frequency range of interaction between direct sound and HA sound, amplification continued to approximately 0.5 kHz from where it was decreasing with 12 dB/octave towards lower frequencies.
The aided gain reference was measured on both KEMAR ears for all four IGs and six different loudspeaker azimuths α = [90°, 45°, 0°, 180°, −45°, −90°] and for the two HA programs, making up a total of 96 recordings.
Simulator structure
The structure of the HA simulator is depicted in . The simulator is a series of linear filters that simulate the different acoustic and digital paths. The direct sound path is simulated by a single filter hds, whereas the HA path consists of three filters hmic,α, hHA and hrcv and an adjustable delay. These filters will be described below.
Figure 1. Structure of the model with the HA path consisting of three filters and an adjustable delay, and the direct sound path consisting of a single filter. An input signal x is thus filtered by both pathways and summed to the prediction ŷ.
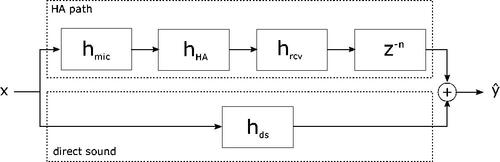
Acoustic parts (hmic and hrcv) of the HA path
The acoustic path from the loudspeaker to the HA microphone is described by the impulse response (IR) hmic,α, with the IR depending on the azimuth angle α from which the loudspeaker is playing. hmic,α was derived for both the left and right KEMAR ear and the same azimuth angles as the reference HAs. For obtaining hmic,α the reference HAs on the KEMAR were replaced with dummy HA shells. These were of same size and shape and had the same microphone as the reference HAs. The shells had a cable attached to the microphone, which was wired to the sound card. In order to measure hmic,α three logarithmic sweeps were played from the loudspeakers with a duration of approximately 3 s each and were recorded using the dummy shell microphone. The frequency range of the sweeps was 0.1 to 10 kHz and the level was 75 dB SPL at a distance of 1 m. Subsequently, the IR was computed using the method described by Müller and Massarani (Citation2001).
The second acoustic path hrcv was from the HA receiver, placed inside the KEMAR ear, to the microphone in the ear-simulator. An open instant fit ear-tip was used. Since the receiver stayed in the ear canal during recordings, this path was considered as static, i.e. not dependent on the incident direction α and was thus only measured once for both ears. Also, for deriving hrcv the reference HAs were replaced with dummy HA shells. A second cable in the HA shells was wired to the receiver and connected to the sound card. Thus, the excitation sweeps were played back through the HA receiver and recorded using the ear-simulator.
HA processing and adjustable delay (hHA and z−n)
The digital signal processing in the simulated HA is represented by hHA and an adjustable delay z−n, with n being the delay in samples. hHA consisted of a linear filter that either resembled the digital processing in the reference HA for the 0.5 ms delay or the frequency-dependent HA delay. That is, the filter would maintain the delay that the reference HA exhibited in the two programs. This was realised by custom made MATLAB code. The filter applied one of the four different insertion gain settings. Lastly, an adjustable delay was applied to the HA path. This made it possible for the simulator to account for a continuum of different HA delays.
Measuring the direct sound
Similar to hmic,α the IR for the direct sound hds,α was measured over the path from the loudspeaker to the ear-simulator through the vent. hds,α was also derived for both the left and right KEMAR ears with the same azimuth angles as the reference HAs. When recording the direct sound, the reference HAs were kept in place on the KEMAR, but switched off. Thus, the direct sound was entering the partially occluded ear canal. Both hmic,α and hds,α incorporate the variations in the impulse responses due to the different incident directions α.
Experiment setup
Signal processing
The simulation framework was used to create the stimuli for the experiment. Stimuli were generated as coming from the front (α = 0°). In order to simulate the HA path with the lowest possible delay, a minimum phase filter hmin was designed that accounted for the three IRs hmic,0°, hHA and hrcv. The IRs of hds,0° and hmin were up-sampled to a sampling frequency of 192 kHz. With the high sampling frequency, longer HA delays could easily be created by the insertion of additional samples in the beginning of hmin. The thus created HA delays were ranging between 0.15 and 2.2 ms. The substitution of the three IRs by hmin with an extra delay is strictly speaking a change in the structure of the simulations. This can however be done, since the series of the three IRs hmic,0°, hHA and hrcv form a linear, mixed phase filter and can be decomposed into a minimum phase part represented by hmin and an all-pass part. For the 0.5 ms delay setting it turns out that the all-pass part has a linear phase, i.e. the all-pass part can be represented by the additional samples inserted at the beginning of hmin. For example, with an additional delay of approximately 0.4 ms, hmin resembles the three substituted IRs in the simulations for the 0.5 ms delay setting. Hence, hmin can be regarded as the lowest possible delay in the HA path while preserving the acoustic properties in the ear canal, i.e. frequency and phase response.
Since the group delay of hmin was not completely flat relative to the frequency, the delay values were computed as the average group delay of hmin in third octave bands ranging from 0.5 kHz to 8 kHz and the additional samples inserted.
The stimuli in the experiment contained pink noise bursts and were digitally created in MATLAB. The bursts had a duration of 0.8 s with onset and offset flanks of 20 ms. The noise was filtered with hmin and hds,0° respectively, to simulate the HA path and the direct path for a sound coming from the front. Lastly, the two filtered signals were combined to the mixed signal. In order to equalise the headphones and to remove the frequency shaping due to the double transduction through an ear-canal, the mixed signal was post-filtered using a 128-tap minimum phase FIR filter with the inverse frequency response of hds,0°. The processing was done for the left and right channel and signals were presented binaurally via headphones.
For each trial in the experiment two noises were generated: a reference and a target noise. Inspired by the procedure by Leek and Summers (Citation2001) the two noises differed only in the simulated HA delay by 12%. For example, if the target had a delay of 1 ms, the reference had a delay of 1.12 ms, hence producing a target pitch of two semitones higher than the reference pitch. According to Leek and Summers (Citation2001) this is a large pitch difference, resulting in a clear audible difference between the two stimuli. Initial testing confirmed this for a target delay of 1 ms.
Participants
Nine NH participants, of which one was the author, took part in the experiment. They had an age span from 33 to 58 years with a mean of 40 years. Another 12 HI participants took part in the study as well. They had mild to moderate hearing impairment and their pure-tone thresholds as well as their age are given in . Ethical clearance for conducting the study was obtained from the Research Ethics Committee of the Capital Region of Denmark and participants gave written informed consent.
Table 1. Pure-tone thresholds in dB HL for the HI participants.
Procedure
The coloration-pitch discrimination performance was determined in a two-alternative forced-choice (2-AFC) procedure. The participants were seated comfortably in a sound booth, wearing Beyerdynamic DT770 headphones and facing a PC screen in order to give responses on a graphical user interface (GUI). On each trial participants were presented two stimuli (A and B), where each of the stimuli consisted of a pair of pink-noise bursts. One of the pairs A or B consisted of two identical reference noises and the other pair consisted of one reference noise and one target noise. The participants’ task was to identify which of the two stimuli pairs contained the target, i.e. identifying the two noise bursts that differed from each other. Each noise burst had a duration of 0.8 s with a 0.1 s pause between the two bursts. Thus, the total duration of A or B was 1.7 s. A pause of 0.4 s was held between the presentation of A and B.
For the NH participants, the actual testing comprised of three runs of a constant stimuli 2-AFC method, sampling the psychometric function at six different simulated HA delays. The delays of interest were at the lower end of typical HAs, i.e. from the minimum possible delay (approximately 0.1 ms) to a delay just above 2 ms. These values cover the range from the highest to the lowest thresholds for discrimination of coloration-pitches, see e.g. Yost and Hill (Citation1978).
The presentation order of the delays was randomised, and each delay setting was presented 18 times. The three runs differed only in the simulated IG which was 0 dB, an N2 and N3 IG both fitted with NAL-NL2. It should be noted, that the simulations for the N3 IG were not verified against the reference due to feedback problems in the measurement of the reference HA. However, since the simulations generally exhibited a high accuracy across conditions and the audiograms of the HI participants with the highest pure-tone thresholds roughly resembled an N3 hearing loss, it has been decided to also test the N3 settings in the experiment. The presentation level was 65 dB SPL for the NH participants. The presentation order of the different IGs was balanced.
For the HI participants only two runs were performed not testing the 0 dB IG condition as it is not a relevant IG for participants with impaired hearing. The presentation level was adjusted individually for the HI participants, i.e. it was adjusted broadband to the SPL the participants would experience when listening to a pink noise input signal at 65 dB SPL and wearing HAs fitted with their individual hearing loss using a NAL-NL2 rationale. The presentation level thus ranged from 73 dB SPL to 80 dB SPL.
Unlike in the simulations, the common practice of reducing amplification below 1 kHz (Bramsløw Citation2010) has been followed and the gain was decreasing rapidly (with approximately 18 dB/octave) from 1 kHz towards lower frequencies.
Before the proper testing each participant was undergoing a training session. First, in order to introduce the concept of coloration-pitch participants were listening to a continuous pink noise via loudspeaker together with the experimenter. The noise was delayed and added to itself, hence the stimulus had a clear coloration-pitch. The delay could be adjusted by the experimenter and participants were asked to describe what they could hear when the delay was altered. All participants could detect the changes in the coloration-pitch. Second, the participants performed a 2-AFC task, similar to the proper testing, however only three delays were tested and each delay was presented 10 times. The entire session including the training took one to two hours.
Results
Simulations verification
The simulations were verified by comparing the measured with the predicted aided gain. As an example, shows both for an azimuth of 0°, the right KEMAR ear and the four different IGs, as well as the two delay settings. The aided gain is predicted with high accuracy over a wide frequency range for both HA delay settings. In the frequency-dependent delay setting the comb-filter effect is seen clearly for all tested IGs. Further, the notches and peaks in the spectrum are being properly predicted by the simulations. In the 0.5 ms delay setting the number of notches and peaks in the spectrum have been significantly reduced. However sparse, deep notches in the spectrum can be observed at the low IG settings of 0 dB and S1. These are also predicted well in the simulations.
Figure 2. Measured (dashed, thick lines) and predicted (solid, thick lines) aided gain for right ear, 0° and the IGs: 0 dB, 10 dB, S1, and N2. The contribution of the direct sound (DS) and HA sound are indicated by the dotted and dash-dotted line, but offset with -10 dB. Upper panels: 0.5 ms delay, lower panels: frequency-dependent delay. Correlation coefficient r between measurements and simulations is given for each IG.
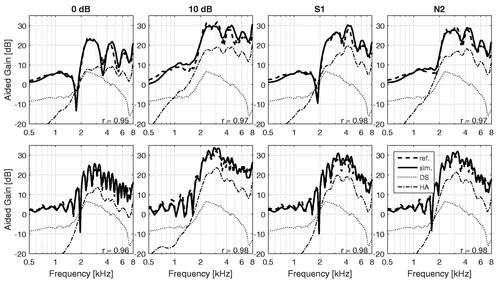
Also depicted in are the relative contributions of the two simulated sound paths (note, these are shown with an offset of −10 dB for better readability). The largest comb-filter effect, i.e. the highest ripple depth in the resulting spectrum can be found at frequencies where the two sound paths are approximately equal in level. It is noteworthy that the interaction persists to high frequencies, although with a much smaller ripple depth.
ERB error measure
Performance of the simulations was evaluated in equivalent rectangular bandwidths (Moore and Glasberg Citation1983), and the error defined as the absolute difference between the mean of the prediction and the mean of the reference for those frequencies within the equivalent rectangular bandwidth. The frequency resolution for the ERB error computation was 0.032 kHz. Compared to computing the level difference in narrower bands, this effectively smoothed the errors that are not perceptually relevant, because these would not be resolved in the auditory filters. In total 96 conditions were measured (four IGs, six azimuth angles, two delays, two ears). For the two different delay settings shows the mean absolute ERB error (ME) and the standard deviation (SD) across the 12 conditions (six angles and two sides). An average ERB error () across the frequency range 0.5 kHz to 8 kHz is also given in each panel. Further, the range of the maximum and minimum error that occurred across the 12 conditions is indicated by the light grey area.
Figure 3. Mean absolute ERB error (solid black line) and SD (dark grey area) of the model relative to the reference across both KEMAR ears and azimuths for the tested IGs: 0 dB, 10 dB, S1, N2. Light grey area indicates the minimum and maximum absolute error that occurred across ears and azimuths. Lower panels show the frequency-dependent delay condition, upper panels the 0.5 ms delay condition.
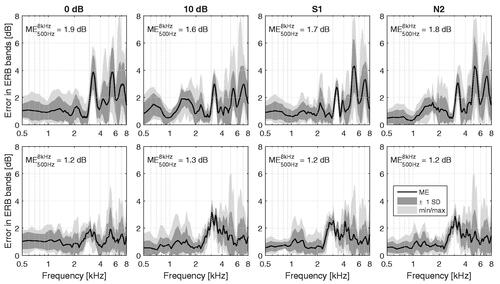
For the frequency range up to 3 kHz, where the comb-filter effect is most pronounced, the ME is below 2 dB for all IGs and the two delay settings. Further, the SD is small and not exceeding 1.3 dB. At frequencies above 4 kHz errors of up to 6–8 dB occurred for some azimuths. The simulations also show slightly lower errors with the frequency-dependent delay relative to the 0.5 ms delay. This finding will be discussed below.
Coloration-pitch discrimination
The mean values of the percent correct scores across the NH and HI participants are shown in as a function of HA delay. The error bars indicate the standard error across participants. In the NH group, the mean correct scores for all IGs are strictly monotonic rising within the range of tested delays. The thresholds, here defined as the 75% point on the psychometric function, are between 0.25 ms and 0.35 ms. For the HI group the psychometric functions are displaced towards higher delays. The 75% correct point is at approximately 0.6 ms for the N2 IG and 1 ms for the N3 IG. Hence, the distance between the psychometric functions for the N2 and N3 condition is larger in the HI group compared to the NH group. That indicates that discrimination abilities are more affected by increased gain in the HI group.
Figure 4. Mean percent correct scores and standard error for the discrimination of the coloration-pitch. Filled data-points are the HI group, open data points the NH group. Guessing probability was 50%.
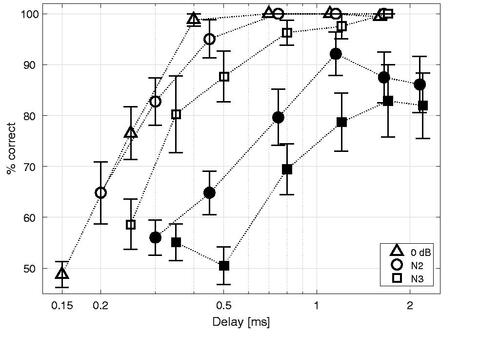
A mixed model analysis of variance (ANOVA) was computed to investigate which factors in the experiment had a significant effect on discrimination performance. In the ANOVA hearing status (NH or HI) was treated as a between-participants factor, and delay and IG settings were treated as within-participants factors. Note, that the ANOVA was computed only including data for IGs and delays that were tested in both groups, i.e. the 0 dB setting and the lowest delay in the NH group, as well as the highest delay in the HI group were omitted in the ANOVA. A confidence level of 0.01 was regarded as statistically significant.
There were significant effects for delay (F(4,76) = 26.5, p < 0.001) and hearing status (F(1,19) = 33.95, p < 0.001). Further, the interaction between the two factors was significant as well (F(4,76) = 3.99, p = 0.005). The IG setting was close to be significant (F(1,19) = 6.22, p = 0.02). All other 2-way and 3-way interactions were not significant.
Discussion
Simulation errors
The simulations exhibit larger errors for frequencies above 3 kHz. The force of the wiring of the HA shells made it challenging to position the HA shells at exactly the same spot behind the KEMAR ears as the reference HAs. At low frequencies small deviations in placement will not affect the resulting spectrum severely. At high frequencies, even a slight misplacement will unavoidably lead to considerable changes in the spectrum. However, errors in the high frequencies have little relevance for the comb-filter effect since the amplified HA sound is typically dominating over the direct sound.
Moore and Tan (Citation2003) examined the perceived naturalness of spectrally distorted speech and music caused by various types of linear filtering, amongst others spectral ripples, which is particularly of interest, because the prediction errors in the simulations typically have this shape. Moore and Tan found that ripples with a depth (peak-to-trough) of 5 dB have little influence on the perceived naturalness. Arehart, Kates, and Anderson (Citation2011) measured subjective quality ratings for speech subjected to a wide range of linear and non-linear processing. For instance, stimuli subjected to three 4 dB resonance peaks at 1 kHz, 2.5 kHz and 4 kHz showed no significant degradation in sound quality. The simulations exhibit errors that are rarely above 4 dB. Therefore, the simulation framework was assessed as suitable for stimuli generation in the experiment. It should be noted, that the simulations were using the specific ear acoustics derived on a KEMAR and that the acoustics may differ in individual ears. Further, only instant open fittings were used and different ear-tips would also alter the acoustics. However, many of todays fitted HAs are equipped with instant fittings or have large vents and can therefore be regarded as effectively open (Caporali et al. Citation2019).
Coloration-pitch
The data from Yost and Hill (Citation1978) show that two repetition pitches differing by 10% were best distinguished for delays between 2 and 5 ms. At these delays level differences of ≥20 dB between the delayed and undelayed noise were required for making discrimination impossible. They further found a steep decline in the discrimination abilities for lower delays. At a delay of 0.5 ms the difference in the repetition-pitch was still detectable but required that the added and delayed noise was not different by more than 2 dB in level relative to the undelayed noise. A similar steep decline in discrimination abilities can also be observed in the present experiment. The steepest part of the psychometric function was though found at slightly lower delays, i.e. below 0.5 ms. Yost and Hill (Citation1978) also measured discrimination thresholds for longer delays than used in the present work and found substantially higher thresholds for delays of 10 and 20 ms. The scope of this study was to investigate coloration-pitch for delays at the lower end of typical HAs. It is therefore possible that the psychometric functions are monotonic rising only within the tested delay range. However, the data from Yost and Hill (Citation1978) also show that the delays with high discrimination sensitivity are extending over a relatively broad range, with little difference in the discrimination thresholds between 2 and 5 ms. For delays exceeding 5 ms, Bramsløw (Citation2010) investigated the effect of delay on sound quality. The coloration in the sound produced by HA delays of 5, 7, and 10 ms was consistently noticeable and sound quality was generally rated as poor with no preference for either delay.
Denk, Ohlmann, and Kollmeier (Citation2021) measured the thresholds for the detectability of highly controlled comb-filter distortions in a simulated HA with a variety of gain characteristics, accounting for different vent sizes. For the setting that closest resembled an open-fit HA, the measured detection threshold (70% point on the psychometric function) for the “peak-compensation strategy” was as low as 0.15 ms for a simulated HA gain of 0 dB. In a second experiment Denk and colleagues measured the psychometric function over a range of delays. The task of the NH participants was to identify the stimulus with a simulated HA delay relative to an undelayed reference using a 3-AFC method. The average 70% threshold in their data was around 0.25 ms and performance was rising to 100% at approximately 0.5 ms.
In the present experiment similar thresholds were found for the 0 dB IG setting in the NH group, although a discrimination task was used. The results from the present discrimination experiment should not be interpreted as equivalent to coloration-pitch detection, but a careful comparison may still be relevant.
Denk, Ohlmann, and Kollmeier (Citation2021) observed a drop in the detectability for delays between 1 and 2 ms, which was also predicted by a simple auditory model. In the present experiment no such decline in performance could be observed in the NH group. This difference may be attributed to the different tasks, but it may also be due to different frequency regions where direct and HA sound interacted. In Denk and colleagues’ second experiment the region where the level of the two sound paths was within a difference of ±3 dB was 1 ERB number wide, with the highest interaction frequency fh of 0.85 kHz. This approximated a closed fitted HA with a 1–2 mm vent. In the present work fh was considerably higher (3, 1.8 and 1.5 kHz) and the ±3 dB interaction region was broader (5, 2 and 2 ERB numbers) for the IG settings of 0 dB, N2 and N3.
Buchholz (Citation2011) found that the abilities for the detection of coloration-pitches decreased with decreasing bandwidth. Similarly, Leek and Summers (Citation2001) showed that the sensitivity for discrimination of two coloration-pitches was higher in broadband stimuli relative to bandpass filtered stimuli. A wider frequency region where direct sound and HA sound interact may therefore generate a more robust coloration-pitch sensation.
The psychometric functions of the HI participants saturated around 90% for the N2 condition and at 80% at the N3 condition. This is because only eight test participants achieved scores ≥ 90% at the highest delays tested. shows the individual percent correct scores for each HI participant. The error bars here are the SD across the 18 presentations. Participants 9, 10 and 11 showed strongly varying performance and participant 12 was clearly not able to distinguish the coloration-pitches at any delay tested as all the datapoints are distributed around chance probability. The audiogram data in reveal that those participants who had close to normal pure-tone thresholds in the lower frequencies up to 1.5 kHz, were all exhibiting monotonically rising psychometric functions. On the other hand, the four participants who showed deviant psychometric functions had pure-tone thresholds exceeding an N3 hearing loss at frequencies ≤ 1.5 kHz on at least one ear. From can be seen that the largest comb-filter effect, i.e. the highest peak-to-trough ratio in the resulting spectrum is found near fh. For example, for the N2 setting a large interaction is seen between 1 and 2 kHz. Elevated pure-tone thresholds at these frequencies and thus the loss in sensitivity may have reduced the frequency range where the comb-filter effect could have been perceived. Further, Buchholz (Citation2011) showed that for coloration-pitch detection, high-frequency components were less contributing relative to low-frequency components. That is, the participants whose hearing thresholds were exceeding an N3 hearing loss at lower frequencies may not only have experienced issues with audibility where the comb-filter effect was most pronounced, but may only have had cues available that contribute little to the coloration perception.
Figure 5. Individual percent correct scores for the HI participants and SD across the presentations. Guessing probability was 50%.
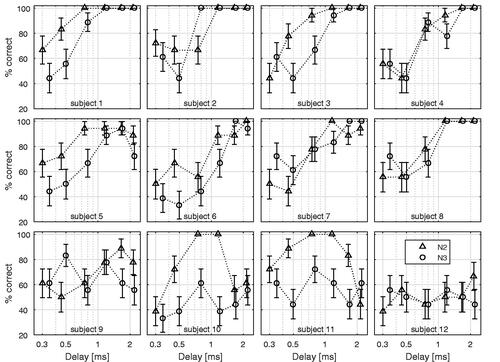
A mixed-model ANOVA was computed for the HI data in order to test if there was an effect of the average pure-tone thresholds (PTA) for frequencies up to 1.5 kHz on discrimination performance. For that analysis the PTA status was treated as between-participants factor. This factor defined if the PTA was exceeding an N3 hearing loss for at least one frequency up to 1.5 kHz. The effect of the PTA status was close to be significant (F(1,10) = 7.69, p = 0.019) and the two-way interaction between delay and the low frequency PTA was highly significant (F(5,50) = 6.96, p < 0.001). This means, depending on the delay there was a significant effect of the PTA for frequencies ≤ 1.5 kHz. This seems reasonable because of the floor effect for the lowest delays tested; here discrimination performance was around chance level for most HI participants. That is, the negative effect of elevated low-frequency PTA on discrimination abilities may only emerge at the higher delays tested.
In practice, participants with elevated low-frequency PTA would have been fitted with ear-molds that are more closed and provided with amplification below 1 kHz. It is unclear how such a fitting would influence the perception of the coloration-pitch. Amplification below 1 kHz would increase the frequency range for the interaction of direct sound and HA sound, but a more closed fitting would also attenuate the direct path and thus reduce the comb-filter effect. As the scope of this study was open fittings only, this question remains for future investigations. Further research is also needed to re-evaluate the common practice of not providing amplification below 1 kHz in open-fit HAs. Better sound quality can be achieved by not providing gain in the low frequencies for devices with traditional delays of 5 to 10 ms (Bramsløw Citation2010). However, this compromise comes at the cost of rendering HA features, such as directional microphones and noise reduction, less effective (Keidser et al. Citation2007). No study has been conducted to investigate if turning off the low frequency HA gain is beneficial for devices with very low delays. That is, HAs with very low delays and amplification in the lower bands may potentially provide good sound quality and benefit from more effective features.
Conclusions
Simulations were presented that were able to predict the aided gain on a KEMAR for open-fit HAs and accounting for HA delay, incident direction and IG. The simulations accurately predicted the notches and ripples in the spectrum due to the comb-filter effect. Therefore, the simulations were assessed as a suitable means to generate stimuli for a listening experiment which were preserving the specific acoustics of the open-fitted HA.
Psychometric functions for the discrimination of coloration-pitches for both NH and HI participants were measured as a function of delay and IG. The aim was to identify at what HA delays a large change in coloration-pitch, induced by a 12% change in delay, could no longer be perceived. NH participants could reliably discriminate coloration-pitches for delays ≥ 0.3 ms. For HI participants the perception of changes in the coloration-pitch depended on the individual hearing loss. Participants that had typical a high-frequency hearing impairment with near normal hearing in the lower frequencies were able to discriminate coloration-pitches for HA delays ≥ 0.6–1 ms depending on the IG. For shorter delays HI participants were insensitive to a large change in coloration-pitch resulting from the 12% change in delay. This suggests that HA delays just above half a millisecond may constitute a lower limit at which a further delay reduction of this size is not enough to be perceived.
Elevated pure-tone thresholds below 1.5 kHz were found to negatively affect the discrimination abilities. Additionally, amplification was reducing the discrimination sensitivity and HI participants seemed to be affected more than NH participants. This in turn indicates that HA users with a mild hearing impairment and near normal hearing in the lower frequencies may have the highest advantage of short HA delays.
Acknowledgements
The author thank colleagues at WS Audiology and three anonymous reviewers for very their thoughtful comments and discussions on earlier versions of this manuscript.
Disclosure statement
No potential conflict of interest was reported by the author.
References
- Atal, B. S., M. R. Schroeder, and K. H. Kuttruff. 1962. “Perception of Coloration in Filtered Gaussian Noise Short-Time Spectral Analysis by the Ear.” Paper presented at the 4th International Conference on Acoustics, Speech and Signal Processing, Copenhagen, paper H31.
- Arehart, K. H., J. M. Kates, and M. C. Anderson. 2011. “Effects of Noise, Nonlinear Processing, and Linear Filtering on Perceived Music Quality.” International Journal of Audiology 50 (3): 177–190. doi:10.3109/14992027.2010.539273.
- Balling, L. W., O. Townend, G. Stiefenhofer, and W. Switalski. 2020. “Reducing Hearing Aid Delay for Optimal Sound Quality: A New Paradigm in Processing.” Hearing Review 27: 20–26.
- Bilsen, F. A. 1968. “On the Interaction of a Sound with its Repetitions.” Ph.D. thesis, Uitgeverij Waltman, Delft.
- Bisgaard, N., M. S. Vlaming, and M. Dahlquist. 2010. “Standard Audiograms for the IEC 60118-15 Measurement Procedure.” Trends in Amplification 14 (2): 113–120. doi:10.1177/1084713810379609.
- Bramsløw, L. 2010. “Preferred Signal Path Delay and High-Pass Cut-off in Open Fittings.” International Journal of Audiology 49 (9): 634–644. doi:10.3109/14992021003753482.
- Buchholz, J. M. 2011. “A Quantitative Evaluation of Spectral Mechanisms Involved in Auditory Detection of Coloration by a Single Wall Reflection.” Hearing Research 277 (1-2): 192–203. doi:10.1016/j.heares.2011.01.002.
- Caporali, S. A., J. Cubick, J. Catic, A. Damsgaard, and A. Schmidt. 2019. “The Vent Effect in Instant Ear Tips and its Impact on the Fitting of Modern Hearing Aids.” Presented at the Proceedings of the International Symposium on Auditory and Audiological Research, 7, 205–212
- Denk, F., K. Ohlmann, and B. Kollmeier. 2021. “Detection Mechanisms for Processing Delays in Simulated Vented Hearing Devices.” JASA Express Letters 1 (1): 014402. doi:10.1121/10.0003064.
- Groth, J., and M. Birkmose. 2004. “Disturbance Caused by Varying Propagation Delay in Non-Occluding Hearing Aid Fittings.” International Journal of Audiology 43 (10): 594–599. doi:10.1080/14992020400050076.
- Keidser, G., L. Carter, J. Chalupper, and H. Dillon. 2007. “Effect of Low-Frequency Gain and Venting Effects on the Benefit Derived from Directionality and Noise Reduction in Hearing Aids.” International Journal of Audiology 46 (10): 554–568. doi:10.1080/14992020701481698.
- Leek, M. R., and V. Summers. 2001. “Pitch Strength and Pitch Dominance of Iterated Rippled Noises in Hearing-Impaired Listeners.” The Journal of the Acoustical Society of America 109 (6): 2944–2954. doi:10.1121/1.1371761.
- Moore, B. C. J., and B. R. Glasberg. 1983. “Suggested Formulae for Calculating Auditory-Filter Bandwidths and Excitation Patterns.” The Journal of the Acoustical Society of America 74 (3): 750–753. doi:10.1121/1.389861.
- Moore, B. C. J., and C. T. Tan. 2003. “Perceived Naturalness of Spectrally Distorted Speech and Music.” The Journal of the Acoustical Society of America 114 (1): 408–419. doi:10.1121/1.1577552.
- Müller, S., and P. Massarani. 2001. “Transfer-Function Measurement with Sweeps.” The Journal of the Audio Engineering Society 49 (6): 443–471.
- Stone, M. A., B. C. J. Moore, K. Meisenbacher, and R. P. Derleth. 2008. “Tolerable hearing aid delays. V. Estimation of limits for open canal fittings.” Ear and Hearing 29 (4): 601–617. doi:10.1097/AUD.0b013e3181734ef2.
- Yost, W. A., and R. Hill. 1978. “Strength of the Pitches Associated with Ripple Noise.” The Journal of the Acoustical Society of America 64 (2): 485–492. doi:10.1121/1.382021.