
Abstract
Objective
We sought to validate our proposed tool for estimating channel discrimination of cochlear implant (CI) users along the full electrode array and to assess associations between place-pitch discrimination and speech perception.
Design
In two tests, participants identified one stimulus (probe) as the odd-one-out compared with two reference stimuli. Probe stimuli were evoked using dual electrode stimulation characterised by the current steering coefficient α. The first test measured psychometric functions (PFs) on pre-defined contacts, with just a noticeable difference (JNDα) as the outcome variable. The second test estimated channel discrimination on the full electrode array, yielding a discrimination score of Dα. We measured speech perception as free-field consonant-vowel-consonant phoneme recognition scores.
Study sample
We included 25 adults with at least 6 months of CI experience.
Results
JNDα and Dα scores measured on the same contact correlated significantly (rs = 0.64, p < 0.001). Mean JNDα and speech perception scores showed significant relationships in quiet and in noise.
Conclusions
Dα correlated strongly with JNDα scores obtained with the PFs. For poor performers, the full-array test may underestimate JNDα. The full-array pitch discrimination test could be a helpful clinical tool, such as for fitting regions of lesser pitch discrimination ability.
Introduction
Contemporary cochlear implants (CIs) have 12–22 electrode contacts on the electrode array, depending on the manufacturer. Each contact excites a specific part of the spiral ganglion cells, causing a typical pitch percept. Because of the limited number of excitation sites, the number of different pitches created by a CI is far below that of normal hearing. The spectral resolution is further reduced by the current spread in the cochlea, resulting in overlapping excitation areas (Shannon, Fu, and Galvin Citation2004; Snel-Bongers et al. Citation2012). For CI users, the limited spectral resolution often leads to difficulties in understanding speech in noise or in listening to music (Shannon, Fu, and Galvin Citation2004; Frijns et al. Citation2003). To accommodate for the limited spectral resolution, speech processing algorithms that create additional pitch percepts have been proposed, such as simultaneous dual electrode stimulation (DES) (Townshend et al. Citation1987) or rapid sequential stimulation of adjacent electrodes (McDermott and McKay Citation1994). In both cases, unique pitch percepts, or virtual channels, can be created by simultaneous activation of two adjacent electrode contacts with the different relative weighting of current. The hypothesis is that a higher spectral resolution could improve speech understanding and lead to higher speech recognition scores. Our recent study of channel discrimination confirmed this hypothesis, showing a correlation between full-array channel discrimination ability and speech performance (Biesheuvel et al. Citation2019). However, we found that the test needs some improvements and validation against a gold standard.
Our initial version of this test allowed examination of channel discrimination along the whole electrode array within 30 min. This kind of test is of clinical interest for several reasons. First, multiple studies have reported a correlation between pitch discrimination ability and speech recognition (Hanekom and Shannon Citation1996; Snel-Bongers et al. Citation2012; Kenway et al. Citation2015; Biesheuvel et al. Citation2019). Second, knowledge about a CI user’s individual spatial selectivity along the array could help the audiologist program the CI. For example, knowledge about cochlear regions of lesser pitch discrimination ability (so-called “dead regions”) can aid decision-making regarding the deactivation of poorly discriminable electrodes (Bierer and Faulkner Citation2010), which can lead to improved speech perception for some users (Zwolan, Collins, and Wakefield Citation1997; Bierer and Litvak Citation2016).
The channel discrimination ability of CI users can be quantified with psychophysical experiments. Participants are generally asked to distinguish a probe stimulus from one or more reference stimuli using so-called two- or three-alternative forced-choice (AFC) procedures. In 2AFC experiments, participants are typically instructed to choose the stimulus with the higher pitch from two presented stimuli, whereas, in 3AFC experiments, the probe is identified as “different” from the two (identical) reference stimuli. CI users might find a 3AFC task easier than a 2AFC pitch ranking because they sometimes have lost their normal auditory perception years earlier and might have trouble recalling what higher versus lower pitch means.
The most robust method of estimating pitch discrimination ability is measuring the percent-correct score for several inter channel distances (ICDs) and subsequently fitting the data with a psychometric function (PF). An alternative to estimating the whole PF is to obtain a point estimate on the PF using a staircase, or adaptive, procedure. Depending on the exact configuration, the outcome of the staircase procedure converges on a certain point on the PF (Levitt Citation1971). The value at which a participant is just able to distinguish the probe from a reference is defined as the threshold value and designated as the just noticeable difference (JND). The JND is commonly expressed as JNDα, where α indicates the relative weighting between the two physical electrodes in DES.
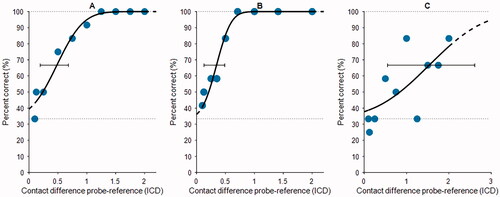
Figure 1. Example PFs from three participants (panels A–C). Each panel shows the percentage correct score for a tested ICD (blue dots), the PF fitted to the data points (black line), predicted asymptotes (dotted lines), the threshold at 67% correct, and the 95% credibility interval of the threshold (bar-and-whiskers). Panels (A and B) show good performers, and panel (C) shows a relatively poor performer (also note the wider range on the abscissa). Abbreviations: PF, psychometric function; ICD, interchannel distance.
Several studies have examined the JND of individual participants using psychophysical experiments. Donaldson et al. (Citation2005) used a 2AFC paradigm and defined the JND as the α-value corresponding to 79.4% of correctly answered trials. With this approach, they found a two- to nine-fold increase in discriminable pitches between two physical electrode contacts. Firszt et al. (Citation2007) and Koch et al. (Citation2007) later reported similar results, with 5.0 and 7.1 distinguishable pitches, respectively, between two physical contacts. These values amount to group-averaged JNDα scores between 0.13 and 0.26 contact distances. Snel-Bongers et al. (Citation2011; Citation2012) used a 3AFC staircase procedure with a JND that converged to 70.4% correct. They reported that their participants could distinguish one additional pitch or spectral channel per tested electrode pair (JNDα 0.83). Goehring et al. (Citation2014), using both 2AFC and 3AFC, also reported that CI users could distinguish approximately one extra pitch using current steering between two physical contacts in both paradigms. In a group comparison, they reported significantly better pitch discrimination ability in 2AFC (group-averaged JNDα 0.53–0.57) compared with 3AFC (group-averaged JNDα 0.68–0.75). Goehring et al. suggested that the additional interval in 3AFC tests could complicate the test because of its demands on auditory memory.
All of these studies showed wide variability in JND among participants. Some participants could not distinguish adjacent physical electrodes, whereas one could distinguish as many as 31 pitch percepts between two physical electrodes (Firszt et al. Citation2007). A disadvantage of the staircase method (and the PFs) was that the experiments were time-consuming so that only a limited number of participants or of pre-selected electrodes on the array (e.g. in three cochlear regions) could be measured within the attention span of CI users in a measurement session. The latter is especially cumbersome, as some studies reported varying outcomes along the electrode array, indicating that a full-array test might be beneficial (Bierer and Faulkner Citation2010; Donaldson, Dawson, and Borden Citation2011; Firszt et al. Citation2007; Koch et al. Citation2007).
In the novel test that we developed previously, we tackled several problems reported for the pitch discrimination tests. We applied a channel discrimination test that allowed us to assess all electrode contacts on the array, including virtual channels, within a relatively short time (Biesheuvel et al. Citation2019). This approach was facilitated by testing three discrete (virtual) channels for all electrode contacts on the array and evaluating their discriminability against a pre-defined percent correct score, rather than adaptively searching the JNDα. The test does not yield an exact JNDα, but it provides the experimenter insight into the degree of discriminable pitches on the tested electrodes. To avoid confusion with iteratively or adaptively determined JNDα, the outcome measure of this test is designated “Dα.”
In the current study, we validated an improved version of the full-array test and further examined its clinical applicability. We previously found that most participants could not distinguish adjacent physical electrodes, which initially was not expected based on earlier studies reporting JND values smaller than 1 (Donaldson, Kreft, and Litvak Citation2005; Firszt et al. Citation2007; Koch et al. Citation2007; Goehring et al. Citation2014; Donaldson, Dawson, and Borden Citation2011; Snel-Bongers et al. Citation2011; Citation2012). To avoid too many >1 scores, we doubled the tested stimulus range, evaluating pitch discrimination ability up to two ICDs. We also aimed to validate the test by comparing its outcomes with those of PFs. The PFs were measured at three pre-defined locations based on their location in the cochlea, as determined on a post-operative computed tomography (CT) scan, rather than using their rank number. This strategy allows for a more standardised comparison between participants and electrode regions (Snel-Bongers et al. Citation2011). Furthermore, we performed a “sanity check,” examining the effect of remaining loudness cues on pitch discrimination performance. Lastly, we investigated the correlation between speech recognition and JNDα.
Materials and methods
Participants
The participants in this study were randomly recruited from our CI population and met the following criteria: at least 6 months of experience with their CI, age >18 years, and a CI from Advanced Bionics (AB, Sylmar, CA, USA). We included 27 recipients who were postlingually deafened and unilaterally implanted between 2004 and 2020. The participant demographics are shown in Supplementary Table 1. All participants used the HiRes Optima-S speech processing in their daily-life program. The AB electrode array has 16 contacts, numbered from 1 (apex) to 16 (base). Only contacts active in the daily-life program were tested in the experiments (Supplementary Table 1). Participants 1 through 8 were tested in two sessions on separate days, whereas the others were tested in one session to minimise travelling and hospital visits during the COVID pandemic. Each participant gave written informed consent. This study was approved by the Medical Ethical Committee of the Leiden University Medical Centre (ref. no. P19.111).
Channel discrimination tests
Each participant’s channel discrimination ability was tested using two different psychophysical experiments. In the first experiment, we estimated PFs using a method of constant stimuli (Levitt Citation1971) on three pre-defined electrode locations (apical, medial, basal) for all participants. The second experiment estimated pitch discrimination ability for all contacts across the electrode array, following our previously published paradigm (Biesheuvel et al. Citation2019). In that study, pitch discrimination ability was evaluated on pre-defined, discrete ICDs. When the participant could discriminate the tested ICD, a more difficult ICD was evaluated. The smallest ICD whereby the participant was able to discriminate the probe stimulus from the reference stimuli was taken as the discrimination score.
All participants completed the PFs on the three desired electrode contacts. Three participants (S017, S019, and S025) did not finish the full-array test because of time constraints or fatigue. Participant S015 completed the full-array test on only the three contacts tested with PFs because of time constraints. Two participants (S022 and S023) were ultimately excluded from the study because they did not understand the test procedure.
Test design
The experiments were custom-made in MATLAB (Mathworks Inc., Natick, MA, USA) and the AB research tool Bionic Ear Data Collection System (BEDCS) version 1.18.321. Both experiments used a 3AFC paradigm in which the reference electrode is stimulated twice and the probe once, in random order. Participants were instructed to pick the different stimulus (in terms of pitch) while ignoring loudness differences. All stimuli were 300-ms pulse-trains of monopolar, symmetric, biphasic pulses with a phase duration of 32 µs. The stimulus duration is consistent with the literature on place-pitch discrimination, describing stimulus durations of 200–300ms (Snel-Bongers et al. Citation2012; Biesheuvel et al. Citation2019; Goehring et al. Citation2014; Firszt et al. Citation2007). The pause between stimuli within the 3AFC paradigm was 500 ms. The pulse rate was 1400 pulses s−1, which was sufficiently high to disregard rate-pitch and place-pitch confusion (McKay, McDermott, and Carlyon Citation2000; Shannon Citation1983). The experiments used current steering, in which the locus of stimulation was steered between two physical contacts by varying the proportion of current sent to the contacts (Townshend et al. Citation1987; Donaldson, Kreft, and Litvak Citation2005; Koch et al. Citation2007; Firszt et al. Citation2007). The proportion of current sent to the more basal contact was depicted by α, and the current sent to the more apical contact by (1-α). In this way, virtual channels were created. The reference contact was always a physical contact, apically located from the probe.
Before the experiment started, electrode impedances were measured for assessing the electrodes’ compliance limits. If the compliance limit was exceeded, the pulse width was increased to further increase the charge. In these cases, the stimulus level of the other contacts was recalculated with respect to the new pulse width. Subsequently, the electrodes were loudness balanced. The participant was asked to indicate per contact when the hearing threshold and most comfortable loudness were reached. Next, adjacent electrodes were carefully loudness balanced based on feedback provided by the participant. For the PFs, the three involved contacts were pairwise loudness balanced. For the full-array test, all 16 contacts were loudness balanced, starting at electrode 8 (moving to electrode 16, and subsequently from 8 to 1).
In all experiments, a loudness roving of 10% was used to avoid loudness cues, as we have done earlier in our centre (Snel-Bongers et al. Citation2011; Citation2012; Biesheuvel et al. Citation2019). The loudness roving factor (LRF) was drawn for every stimulus separately from a uniform distribution between 0.9 and 1.1. After loudness balancing, participants were trained with six examples with an ICD of two electrode contacts. We also performed a “sanity check” to see if and how participants were influenced by the loudness cue. For this purpose, we quantified the relative loudness of all three stimuli presented in a trial. The largest LRF was set to 1, the middle LRF to 2, and the smallest LRF to 3. By examining the distribution of the participants’ chosen answers in relation to the relative loudness, we can understand how the participant was influenced by the loudness cue.
Psychometric functions
The PFs were measured at pre-defined locations on the intra-cochlear electrode array. These locations were estimated from the post-operative CT scan that was routinely performed after cochlear implantation. From the CT images, a multiplanar reconstruction was made, perpendicular to the modiolus and parallel to the cochlea’s basal turn, showing the plane of the implant in the cochlea (i.e. the cochlear view) (Verbist et al. Citation2005). To determine the precise location of the electrodes, custom MATLAB software was used to set a 3-dimensional, cylindrical coordinate system (Verbist, Skinner, et al. Citation2010; Verbist, Joemai, et al. Citation2010). For each participant, electrode contacts closest to 120° (basal), 240° (middle), and 360° (apical) positions were used in the experiment (Supplementary Table 1). This method has been used before in our centre (Snel-Bongers et al. Citation2011; Citation2012).
For estimating a PF, a set of 9 pre-defined ICDs between 2 and 0.125 was tested per run. A run started at the largest ICD (2) and ended at the smallest, gradually making the probe harder to distinguish from the two reference stimuli. This procedure was repeated 12 times on the electrode contact of interest. If a participant showed excellent pitch discrimination ability (i.e. no mistakes in the first run), the test was restarted using smaller ICDs to better estimate the threshold at the smaller ICD values. In that case, we re-arranged the ICDs of interest with a shift towards the lower values (see examples of fitted data in ). Note the difference in spacing between panels A and B in . In panel B, probe values lower than ICD = 0.5 were added and probe values for ICD > 1 were omitted because this participant demonstrated excellent pitch discrimination and it was important to focus on “harder” distinguishable probe stimuli for this electrode contact. If from the first run no clear performance trend was seen (i.e. consequently correct for large ICDs, consequently incorrect for small ICDs) an additional ICD = 0.1 was tested (see Figure 1A and C).
The data from the PFs were fitted with the toolbox psignifit 4 (Schütt et al. Citation2016), using a cumulative Gaussian function and taking into account guess rate and lapse rate. The lapse rate described the potential inability of a participant to ever reach 100% correct. The threshold was defined as the y-value that was halfway to the lower (guess rate) and upper asymptote (lapse rate). The JNDα was defined as being equal to the threshold of the PF, 95% credibility intervals (Schütt et al. Citation2016) were estimated using the toolbox, and all fits were manually checked. For 3 of 75 fitted PFs, lapse rates >15% were observed. In those cases, we assumed that the tested stimulus range was not wide enough and that a 100% score could be achieved with larger ICDs. These three PFs were refitted with a lapse rate of 0 (forced to 100% correct for ICDs larger than our stimulus range), and the fit was deemed better and adequate.
Full-array examination
The full-array test was an adapted version of the previously published test (Biesheuvel et al. Citation2019). The test from Biesheuvel et al. evaluated the channel discrimination of a CI-user at all electrode contacts along the electrode array. The test used a 3AFC paradigm with stimulus levels at MCL and evaluated ICDs of 1, 0.5 and 0.25. First, all consecutive electrode contacts were examined with ICD = 1 from apical to basal direction. This was repeated five times. Next, the same procedure was repeated for ICD = 0.5 for the contacts where the subject distinguished the probe stimulus correctly in 4-out-of-5 trials. The contacts where the subject discriminated ICD = 0.5 were finally evaluated with ICD = 0.25. The smallest ICD to be correctly identified in 4/5 trials was considered as the discrimination score Dα.
In the current study, several changes were made. First, we introduced a more relaxed cut-off criterion. In the previous test, we observed that participants sometimes would accidentally pick a wrong answer when they knew the correct choice. Under a strict 4/5 cut-off criterion with a relatively low number of repetitions, this could lead to an inappropriate discrimination score. In the current study, we, therefore, decided to relax the continuation criterion to 3/5 and potentially test more difficult ICDs. We still considered the true discrimination score Dα as the smallest ICD at which a participant proved 4/5 correct. In this way, we maintained a strict criterion to estimate if a probe was truly distinguished from the references. If an ICD of 2 was not distinguished (<3/5), the electrode pair would not be investigated further.
The second adjustment covers the maximally tested ICD, which was increased from one to two electrode distances. Participants started at ICD = 2, and the stimuli were presented in five repetitions (trials) on the same electrode. Depending on whether the participant met the cut-off criterion, the ICD would gain in difficulty by halving the tested ICD, down to ICD 0.25.
Speech perception
Phoneme recognition scores with CI only were collected during the participants’ periodical clinical visits to our centre. The standard Dutch speech test of the Dutch Society of Audiology was used (Bosman and Smoorenburg Citation1995). The phoneme scores were obtained in the free field situation with the CI recipient sitting 1 m in front of the loudspeaker. In this study, we used the most recent speech perception scores available on the day of testing the channel discrimination. Exceptions were participants S004, S019 and S025, whose most recent speech recognition scores were deemed unreliable. For these participants, scores from the previous periodical clinical visit were used. The median phoneme score of all participants at 65 dB SPL speech-in-quiet was 85%, which is representative of our centers’ total CI population of postlingually deafened adults (median 83%). We included speech scores measured in quiet at 65 and 75 dB SPL, and in speech-shaped noise with a speech at 65 dB SPL and noise at +10 and +5dB signal-to-noise ratio (SNR).
Data analysis
Postprocessing and data analysis was done in MATLAB. We used pairwise paired t-tests to evaluate whether the JNDα differed between cochlear regions. To examine the predictive value of the Dα scores by comparison of the JNDα by grouped Dα, we used the Mann-Whitney U test. Additionally, the Spearman’s rank correlation test was used to assess the strength of the relationship between JNDα and Dα scores measured on the same contact in the same patient. To investigate the correlation between JNDα and speech perception score, we applied linear regression. P < 0.05 was considered significant.
Results
Channel discrimination
shows the individual outcomes of both psychophysical experiments for all 25 included participants. The outcome score (y-axis) is a discrete variable for the full-array test (black dots connected with a line), whereas it is a continuous variable for the PFs (light grey circles and whiskers). Note that in some cases, ICD = 2 could not be distinguished, which is represented by a > 2 score plotted just above ICD = 2. In the full-array experiments, we found large differences in outcomes both within-participants and between-participants. To illustrate, a large within-participant variability was found in participant 24, with Dα scores ranging from 0.25 to >2 across the array. Large within-participant differences in Dα scores also could be concentrated in a specific cochlear region, as in participants 5 and 13 (worse performance on basally located electrodes) and participant 7 (worse performance in mid-array). Between-participant variability was observed in participant 1 (relatively poor Dα scores with a minimum of 1) versus participant 3 (near-perfect channel discrimination over the full array, with a maximum of 0.5).
Figure 2. Overview showing per-participant discrimination scores (ordinate) for all tested electrode contacts (abcissa). The Dα scores from the full-array test are shown with black dots and lines, and the JNDα scores from the PFs are indicated by open circles, including the 95% credibility interval (whiskers). In the upper left corner of each box, the participant identification number and phoneme score with CI at 65 dB SPL in quiet are plotted. Abbreviations: PF, psychometric function; CI, cochlear implant.
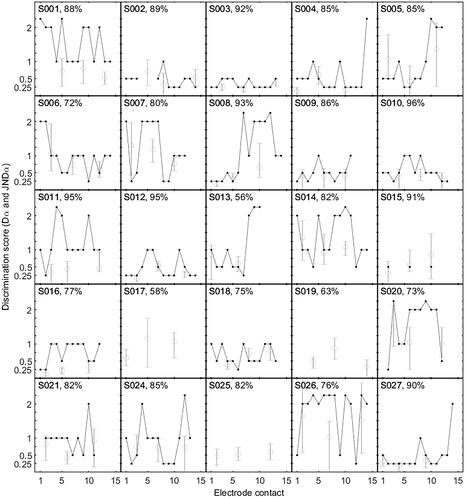
Regarding the PFs, the average JNDα of all participants was 0.645 (range from 0.12 to 1.65). For the apical, middle, and basal contacts, the mean JNDα values were 0.65, 0.62, and 0.67, respectively. JNDα did not differ per cochlear region, as determined by pairwise paired t-tests over the entire group: basal vs. apical (p = 0.696), basal vs. middle (p = 0.459), and middle vs. apical (p = 0.600). In most participants, the JNDα scores were uniform across the electrode array. However, for some participants, we observed clear areas of lesser pitch discrimination (e.g. S005, S008, S019). The JNDα scores also varied between participants (e.g. S003 and S026).
Test validation
shows the relationship between JNDα and Dα scores, grouped by Dα score. The boxplots in panels 3 A–D show the distribution of JNDα values for a given Dα. Pairwise Mann-Whitney U tests show that all Dα groups differed significantly from each other: group 0.25 vs. 0.5 (p = 0.028); group 0.25 vs. 1 (p < 0.01); group 0.25 vs. >1 (p < 0.001); group 0.5 vs. 1 (p = 0.039); group 0.5 vs. >1 (p < 0.001); and group 1 vs. >1 (p < 0.001). Spearman’s rank correlation indicated a significant positive correlation between JNDα and Dα scores measured on the same contact (rs = 0.64, p < 0.001).
Figure 3. Individual JNDα scores (black dots) are grouped by four categories of corresponding Dα scores measured on the same electrode. Panels (A–D) show the summarised distribution in boxplots. The individual data points (black dots) are plotted with a horizontal offset for clarity. The box-and-whiskers denote interquartile ranges. The middle line shows the median, and crosses denote outliers. Panels (E–H) show JNDα scores with estimated uncertainty intervals (whiskers). The dotted line shows the Dα score for the group. Abbreviations: JND, just noticeable difference.
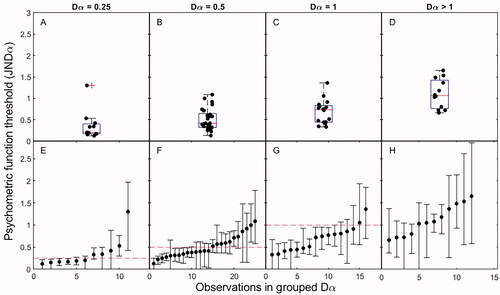
Panels 3E–H show all individual JNDα scores per Dα group, ranked by value and including the uncertainty interval. For Dα groups 0.25 and 0.5 (Figure 3E and F), the full-array test approximated the JNDα value, although some spread around the JNDα was observed. For Dα groups 1 and >1 (Figure 3G and H), the full-array test generally produced a worse outcome than would be expected based on the PF. Furthermore, in group >1, we identified PFs with larger JNDα values and larger uncertainty intervals, which indicated more spread in the test result (). Looking at the whole group, the results indicate the predictive value of the full-array test; a small Dα score corresponded with a small JNDα score, and a large Dα generally corresponded with a large JNDα. However, from , it is apparent that for groups Dα = 1 and Dα > 1, the full-array test underestimated the true underlying JNDα.
Loudness roving factor (LRF)
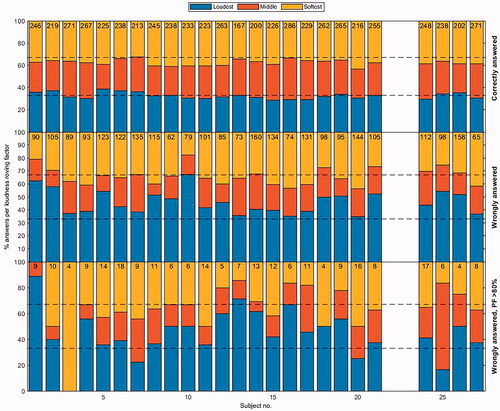
For our “sanity check” of how participants chose answers relative to the LRF, shows the distributions of the participants’ choices from all trials of the three PFs together. The top panel represents the participants’ choices when the probe was correctly distinguished from the reference; the middle panel shows the wrongly answered trials; and the bottom panel depicts the wrongly answered trials while the fit of the PF indicated >80% correct. The answers presented in the top panel show an approximately uniform distribution, which was expected, given that the LRF was randomly applied. From the middle panel, we inferred that if participants picked the wrong stimulus, the choice could have been driven by a loudness cue. Clear examples are participants 1, 2, and 10, who favoured the louder stimulus (indicated in blue). The bottom panel in shows the distribution of wrongly given answers for ICDs, for which the fit of the PF indicated >80% correct answers, i.e. where the patient should have been able to decide based on the differing pitch. These results revealed that some participants (e.g. participants 1, 11, 13, 14, 16, and 20) were potentially influenced by the loudness cue, whereas others were not. Notably, these participants were relatively poor performers on the full-array text (except for participant 16).
Figure 4. Participants’ choices were portioned out per quantised loudness roving factor (LRF). All trials of the three PFs are added together per participant. Participants are indicated on the abscissa and their relative choices on the ordinate. The top panel shows their choices for all correct answers. The middle panel shows choices for all wrong answers. The bottom panel shows choices for all wrong answers while the fit of the PF indicated >80% correct for that α value. For every participant, the bottom bin (blue) indicates the largest LRF (loudest stimulus) for the 3AFC trial, the middle (red) indicates the middle LRF (middle stimulus), and the top (yellow) indicates the lowest LRF (softest stimulus). The numbers at the top of the graph indicate the number of trials in this category.
Relation with speech perception
We also investigated how the average JNDα across the electrode array of a participant correlated with speech perception scores. For this comparison, we used the average JNDα of the three cochlear locations. Participant S013 was excluded from this analysis because he could not distinguish any pitch on the basal electrodes (possibly even from electrode 8). Participant S016 also was excluded from this analysis, in this case, because Dutch was not his native language, affecting his speech perception scores. shows four scatterplots relating a participant’s mean JNDα score with the speech recognition score obtained in four listening conditions. Note that in our centre, the +5dB SNR condition is tested only when the phoneme score for the +10dB SNR is more than 50%. Therefore, the scatterplot for the +5dB SNR condition contains 19 participants instead of 23, as in the other conditions. The mean JNDα scores of the participants who were missed in the +5dB SNR scatterplot (i.e. S006, S017, S020, and S026) ranged from 0.792 to 1.405 and were notably worse than the average of the other participants.
Figure 5. Correlation between participants’ mean PF threshold (abscissa) and phoneme score (ordinate) for all four listening conditions. Each dot represents a participant, and the line shows the linear fit. Abbreviations: CVC, consonant vowel consonant; JND, just noticeable difference.
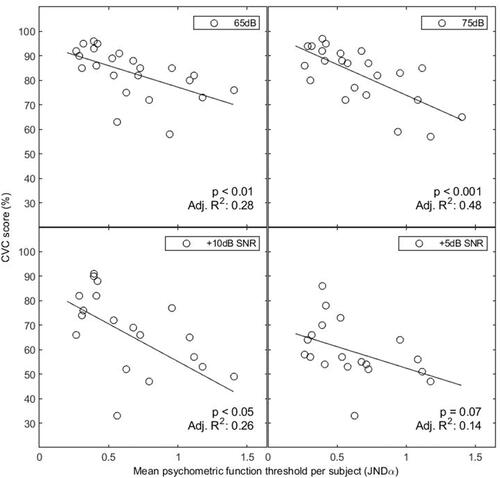
Linear regressions showed significant relationships between mean participant JNDα and speech perception. For speech in quiet, we observed a weak to moderate significant correlation at 65 dB (p < 0.01; adjusted R2 = 0.28) and a moderate to strong significant correlation at 75 dB (p < 0.001; adjusted R2 = 0.48). For speech in noise, there was a weak significant correlation for the +10dB SNR condition (p < 0.05; adjusted R2 = 0.26). The correlation between JNDα and phoneme score was not significant for the +5dB SNR condition (p = 0.07; adjusted R2 = 0.14).
Discussion
Pitch discrimination outcomes
We found in the current work and in our previous study (Biesheuvel et al. Citation2019) that not every participant could distinguish adjacent electrode contacts, which is consistent with other studies (Koch et al. Citation2007; Firszt et al. Citation2007; Donaldson, Kreft, and Litvak Citation2005; Donaldson, Dawson, and Borden Citation2011; Biesheuvel et al. Citation2019). The inability to distinguish adjacent contacts was also found in studies with MED-EL and Cochlear manufactured implants (adjacent spacing of 2.1–2.5 mm with MED-EL and 0.75 mm with Cochlear, compared to ∼1 mm in AB implants). This pattern suggests that for some participants, there are wider cochlear regions that are not discriminable in electrical stimulation (Baumann and Nobbe Citation2004; Grasmeder et al. Citation2019; Kwon and van den Honert Citation2006). Indeed, most studies determining JNDα values report variability in scores both within participants (between regions) and between participants (reflected by the ranges of JNDα values). This variability in test scores within or between participants was seemingly not explained by factors such as CI experience or duration of hearing impairment as found in the literature (Firszt et al. Citation2007; Goehring et al. Citation2014). The variability might be attributed to other parameters involving auditory deprivation, type of hearing loss before implantation or progression of hearing loss. It would be interesting to investigate this with a dedicated study in the future.
In this study, we found no significant difference in JNDα per electrode region, in line with Snel-Bongers et al. (Citation2011). In contrast, Biesheuvel et al. (Citation2019), Donaldson et al. (Citation2011), Firszt et al. (Citation2007), Koch et al. (Citation2007), and Kwon and van den Honert (Citation2006) did find different pitch discrimination abilities in different cochlear sites. Moreover, several studies have shown better performance in the apically located electrodes compared to basally located electrodes (Koch et al. Citation2007; Firszt et al. Citation2007; Kwon and van den Honert Citation2006; Biesheuvel et al. Citation2019). It has been suggested that poorer performance on basal electrodes results from poor nerve survival, which can be related to the duration of (high frequency) hearing loss.
Validation
In this study, we improved and validated our full-array pitch discrimination test by extending the ICDs of interest. In our previous test, we found that at 242 of 401 tested contacts (60.3%), the participant could not distinguish adjacent contacts, consequently being scored as Dα > 1. However, these >1 scores may not be accurate enough for use in clinical practice. We extended the ICDs of interest to range from 0.25 to 2 instead of 1. By starting with an easier-to-distinguish probe stimulus, the participant can get used to following the right (pitch) cue in determining the odd-one-out. If ICD = 2 was not distinguishable, a score of >2 was assigned, which occurred in only 19 of 268 contacts (7.1%). We also chose to change the termination criterion. In our previous study, the test stopped when the participant did not distinguish 4/5 trials. Participants can make accidental mistakes, for example, because of a lack of concentration or confusion over which cue to follow (see below). We chose not to break off the test but to continue testing with a harder-to-distinguish ICD. In this way, we gave the participant another chance with a more difficult probe stimulus, expecting them to fail in the subsequent harder condition if they were truly unable to discriminate in the previous trial. The Dα score was still evaluated at 4/5 trials correct because we still considered that to be the criterion for when the stimulus was truly heard.
The significant correlation between JNDα and Dα showed that the full-array test predicts pitch discrimination ability across the full electrode array. depicts the strongest correlation between JNDα and Dα for Dα groups 0.25 and 0.5. For larger values of Dα, the predictive value was lower (Figure 3G and H), and the full-array experiment (Dα) underestimated the participants’ pitch discrimination ability (JNDα). Two factors can explain this mismatch for higher Dα groups. First, the JNDα was generally based on the 67% correct point on the PF, whereas the Dα cut-off criterion was based on the 80% (4/5) point. Therefore, Dα scores were systematically higher than JNDα. We observed that the PFs in the worse Dα groups had larger uncertainty intervals and that larger uncertainty intervals coincided with shallower slopes (). The shallower slope means that the perceptual distance between JNDα (67%) and Dα (80%) increased further. Second, the tested ICDs and the number of trials in both the PF and full-array experiments likely played a role. In the PFs, participants with excellent pitch discrimination ability listened to many “easy” probe tones. These participants probably knew better what the reference stimulus sounded like. In contrast, for poor performers, all ICDs were harder to distinguish, and this intuition may not have developed. Moreover, in the full-array test, the test would have been rather quickly aborted for the poor performers, typically at an ICD ≥ 2. During PF measurement, however, the PFs continued to smaller ICDs for the poor performers, as well. The fitting of these data is expected to yield thresholds within the range of the data (smaller than ICD = 2), leading to a JNDα that is systematically smaller than Dα. The explanations above highlight that the full-array test works well with clearly defined underlying PFs, with a clear cut-off between discrete ICDs (e.g. ). For underlying PFs with shallow slopes or higher thresholds, the full-array test might be prematurely terminated.
Considerations about loudness roving
As mentioned earlier, a frequently noted confounder in pitch discrimination experiments is the accidental following of the loudness cue instead of the pitch cue. Especially in 3AFC odd-one-out experiments, participants are expected to focus on any perceived difference between the probe and reference stimuli. Also, in our study, participants may have done the test (partially) on loudness cues. When the pitch cue was increasingly harder to follow, the loudness difference might especially have been appealing. Although loudness balancing was carefully performed, the uniformly drawn LRF could have led to stimuli that were clearly louder or softer than the others.
In our “sanity check” of how participants chose answers with respect to the LRF, we found obvious examples of participants who favoured the louder stimulus. We asked whether some participants could have been misled by the loudness cue or chose the loudness cue they could distinguish in the absence of a pitch cue (i.e. a small α). We found that the loudness cue did potentially influence some, but not all, participants. This analysis shows that most trials conducted in our study could be considered “sane,” but it also highlights the importance of careful loudness balancing and implementation of level roving. Future studies should keep this effect in mind in the design of similar psychophysical experiments.
Speech perception
We also found that participants with poorer pitch discrimination ability had worse speech recognition scores. This result is in line with those of some other studies (Snel-Bongers et al. Citation2012; Goehring et al. Citation2014; Kenway et al. Citation2015; Biesheuvel et al. Citation2019) but not all previous findings (Donaldson, Dawson, and Borden Citation2011; Donaldson, Kreft, and Litvak Citation2005; Firszt et al. Citation2007). A potential explanation for better pitch discrimination in participants with better speech scores could again be a better or more evenly distributed neural survival (Briaire and Frijns Citation2006). Worse neural survival could mean that two signals stimulating adjacent cochlear regions are not properly distinguished and that the virtual (or physical) channels do not increase the perceived resolution. This pattern could explain why earlier studies have not unequivocally demonstrated increased performance between DES vs. non-DES (Donaldson, Dawson, and Borden Citation2011; Firszt et al. Citation2007). By offering insight into regions of poorer performance, the full-array test has the potential to provide information for clinical use in fitting procedures so that the audiologist can take regions of lesser discriminability into account.
Conclusion
We validated an improved version of our custom-made pitch discrimination test that enables pitch discrimination ability on the full electrode array. We found a strong positive correlation between JNDα and Dα. For participants with poorer pitch discrimination ability, the outcome of the full-array test (Dα) may underestimate the underlying JNDα. Knowing this limitation of the full-array test, we recommend testing the full electrode array and following up on areas of lesser pitch discrimination ability by using more accurate tests (e.g. PFs), and testing a wide range of ICDs. We found strong correlations between participants’ pitch discrimination ability and speech perception. This result, combined with observed regions of lesser pitch discrimination ability, suggests that full-array testing information could aid patient-specific care. With this further development of a full-array test that yields more insight into these regions of lesser pitch discrimination ability, the tool has the potential to aid clinical fitting.
Supplemental Material
Download MS Word (26.6 KB)Disclosure statement
Authors Johan H. M. Frijns and Jeroen J. Briaire have a non-restrictive research grant from Advanced Bionics. Johan H.M. Frijns is also a member of the European medical advisory board of Advanced Bionics.
References
- Baumann, U, and A. Nobbe. 2004. “Pitch Ranking with Deeply Inserted Electrode Arrays.” Ear and Hearing 25 (3):275–283. doi:10.1097/00003446-200406000-00008.
- Bierer, J. A, and L. Litvak. 2016. “Reducing Channel Interaction Through Cochlear Implant Programming May Improve Speech Perception.” Trends in Hearing 20:233121651665338–233121651665312. doi:10.1177/2331216516653389.
- Bierer, J. A, and K. F. Faulkner. 2010. “Identifying Cochlear Implant Channels with Poor Electrode-Neuron Interface: Partial Tripolar, Single-Channel Thresholds and Psychophysical Tuning Curves.” Ear and Hearing 31 (2): 247–258. doi:10.1097/AUD.0b013e3181c7daf4.
- Biesheuvel, J. D., J. J. Briaire, M. A. de Jong, S. Boehringer, and J. H. Frijns. 2019. “Channel Discrimination along All Contacts of the Cochlear Implant Electrode Array and Its Relation to Speech Perception.” International Journal of Audiology 58 (5): 262–268. doi:10.1080/14992027.2019.1573384.
- Bosman, A. J, and G. F. Smoorenburg. 1995. “Intelligibility of Dutch CVC Syllables and Sentences for Listeners with Normal Hearing and with Three Types of Hearing Impairment.” Audiology 34 (5): 260–284. doi:10.3109/00206099509071918.
- Briaire, J. J, and J. H. Frijns. 2006. “The Consequences of Neural Degeneration Regarding Optimal Cochlear Implant Position in Scala Tympani: A Model Approach.” Hearing Research 214 (1–2): 17–27. doi:10.1016/j.heares.2006.01.015.
- Donaldson, G. S., P. K. Dawson, and L. Z. Borden. 2011. “Within-Subjects Comparison of the HiRes and Fidelity120 Speech Processing Strategies: Speech Perception and Its Relation to Place-Pitch Sensitivity.” Ear and Hearing 32 (2): 238–250. doi:10.1097/AUD.0b013e3181fb8390.
- Donaldson, G. S., H. A. Kreft, and L. Litvak. 2005. “Place-Pitch Discrimination of Single- versus Dual-Electrode Stimuli by Cochlear Implant Users.” The Journal of the Acoustical Society of America 118 (2): 623–626. doi:10.1121/1.1937362.
- Firszt, J. B., D. B. Koch, M. Downing, and L. Litvak. 2007. “Current Steering Creates Additional Pitch Percepts in Adult Cochlear Implant Recipients.” Otology & Neurotology 28 (5): 629–636. doi:10.1097/01.mao.0000281803.36574.bc.
- Frijns, J. H., W. Martin, C. Klop, R. M. Bonnet, and J. J. Briaire. 2003. “Optimizing the Number of Electrodes with High-Rate Stimulation of the Clarion CII Cochlear Implant.” Acta Oto-Laryngologica 123 (2): 138–142. doi:10.1080/0036554021000028126.
- Goehring, J. L., D. L. Neff, J. L. Baudhuin, and M. L. Hughes. 2014. “Pitch Ranking, Electrode Discrimination, and Physiological Spread of Excitation Using Current Steering in Cochlear Implants.” The Journal of the Acoustical Society of America 136 (6): 3159–3171. doi:10.1121/1.4900634.
- Grasmeder, M. L., C. A. Verschuur, R. M. van Besouw, A. M. Wheatley, and T. A. Newman. 2019. “Measurement of Pitch Perception as a Function of Cochlear Implant Electrode and Its Effect on Speech Perception with Different Frequency Allocations.” International Journal of Audiology 58 (3): 158–166. doi:10.1080/14992027.2018.1516048.
- Hanekom, J. J, and R. V. Shannon. 1996. “Place Pitch Discrimination and Speech Recognition in Cochlear Implant Users.” South African Journal of Communication Disorders 43 (1): 27–40. doi:10.4102/sajcd.v43i1.236.
- Kenway, B., Y. C. Tam, Z. Vanat, F. Harris, R. Gray, J. Birchall, R. Carlyon, and P. Axon. 2015. “Pitch Discrimination: An Independent Factor in Cochlear Implant Performance Outcomes.” Otology & Neurotology 36 (9): 1472–1479. doi:10.1097/MAO.0000000000000845.
- Koch, D. B., M. Downing, M. J. Osberger, L. Litvak, and S. Greco. 2007. “Using Current Steering to Increase Spectral Resolution in CII and HiRes 90K Users.” Ear and Hearing 28 (Suppl. 2): 38–41. doi:10.1097/AUD.0b013e31803150de.
- Kwon, B. J, and C. van den Honert. 2006. “Dual-Electrode Pitch Discrimination with Sequential Interleaved Stimulation by Cochlear Implant Users.” The Journal of the Acoustical Society of America 120 (1): EL1–6. doi:10.1121/1.2208152.
- Levitt, H. 1971. “Transformed Up-Down Methods in Psychoacoustics.” The Journal of the Acoustical Society of America 49 (2B): 467–477. doi:10.1121/1.1912375.
- McDermott, H. J, and C. M. McKay. 1994. “Pitch Ranking with Nonsimultaneous Dual-Electrode Electrical Stimulation of the Cochlea.” The Journal of the Acoustical Society of America 96 (1): 155–162. doi:10.1121/1.410475.
- McKay, C. M., H. J. McDermott, and R. P. Carlyon. 2000. “Place and Temporal Cues in Pitch Perception: Are They Truly Independent?” Acoustics Research Letters Online 1 (1): 25–30. doi:10.1121/1.1318742.
- Schütt, H. H., S. Harmeling, J. H. Macke, and F. A. Wichmann. 2016. “Painfree and Accurate Bayesian Estimation of Psychometric Functions for (Potentially) Overdispersed Data.” Vision Research 122:105–123. doi:10.1016/j.visres.2016.02.002.
- Shannon, R. V. 1983. “Multichannel Electrical Stimulation of the Auditory Nerve in Man. I. Basic Psychophysics.” Hearing Research 12 (1): 1–16. doi:10.1016/0378-5955(83)90115-6.
- Shannon, R., Q.-J. Fu, and J. Galvin Iii. 2004. “The Number of Spectral Channels Required for Speech Recognition Depends on the Difficulty of the Listening Situation.” Acta Oto-Laryngologica 124 (0): 50–54. doi:10.1080/03655230410017562.
- Snel-Bongers, J., J. J. Briaire, F. J. Vanpoucke, and J. H. Frijns. 2011. “Influence of Widening Electrode Separation on Current Steering Performance.” Ear and Hearing 32 (2): 221–229. doi:10.1097/AUD.0b013e3181f8c0fe.
- Snel-Bongers, J., J. J. Briaire, F. J. Vanpoucke, and J. H. M. Frijns. 2012. “Spread of Excitation and Channel Interaction in Single- and Dual-Electrode Cochlear Implant Stimulation.” Ear and Hearing 33 (3): 367–376. doi:10.1097/AUD.0b013e318234efd5.
- Townshend, B., N. Cotter, D. Van Compernolle, and R. L. White. 1987. “Pitch Perception by Cochlear Implant Subjects.” The Journal of the Acoustical Society of America 82 (1): 106–115. doi:10.1121/1.395554.
- Verbist, B. M., R. M. Joemai, J. J. Briaire, W. M. Teeuwisse, Wouter J. H. Veldkamp, and J. H. Frijns. 2010. “Cochlear Coordinates in Regard to Cochlear Implantation: A Clinically Individually Applicable 3 Dimensional CT-BBased Method.” Otology & Neurotology 31 (5): 738–744. doi:10.1097/MAO.0b013e3181d8d3c4.
- Verbist, B. M., M. W. Skinner, L. T. Cohen, P. A. Leake, C. James, C. Boëx, T. A. Holden, C. C. Finley, P. S. Roland, J. T. Roland, et al. 2010. “Consensus Panel on a Cochlear Coordinate System Applicable in Histologic, Physiologic, and Radiologic Studies of the Human Cochlea.” Otology & Neurotology 31 (5): 722–730. doi:10.1097/MAO.0b013e3181d279e0.
- Verbist, B. M., Johan H. M. Frijns, J. Geleijns, and M. A. V. Buchem. 2005. “Multisection CT as a Valuable Tool in the Postoperative Assessment of Cochlear Implant Patients Multisection CT as a Valuable Tool in the Postoperative Assessment of Cochlear Implant Patients.” AJNR. American Journal of Neuroradiology 26 (2): 424–429.
- Zwolan, T. A., L. M. Collins, and G. H. Wakefield. 1997. “Electrode Discrimination and Speech Recognition in Postlingually Deafened Adult Cochlear Implant Subjects.” The Journal of the Acoustical Society of America 102 (6): 3673–3685. doi:10.1121/1.420401.