
Abstract
Objectives
We examined which preoperative diagnostic measure is most suited to serve as a selection criterion to determine adult cochlear implantation (CI) candidacy.
Design
Preoperative diagnostic measures included pure tone audiometry (PTA; 0.5, 1, 2, 4 kHz), speech perception tests (SPT) unaided with headphones and with best-aided hearing aids (in quiet and in noise). Gain in speech perception was used as outcome measure. Performance of preoperative measures was analysed using the area under the curve (AUC) of receiver operating characteristic (ROC) curves.
Study sample
This retrospective longitudinal cohort study included 552 post-lingually deafened adults with CI in a tertiary referral centre in the Netherlands.
Results
Best-aided SPT in quiet was the most accurate in defining which CI candidates improved their speech perception in quiet postoperatively. For an improvement in speech perception in noise, the best-aided SPT in noise was the most accurate in defining which adult would benefit from CI. PTA measures performed lower compared to the SPT measures.
Conclusions
SPT is better than PTA for selecting CI candidates who will benefit in terms of speech perception. Best-aided SPT in noise was the most accurate for indicating an improvement of speech perception in noise but was only evaluated in high performers with residual hearing. These insights will assist in formulating more effective selection criteria for CI.
Introduction
Inclusion criteria, to accurately select hearing-impaired patients for cochlear implantation, have been investigated extensively to determine the optimal pre-implant audiometric threshold values (Hoppe, Hast, and Hocke Citation2015; Snel-Bongers et al. Citation2018; Huinck, Mylanus, and Snik Citation2019; McRackan et al. Citation2018; Maeda et al. Citation2018; Gubbels et al. Citation2017; Leigh et al. Citation2016; Vickers, De Raeve, and Graham Citation2016). Typically, readily available clinical tests are used to evaluate the level of hearing loss (HL). This has resulted in many alternative tests being used across different countries. However, to date, no studies have focussed specifically on which pure tone audiometric or speech measure(s) would be the most accurate in defining which post-lingual adult will improve their speech perception after receiving cochlear implants (CIs). In this retrospective study, we evaluated the accuracy of different preoperative measures in determining which post-lingually deafened adult will benefit from CI and to what extent they can function as a measure to determine candidacy for CI.
The intention of CI candidacy criteria is to ensure that a large proportion of patients will hear better with a CI than they do with a hearing aid (HA). The gradual shift in criteria for cochlear implantation have resulted in the consideration of patients with more residual hearing. These patients often have far higher pre-implant speech understanding abilities, which makes it more difficult to demonstrate substantial benefit in post-implantation speech perception.
The degree of rigidity for inclusion criteria and mechanisms for setting them differ per country and is mainly driven by reimbursement policies within each country (Vickers, De Raeve, and Graham Citation2016). A cost element is often applied using a cost-benefit evaluation, or by limiting the number of implantations. Previous research has suggested that candidacy criteria should be based on the post-implant outcomes from the lowest 10th to 25th percentile (p10–p25). The associated cut-off values for preoperative pure tone audiometry (PTA) (Hughes et al. Citation2014; Gubbels et al. Citation2017) and speech perception tests (SPT) (Verhaegen et al. Citation2008; Snel-Bongers et al. Citation2018; Gubbels et al. Citation2017) were then used to define the pre-operative criteria. However, these criteria are based on the locally adopted speech tests (i.e., consonant-vowel-consonant words or sentence list unaided with headphones or best-aided, in quiet or noise) and/or audiometric frequencies evaluated (i.e., degree of HL at 2 or more frequencies), which vary greatly from country to country. No research to date has considered which preoperative PTA or SPT may be more appropriate to determine candidates who will benefit from CIs.
PTA relates to SPTs because the audibility of the speech signal affects its perception (Maeda et al. Citation2018; Hoppe, Hast, and Hocke Citation2015; Lovett, Vickers, and Summerfield Citation2015; Firszt et al. Citation2018). However, research has shown a weak to moderate correlation between PTA and unaided maximum monosyllabic word score indicating that outcomes of one measure cannot completely predict the other (Hoppe, Hast, and Hocke Citation2015). Moreover, this latter unaided speech perception score with headphones frequently underestimates patients’ best-aided speech perception in the free-field as the real-world communication abilities are not accurately reflected (McRackan et al. Citation2018).
Previous research identified predictors of post-implant outcomes that can be used to inform patients about their chances of improvement after CI (Gomaa et al. Citation2003; Cullen et al. Citation2004; Kraaijenga et al. Citation2016; Gubbels et al. Citation2017; Blamey et al. Citation2013; Rubinstein et al. Citation1999; Hoppe, Hast, and Hocke Citation2015). Some of these studies found that either the preoperative degree of HL (Rubinstein et al. Citation1999; Gubbels et al. Citation2017; Hoppe, Hast, and Hocke Citation2015) or preoperative speech scores (Gomaa et al. Citation2003; Cullen et al. Citation2004; Gubbels et al. Citation2017; Firszt et al. Citation2018; Hoppe, Hast, and Hocke Citation2015) were valuable for predicting postoperative outcomes by using a multi linear regression analysis, correlation or pairwise comparison.
However, no research to date has compared the diagnostic performance of preoperative PTA and SPT for CI-candidates by calculating the predictive values with a binary classification. One study reported a sensitivity of 87% and specificity of 91% when an average PTA (0.5, 1, 2, 4 kHz) and the maximum monosyllabic word score with headphones were used as preoperative measures to predict the word score with HAs (Hoppe, Hast, and Hocke Citation2015). They calculated this based on a simple linear formula where CI could be considered when the average PTA and unaided word score differed from each other. However, a comparison between the two different preoperative audiometric and speech measures was not conducted. It is still not known which PTA approach (average or threshold of one or more frequencies) is more effective at indicating which CI candidates will clinically improve their speech perception following implantation. Frequencies between 1 and 4 kHz are important for the discrimination of speech, especially for patients with high frequency loss who often fail to detect the consonant cues (Maeda et al. Citation2018). For example, the United Kingdom recently changed their CI candidacy criteria and now use PTA differently (National Institute for Health and Clinical Excellence Citation2009; National Institute for Health and Clinical Excellence Citation2019). Previously, the level of HL was evaluated on the 2 and 4 kHz frequencies, which were changed to two or more frequencies between 0.5 and 4 kHz without solid evidence (Vickers et al. Citation2016; Lovett, Vickers, and Summerfield Citation2015).
Performance analysis of screening methods with a binary outcome has never been used in CI evaluation but is commonly used in biomedical decision-making (Lasko et al. Citation2005). The binary outcome for CI candidacy used in the context of the present study, is improvement versus no improvement of speech perception after implantation. The proportion of patients selected correctly by the preoperative measure i.e. who improve their speech perception postoperatively (sensitivity) is compared to the proportion of patients (hypothetically) rejected by the preoperative measure who showed no improvement in their speech perception scores after CI (specificity). Subsequently, these proportions of sensitivity and specificity for each cut-off value can be plotted on a receiver operating characteristic (ROC) curve (Fawcett Citation2006; Lasko et al. Citation2005). The larger the area under the curve (AUC) of a measure, the higher its performance in selecting appropriate patients and rejecting patients who will not have improved speech perception after receiving the CI. Three conditions are required for such an analysis: (1) many patients who have been implanted with a CI, (2) based upon relatively lenient candidacy criteria (80%-best-aided phoneme score or 60%-word score), and (3) the availability of a broad range of preoperative measures (e.g. different PTAs, including an average or threshold of different frequencies, and unaided or best-aided SPT in quiet or noise). These conditions ensure that there is a discrimination value based on the number of patients who will not improve their speech perception postoperatively.
Present study
The main aim of this retrospective study was to determine which preoperative measure is the most effective in selecting CI candidates who will improve their speech perception postoperatively. Different preoperative measures used in various countries were compared, including PTA with different combinations of frequencies (e.g. average or threshold, high vs. low or 2 vs. 3 or 4 frequencies) and SPT (e.g. unaided, with best-fitted HAs, scored as words or phonemes correct, either in quiet or in noise). This was evaluated by defining the correlation between the measures and comparing the AUC of the ROC curves. The study included a large group of post-lingually deafened patients who were implanted with a CI at Leiden University Medical Centre (LUMC) in the Netherlands.
Materials and methods
Procedure
This retrospective study reviewed all patients with post-lingually occurring HL implanted with a CI at LUMC (ethical approval was obtained through the Medical Ethics Committee of the LUMC). Post-lingual HL was defined as the onset of moderately severe to profound HL (Clark Citation1981) after 4 years of age. Records were reviewed for a total of 566 adult patients (≥18 years of age at time of implantation) with bilateral post-lingual onset of HL who were implanted with CI between 2000 and 2017. Four patients were sequentially implanted (the second-side was excluded from the analysis). All patients had to have at least 1 year of postoperative follow-up. Fourteen patients were consequently excluded, of whom five were explanted within one year (because of partial luxation or migration of the electrode, implant failure, wound infection, or removal of vestibular schwannoma), seven died (due to causes unrelated to implantation) during the first year, and two (one of them a marginal performer) were lost to follow-up after 3 months, precluding conclusions about their final outcomes. After exclusions, 552 patients with post-lingual onset of HL were included in the study ().
Table 1. Characteristics of the study population (n = 552).
Selection criteria of the LUMC
Based on the good outcomes with CI, selection criteria became more relaxed over the years in LUMC. Current criteria are based on a detailed analysis as described in Snel-Bongers et al. (Citation2018). In summary, the current selection criteria for adults require candidates to score less than 80% on a CVC phoneme test or less than 60% CVC word score with best-fitted HAs at 65 dB SPL in quiet. Additionally, for patients with best-aided phoneme scores above 50%, their best-aided phoneme score with speech at 65 dB SPL in a + 5dB SNR condition must be less than 50% in order to be eligible for CI. There are no explicit minimum inclusion criteria in our centre, e.g. duration of deafness is no reason not to implant if it concerns patients with post-lingual HL. In our centre, without contraindications, it is standard of practice to implant the worst-performing ear to preserve the best-performing ear for HA usage.
Preoperative measures
PTA was performed using the frequencies 0.25, 0.5, 1, 2, and 4 kHz to calculate the degree of HL. Different types of PTA were established based on an average of two to five frequencies. In some countries a more binary criterion based on the PTA is used (e.g. two or more thresholds in the audiogram above 85 dB). These criteria for the degree of HL were assessed by individually evaluating each frequency that exceeded a varying value or threshold.
SPT was conducted using the standard Dutch Society of Audiology test, consisting of phonetically balanced monosyllabic consonant-vowel-consonant (CVC) words (Bosman and Smoorenburg Citation1995). The testing procedure comprised four lists per condition, each containing 11 words of one syllable (total 44 words and 132 phonemes). First, the maximum unaided phoneme score with headphones was obtained. The maximum percentage of phonemes correct at presentation levels between 30- and 130-dB SPL was reported for each ear separately. Hereafter, the phoneme and word score with best-fitted HAs in the free-field were obtained to measure the real-world speech perception abilities. The difference between word and phoneme scores is based on the scoring method. For word scores (pw) the percentage of correct “whole” words is used while for the phoneme scores (pph) the percentage in correct phonemes is scores (e.g. the response “tip” when “ship” is presented, will give 0%-word score, and 66% phoneme score). The scores are highly correlated (for the Dutch CVC test: pw = pph2.3) but the phoneme score has a higher specificity in the low-performance range (Gelfand, Christie, and Gelfand Citation2014).
Within the population, 405 patients used two, 102 patients used one, and 40 patients used no HAs (5 subjects with missing data). The latter patients had either profound HL due to meningitis (n = 14), progressive HL (n = 9), sudden deafness (n = 8), trauma (1), or no measurable hearing without specific aetiology (n = 8) that impeded them from using amplification. Words were presented at 65 dB SPL over a loudspeaker placed 1 m in front of the patient (calibrated with a Rion Class 1 NA-28 Sound Level Meter). We used the standard reference track of the NVA material with a continuous signal (long-term averaging of at least 15 s). If a phoneme score in quiet of >50% was achieved, a speech-in-noise test was conducted in speech-shaped noise at a + 5 dB signal to noise ratio.
Postoperative outcome measure
During the first 3 months of CI use, patients received intensive hearing training from professional speech therapists (daily in the first four weeks, decreasing to weekly in the last weeks) and approximately 5 fitting sessions. The postoperative SPT took place at 1 and 2 weeks, 1, 3, and 6 months, and 1, 2, and 3 years after initial stimulation. Tests was performed under the same conditions as the preoperative tests (65 dB SPL in quiet and +10dB, +5dB, 0 dB SNR). The one-year postoperative speech scores were in some cases collected on a slightly earlier or later time-point due to logistics (range 1–3 months). This deviation, in our opinion, does not influence the outcomes as postoperative speech scores at 1 year are nearly similar to the 6 months and 2nd year follow-up scores (Snel-Bongers et al. Citation2018). Postoperatively and during follow-up, only the implanted ear was tested with an unaided or plugged contralateral ear to examine the actual progress with the CI. Of course, in a couple of (esp. with ski-sloped audiograms) patients some minor benefit of the plugged ear could still be present. Masking would however be overheard via the CI in many cases, and the difference of the plugged relative to the aided condition was deemed large enough that the CI performance would dominate the scores. Postoperative improvement in speech perception was analysed at the level of the patient by subtracting the best-aided preoperative phoneme scores (both in quiet and in noise) from the postoperative phoneme scores with the CI at 1 year after initial stimulation.
For the ROC analysis a binary outcome is needed relative to the variable inclusion criteria. For this study the binary outcome of no improvement (<0%) and improvement (≥0%) was chosen to indicate that the patient had reached the same speech perception level with CI (either in quiet or in +5 dB SNR noise) as preoperatively with optimally fitted HAs. In addition, a third condition was included, focussing on the benefit of only the implanted ear. This criterion was obtained by subtracting the maximum phoneme score (irrespective of the level) with headphones of the implanted ear from the postoperative phoneme scores with the CI at 1 year after initial stimulation. In this case, the criterion for improvement was that the phoneme score in the implanted ear had increased by at least 20%.
Statistical analysis
The preoperative measures used in LUMC were adapted as far as possible to correspond to internationally used preoperative measures discussed in the literature (Hughes et al. Citation2014; De Raeve, and Wouters Citation2013; Huinck, Mylanus, and Snik Citation2019; Gubbels et al. Citation2017; National Institute for Health and Clinical Excellence Citation2009; National Institute for Health and Clinical Excellence Citation2019; Snel-Bongers et al. Citation2018).
The accuracy of the preoperative measures was evaluated with a ROC curve analysis. This method is extensively used in medicine to describe the diagnostic accuracy of a test (Obuchowski Citation2005; Obuchowski and Bullen Citation2018; Hoo, Candlish, and Teare Citation2017; Fawcett Citation2006). A clinical test based on a continuous outcome uses different cut-off points to predict the presence of a disease which is associated with a sensitivity and specificity (Obuchowski and Bullen Citation2018). In case of our study, we are not interested in the presence of disease, but in the presence of improved speech perception postoperatively. All possible cut-off points are chosen and the sensitivity/specificity pairs are used to generate a curve. Each coordinate (x, y) on the curve represents the true-positive (sensitivity) and the false-positive rate (1-specificity) associated with a cut-off-point of the test (0–120 dB for PTA and 0–100% for SPT). This ROC curve is thus a graphical plot that exemplifies a diagnostic test’s accuracy and can be used on both paired and unpaired data (Fawcett Citation2006; Lasko et al. Citation2005; Obuchowski and Bullen Citation2018). If the curve crosses the plot as a diagonal line, the test has no distinctive capability but uses random decision-making. The ideal test has a ROC curve that bends to the upper left corner which illustrates a high true-positive rate against a low false-positive rate. The area under the ROC curve (AUC) is a measure of discriminatory power of the test, irrespective of a specific cut-off point. The AUC of a test with no diagnostic ability is 0.5 while a measure that perfectly discriminates between two conditions has an AUC of 1.
We checked if the outcomes of the ROC-curves were different when the target of postoperative improvement of speech perception was changed (less than 0%, 5%, 10%, 15%, or 20% speech improvement as a negative outcome) to examine if the accuracy of each measure differs when the number of true negatives increases. This did not yield a difference in the order of which preoperative measure had the highest AUC (Fawcett Citation2006; Lasko et al. Citation2005; Obuchowski and Bullen Citation2018). For clarity only the analysis where we compared the postoperative speech scores with CI only with the preoperative best-aided condition with speech improvement of ≥0% as a positive outcome and <0% speech improvement after CI as a negative outcome will be presented. In the condition where we compared the postoperative with the preoperative speech perception score of the ear-to-be-implanted only 7 patients did not improve their speech perception at the implanted side by more than 0% for this reason the criterium for this condition was set at >20%. Data analyses were performed using the IBM SPSS Statistics 26.0 software package which enabled us to compare the AUC of the preoperative measurements with paired sample t-tests. The multiple comparisons were corrected with a Bonferroni correction resulting in a significance level of p < 0.0003.
Missing data
Little’s missing completely at random test was significant (p < 0.001), meaning that the missing data were either missing at random or missing not at random rather than missing completely at random. Missing at random means that the reason for missingness is related to other factors that are measured within the dataset, see for a detailed explanation of terms Netten et al. Citation2017 (Buuren Citation2012; Netten et al. Citation2017). In the case of our study, we therefore argue that the missing data was missing at random as the reason for missingness was held in the dataset: most patients with missing data were either good or poor performers (based on the measurements at 6 months, 2 or 3 years postoperative) which might made them think that their yearly appointments deemed unnecessary. Postoperative 1-year SPT in quiet and noise were unavailable for 136 and 221 patients, respectively. When conducting standard analyses, such as ROC curves, incomplete cases are automatically excluded (Netten et al. Citation2017; Madley-Dowd et al. Citation2019). Excluding the poor and good performers would bias the findings and potentially lower the statistical power due to loss of participants. To adequately deal with these missing data, the multiple imputation technique was used (Buuren Citation2012; Sterne et al. Citation2009; Madley-Dowd et al. Citation2019; Schafer and Graham Citation2002). With this technique, missing data are imputed based on the known characteristics of the patients (gender, age at implantation, implantation side, duration of deafness, cause of deafness, preoperative and postoperative measures at 1 and 2 weeks, 1, 3, and 6 months, and 1, 2, and 3 years after initial stimulation). We used 10 imputed datasets and pooled the 10 outcomes. All analyses were performed on the imputed and original data, which did not yield different outcomes.
Results
The ROC curves with imputed data were plotted for a selection of preoperative measures (). The Supplementary Table reports the AUC of all preoperative measures. Within the best-aided condition, 28 patients (5.1%) did not improve while 524 patients did improve their speech perception after cochlear implantation based on the binary threshold of 0% improvement of phoneme scores. The 28 patients scored preoperatively on average 67% (range 21–97%) with the best-aided SPT in quiet and 41% (20–84%) in noise. Most of them had an asymmetrical HL (n = 19 had more than 30% phoneme score difference between ears).
Figure 1. Receiver operator characteristic curves of preoperative pure tone audiometry and speech perception measures with imputed data (n = 552).
Diagnostic performance was analysed using improvement of phoneme score in a best-aided quiet setting at (A), in the implanted ear (B), or in a best-aided setting with +5 dB signal to noise ratio as a positive outcome. Only pure tone audiometry with the highest area under the curve were added to the ROC curve.
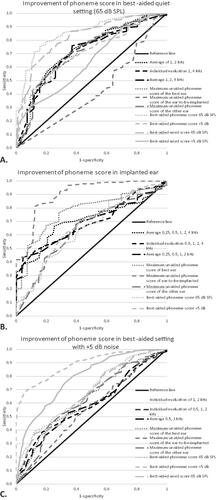
shows that most preoperative measures performed nearly similar when using improvement in a best-aided condition. The best-aided phoneme score presented in quiet at 65 dB SPL in the free-field had the highest AUC of all preoperative measures, followed by the best-aided word score in quiet. The best-aided phoneme and word score significantly differed from the maximum unaided phoneme score at the implanted side, individual evaluation of 0.5, 1, and 2 kHz, individual evaluation of 2 or more frequencies (0.5, 1, 2, 4 kHz), individual evaluation of 2 or more frequencies (0.25, 0.5, 1, 2, 4 kHz), and individual evaluation of 0.5 and 1 kHz (p < 0.0003). The maximum unaided phoneme score of the ear-to-be-implanted had a ROC curve that was smaller than the reference line (also Supplementary Table). The average PTA of 1 and 2 kHz had the highest AUC of all PTAs but was not significantly different (p = 0.005–0.631). Evaluating two or more frequencies individually did not significantly differ from the reference line, which indicated that this preoperative measure did not have a distinctive capability (Supplementary Table).
Twenty percent of improvement at the implanted ear also resulted in 28 patients who did not and 524 patients who did improve. The 28 candidates scored preoperatively on average 53% (range 5–87%) phonemes correct at the ear that would be implanted. Only four of these patients had asymmetrical HL of more than 30% phoneme score difference between ears.
After using improvement of phoneme scores in the implanted ear in a ROC analyses, we found that the maximum unaided phoneme score with headphones of the ear-to-be-implanted had the highest AUC of all preoperative measures ( and Supplementary Table) and significantly differed compared to all other SPTs and PTAs (p < 0.0003). The maximum unaided phoneme score with headphones of the best ear performed second-best but did not differ significantly compared to other SPTs (p = 0.003–0.075). Average of five frequencies (0.25, 0.5, 1, 2, 4 kHz) had the highest AUC of all PTAs but was not significantly different compared to other PTAs (p = 0.019–0.664).
When analysing improvement with best-aided phoneme scores in noise, we found that 33 patients did not and 519 patients did improve. The 33 patients scored preoperatively a mean phoneme score of 50% (range 26–84%) correct in a best-aided condition with +5 dB signal-to-noise ratio. The best-aided phoneme score at +5 dB signal to noise ratio had the highest AUC compared to all other preoperative measures (p < 0.0003), except for no significant difference compared to the best-aided phoneme and word score in quiet and word score in noise (p = 0.002–0.069) ().
Analysis showed that the order of AUC-outcomes of the preoperative measures did not change when the threshold for improvement was set to 5% or 20% improvement in phoneme scores instead of 0% (in all three conditions). The number of patients with no improvement in for example the best-aided condition increased from 28 to 41 and 107, respectively (i.e. 7.4% to 19.4% of the total population).
Discussion
This study compared the diagnostic performance of different preoperative measures in selecting post-lingually deafened adult CI candidates who had better speech perception with a CI than preoperatively and rejecting candidates who would not improve. We found that the diagnostic performance of the preoperative measures depended on which outcome objective was used and that the evaluated preoperative measures did not differ considerably in their efficacy as a diagnostic test. The best-aided SPT in quiet at 65 dB had the highest diagnostic performance to select candidates who improve their best-aided speech perception in quiet. For an improvement of 20% in the ear-to-be-implanted, the preoperative maximum unaided phoneme score with headphones of the ear-to-be-implanted had the highest performance. The best-aided SPT with a + 5 dB signal to noise ratio had the highest performance for indicating a postoperative improvement in noise but was only evaluated for those at the upper end of the performance range, as they must reach at least 50% phoneme scores in quiet in order to be tested in noise in our centre. The results of this study could help different authorities, such as healthcare commissioners and implant centres, improve adult CI selection criteria by changing the preoperative measures to the most effective one.
Most studies have examined which inclusion criteria should be followed by using the standard preoperative measures available (Hoppe, Hast, and Hocke Citation2015; Snel-Bongers et al. Citation2018; Huinck, Mylanus, and Snik Citation2019; McRackan et al. Citation2018; Maeda et al. Citation2018; Gubbels et al. Citation2017; Leigh et al. Citation2016; Vickers, De Raeve, and Graham Citation2016). This study found that preoperative SPT had the highest performance as a classifier to indicate speech improvement in CI candidates. This result was not completely unexpected as the main goal of a CI is to improve speech perception.
The patients with no improvement often had residual hearing, performed at the better end of the performance range, or had an unusual HL (Huinck, Mylanus, and Snik Citation2019; Snel-Bongers et al. Citation2018; Leigh et al. Citation2016). This allowed them to only marginally improve their speech perception in quiet after CI. Making accurate and informed decisions for these high-performers is the most critical. This evidence-based study reasoned that for candidates with residual hearing or unusual HL (e.g. shape of the PTA), a SPT in noise is a more appropriate preoperative test to indicate which candidates would improve their speech perception in noise with CI.
One can argue about the ideal postoperative measure to indicate improvement. A best-aided condition, including the contralateral HA, represents actual clinical progress. However, such a measure can also mask the benefit of the implant. This can be the case in a patient with asymmetric HL where one ear meets CI-criteria (e.g. speech perception of 30% correct) while the better ear still reaches speech perception of 80% correct. Measuring postoperative speech perception in these patients in a best-aided condition will probably only demonstrate the progression of the non-implanted ear and not the effect of CI. These patients will also rate the effect of the implant rather poorly as it is underperforming relative to the HA. Therefore, in line with earlier research (Leigh et al. Citation2016; Snel-Bongers et al. Citation2018), we argue that postoperative improvement should be calculated as the speech perception scores with CI only in relation to the preoperative level of performance in a best-aided condition. This is probably the most stringent criterion of improvement that can be defined. However, when improvement is achieved with this method, actual clinical progress with the CI is the case. Of course showing progress using this definition in single sided deaf patients will be impossible and makes this criterion less than optimal in these populations.
At our centre, the number of patients who obtained poorer speech perception after CI was very low (5%) giving a small group of patients a large influence on the outcomes. Therefore, we also analysed the performance of preoperative measures with 5–20% improvement in speech perception (instead of the 0% as reported above), which led to an increased number of patients with a negative outcome (7–19% of the total population). However, this did not influence the order of efficacy of preoperative measures. Apparently, the type of preoperative measure, rather than the amount of improvement, was important for selecting CI candidates with improved postoperative speech perception.
PTA is easily accessible worldwide and often used as a preoperative criterion for cochlear implantation. However, this study showed that the PTA did not perform as well as SPT in predicting speech improvement after CI. Even using PTA differently, for example, by the individual evaluation of each frequency, or an average of different frequencies, did not lead to a better performance. PTA and SPT are often combined for selecting CI candidates. Yet, calculating the performance of these two preoperative measures together was not possible with the ROC analysis as PTA and SPT have different scales. This would require the cut-off point of one of the measures to be fixed (e.g. PTA with 85 dB HL or SPT with 50% phonemes correct as cut-off point). Future studies examining the selection criteria by expanding the cut-off values of their preoperative measures should add ROC analysis (van der Straaten et al. Citation2021).
Furthermore, policy-makers can debate inclusion criteria when knowing which preoperative measure has the best performance. The cut-off value of this measure can then be chosen by shifting between the sensitivity and specificity rates. One could, e.g. require that the preoperative measure selects 90% of the candidates who improve their speech perception after CI instead of the requirement that candidates must have at least a 90% chance that their speech perception with CI exceeds their performance with conventional HAs (sensitivity vs. positive predictive value) (Snel-Bongers et al. Citation2018; Verhaegen et al. Citation2008).
Strengths & limitations
This study used a large group of post-lingually deafened adults who had been implanted with CIs under relatively lenient candidacy criteria. These lenient criteria resulted in some patients not showing improvements in speech perception after implantation, allowing us to calculate which preoperative measure rejected these patients based on the postoperative improvement. The possibility of using speech in noise as a preoperative measure was explored, and was demonstrated to be an important measure for assessing the borderline candidates at the upper end of the performance spectrum. It would be interesting to validate our results in populations using even more lenient candidacy criteria, such as in Germany (Vickers, De Raeve, and Graham Citation2016).
It is important to mention a confounder in the presented data. The success criteria used in all ROC-curves is based on improvement in speech scores. This variable includes the pre-operative speech score that is also used as a predictor. At the same time there is a covariate in the known fact that the postoperative performance is correlated with the preoperative scores. A direct consequence hereof is an increased AUC for the speech based predictors. We have, however, chosen for these variables because they agree with clinical practice of CI candidacy, counselling, the predictive values used in literature and the way policies are made (van der Straaten et al. Citation2021). As described before, CI criteria research takes place on speech scores while success is measured in improvement in the same domain. The presented data, although inevitably statistically biased, reflect the standard clinical considerations. A statistically more accurate method would have been to use a more or less independent measure relative to all audiological measures (e.g. quality of life) as success criteria. Although valuable, such an approach would be less fitting to the daily situations. In the recent paper by Reddy et al. (Citation2022) the selection of candidates was used as the criterion in the ROC curve. This would allow us to include the rejected candidates in our centre as well. It would, however, not have solved the issue of the confounder, probably even have enhanced it, as in the latter paper, their criteria are also based on speech scores (Aided AzBio sentences in quiet <60% or Aided AzBio +10 < 60%).
We are aware that measuring the postoperative performance with CI only is rather strict. It could be argued that postoperative improvement should be examined by using the same SPT pre- as postoperatively (e.g. in a best-aided condition). However, in our opinion it is much more relevant to examine the actual progress of the CI rather than the best-aided condition. Patients with residual or asymmetric HL for example obtain high preoperative best-aided speech perception scores with their better contralateral amplified ear. Measuring the postoperative speech perception in a best-aided condition would not be informative regarding the CI-performance, especially when the poorer performing ear is implanted, as is most often the case in our centre.
Importantly, the findings of this study only apply to post-lingually deafened adults and not pre-lingually deaf children, as they differ considerably in preoperative characteristics (e.g. aetiology and age at implantation) (Peterson et al., Citation2010). Children are also not able to complete a preoperative SPT and therefore the only available preoperative measure would be a PTA (Lovett, Vickers, and Summerfield Citation2015). The outcomes of the PTA and SPT in this study were adapted in order to correspond to internationally available tests. In addition, the SPT was only validated in Dutch and not in other languages (Bosman and Smoorenburg Citation1995). Therefore, the conclusions of this study should be validated in other countries which have different preoperative outcome measures. Future studies should also consider other preoperative measures, such as sentence tests, or quality of life questionnaires, as potential measures for selecting adult CI candidates, although these are more likely to be influenced by cognitive function (Lee et al. Citation2016). In addition, other factors (e.g. subjective, spatial hearing, or pitch discrimination) that could contribute to an improvement of listening experience after CI have not been considered in this study.
To conclude, this study examined which preoperative measures should be used to appropriately determine which post-lingually deafened adults will improve their speech perception after CI. The findings showed that SPTs in quiet and in noise, rather than PTA-based criteria, have a higher performance for indicating which CI candidates will most likely show post-operative improvement in speech perception in quiet or in noise. Implementation of these insights could improve the approach for selecting candidates and help commissioning bodies formulate more effective selection criteria for CI in post-lingually deafened adults.
Supplemental Material
Download MS Word (26.3 KB)Acknowledgements
Study concept and design: T.F.K.S., A.V.M.B., and J.J.B. Acquisition, analysis or interpretation of data: all authors. Statistical analysis: T.F.K.S and A.V.M.B. Drafting of the manuscript: T.F.K.S., A.V.M.B., and J.J.B. Critical revision of the manuscript for important intellectual content: all authors.
Disclosure statement
No potential conflict of interest was reported by the author(s).
Additional information
Funding
References
- Blamey, P., F. Artieres, D. Başkent, F. Bergeron, A. Beynon, E. Burke, N. Dillier, R. Dowell, B. Fraysse, S. Gallégo, et al. 2013. “Factors Affecting Auditory Performance of Postlinguistically Deaf Adults Using Cochlear Implants: An Update with 2251 Patients.” Audiology & Neuro-Otology 18 (1): 36–47. doi:10.1159/000343189.
- Bosman, A. J, and G. F. Smoorenburg. 1995. “Intelligibility of Dutch CVC Syllables and Sentences for Listeners with Normal Hearing and with Three Types of Hearing Impairment.” Audiology 34 (5): 260–284. doi:10.3109/00206099509071918.
- Buuren, S. v 2012. Flexible imputation of missing data. New York: Chapman and Hall/CRC. https://www.taylorfrancis.com/books/9781439868256.
- Cullen, R. D., C. Higgins, E. Buss, M. Clark, H. C. Pillsbury, and C. A. Buchman. 2004. “Cochlear Implantation in Patients with Substantial Residual Hearing.” The Laryngoscope 114 (12): 2218–2223. doi:10.1097/01.mlg.0000149462.88327.7f.
- Clark, J. G. 1981. “Uses and abuses of hearing loss classification.” ASHA 23 (7): 493–500.
- Fawcett, T. 2006. “An introduction to ROC analysis.” Pattern Recognition Letters. 27 (8): 861–874. doi:10.1016/j.patrec.2005.10.010.
- Firszt, J. B., R. M. Reeder, L. K. Holden, N. Y. Dwyer, B. Gotter, and Asymmetric Hearing Study Team. 2018. “Results in Adult Cochlear Implant Recipients with Varied Asymmetric Hearing: A Prospective Longitudinal Study of Speech Recognition, Localization, and Participant Report.” Ear and Hearing 39 (5): 845–862. doi:10.1097/AUD.0000000000000548.
- Gelfand, J. T., R. E. Christie, and S. A. Gelfand. 2014. “Large-Corpus Phoneme and Word Recognition and the Generality of Lexical Context in CVC Word Perception.” Journal of Speech, Language, and Hearing Research 57 (1): 297–307. doi:10.1044/1092-4388(2013/12-0183).
- Gomaa, N. A., J. T. Rubinstein, M. W. Lowder, R. S. Tyler, and B. J. Gantz. 2003. “Residual Speech Perception and Cochlear Implant Performance in Postlingually Deafened Adults.” Ear and Hearing 24 (6): 539–544.
- Gubbels, S. P., B. C. Gartrell, J. L. Ploch, and K. D. Hanson. 2017. “Can Routine Office-Based Audiometry Predict Cochlear Implant Evaluation Results?” The Laryngoscope 127 (1): 216–222. doi:10.1002/lary.26066.
- Hoo, Z. H., J. Candlish, and D. Teare. 2017. “What is an ROC curve?” Emergency Medicine Journal 34 (6): 357–359. doi:10.1136/emermed-2017-206735.
- Hoppe, U., A. Hast, and T. Hocke. 2015. “Audiometry-Based Screening Procedure for Cochlear Implant Candidacy.” Otology & Neurotology 36 (6): 1001–1005.
- Hughes, M. L., D. L. Neff, J. L. Simmons, and M. P. Moeller. 2014. “Performance Outcomes for Borderline Cochlear Implant Recipients with Substantial Preoperative Residual Hearing.” Otology & Neurotology 35 (8): 1373–1384. doi:10.1097/MAO.0000000000000367.
- Huinck, W. J., E. Mylanus, and A. Snik. 2019. “Expanding Unilateral Cochlear Implantation Criteria for Adults with Bilateral Acquired Severe Sensorineural Hearing Loss.” European Archives of Oto-Rhino-Laryngology 276 (5): 1313–1320. doi:10.1007/s00405-019-05358-z.
- Kraaijenga, V. J. C., A. L. Smit, I. Stegeman, J. J. M. Smilde, G. A. van Zanten, and W. Grolman. 2016. “Factors that Influence Outcomes in Cochlear Implantation in Adults, Based On Patient-Related Characteristics – A Retrospective Study.” Clinical Otolaryngology 41 (5): 585–592. doi:10.1111/coa.12571.
- Lasko, T. A., J. G. Bhagwat, K. H. Zou, and L. Ohno-Machado. 2005. “The Use of Receiver Operating Characteristic Curves in Biomedical Informatics.” Journal of Biomedical Informatics 38 (5): 404–415. doi:10.1016/j.jbi.2005.02.008.
- Lee, S. J., K. W. Park, L. S. Kim, and H. Kim. 2016. “Effects of Noise Level and Cognitive Function on Speech Perception in Normal Elderly and Elderly with Amnestic Mild Cognitive Impairment.” Cognitive and Behavioral Neurology 29 (2): 68–77. doi:10.1097/WNN.0000000000000092.
- Leigh, J. R., M. Moran, R. Hollow, and R. C. Dowell. 2016. “Evidence-Based Guidelines for Recommending Cochlear Implantation for Postlingually Deafened Adults.” International Journal of Audiology 55 (Suppl 2): S3–S8.
- Lovett, R. E. S., D. Vickers, and A. Q. Summerfield. 2015. “Bilateral Cochlear Implantation for Hearing-Impaired Children: Criterion of Candidacy Derived from an Observational Study.” Ear and Hearing 36 (1): 14–23.
- Madley-Dowd, P., R. Hughes, K. Tilling, and J. Heron. 2019. “The Proportion of Missing Data Should Not be Used to Guide Decisions on Multiple Imputation.” Journal of Clinical Epidemiology 110:63–73. doi:10.1016/j.jclinepi.2019.02.016.
- Maeda, Y., S. Takao, A. Sugaya, Y. Kataoka, S. Kariya, S. Tanaka, R. Nagayasu, A. Nakagawa, and K. Nishizaki. 2018. “Relationship Between Pure-Tone Audiogram Findings and Speech Perception Among Older Japanese Persons.” Acta Oto-Laryngologica 138 (2): 140–144. doi:10.1080/00016489.2017.1378435.
- McRackan, T. R., J. E. Fabie, J. A. Burton, S. Munawar, M. A. Holcomb, and J. R. Dubno. 2018. “Earphone and Aided Word Recognition Differences in Cochlear Implant Candidates.” Otology & Neurotology 39 (7): e543–e549. doi:10.1097/MAO.0000000000001873.
- National Institute for Health and Clinical Excellence. 2009. “Cochlear Implants for Children and Adults with Severe to Profound Deafness.” (January 2009), pp.1–41.
- National Institute for Health and Clinical Excellence. 2019. “Cochlear Implants for Children and Adults with Severe to Profound Deafness.” NICE Technology Appraisal Guidance, (January 2009), pp.1–41. Accessed at: https://www.nice.org.uk/guidance/TA566.
- Netten, A. P., F. W. Dekker, C. Rieffe, W. Soede, J. J. Briaire, and J. H. M. Frijns. 2017. “Missing Data in the Field of Otorhinolaryngology and Head & Neck Surgery.” Ear and Hearing 38 (1): 1–6.
- Obuchowski, N. A. 2005. “ROC Analysis.” American Journal of Roentgenology 184 (2): 364–372. doi:10.2214/ajr.184.2.01840364.
- Obuchowski, N. A, and J. A. Bullen. 2018. “Receiver Operating Characteristic (ROC) Curves: Review of Methods with Applications in Diagnostic Medicine.” Physics in Medicine and Biology 63 (7): 07TR01. doi:10.1088/1361-6560/aab4b1.
- Peterson, N. R., D. B. Pisoni, and R. T. Miyamoto. 2010. “Cochlear Implants and Spoken Language Processing Abilities: Review and Assessment of the Literature.” Restorative Neurology and Neuroscience 28 (2):237–250. doi:10.3233/RNN-2010-0535.
- De Raeve, L, and A. Wouters. 2013. “Accessibility to Cochlear Implants in Belgium: State of The Art on Selection, Reimbursement, Habilitation, and Outcomes in Children and Adults.” Cochlear Implants International 14 (sup1): S18–S25. doi:10.1179/1467010013Z.00000000078.
- Reddy, P., Dornhoffer, J. R., Camposeo, E. L., Dubno, J. R., and McRackan, T. R. 2022. “Using Clinical Audiologic Measures to Determine Cochlear Implant Candidacy.” Audiology and Neurotology 27 (3): 235–242. doi:10.1159/000520077.
- Rubinstein, J. T., W. S. Parkinson, R. S. Tyler, and B. J. Gantz. 1999. “Residual Speech Recognition and Cochlear Implant Performance: Effects of Implantation Criteria.” The American Journal of Otology 20 (4): 445–452.
- Schafer, J. L, and J. W. Graham. 2002. “Missing Data: Our View of the State of The Art.” Psychological Methods 7 (2): 147–177. doi:10.1037/1082-989X.7.2.147.
- Snel-Bongers, J., A. P. Netten, P.-P B. M. Boermans, L. J. C. Rotteveel, J. J. Briaire, and J. H. M. Frijns. 2018. “Evidence-Based Inclusion Criteria for Cochlear Implantation in Patients With Postlingual Deafness.” Ear and Hearing 39 (5): 1008–1014.
- Sterne, J. A. C., I. R. White, J. B. Carlin, M. Spratt, P. Royston, M. G. Kenward, A. M. Wood, and J. R. Carpenter. 2009. “Multiple Imputation for Missing Data in Epidemiological and Clinical Research: Potential and Pitfalls.” BMJ 338:b2393. doi:10.1136/bmj.b2393.
- van der Straaten, T. F. K., J. J. Briaire, D. Vickers, P. Boermans, and J. H. M. Frijns. 2021. “Selection Criteria for Cochlear Implantation in the United Kingdom and Flanders.” Ear and Hearing 42 (1): 68–75. doi:10.1097/AUD.0000000000000901.
- Verhaegen, V. J. O., E. A. M. Mylanus, C. Cremers, and A. F. M. Snik. 2008. “Audiological Application Criteria for Implantable Hearing Aid Devices: A Clinical Experience at the Nijmegen ORL Clinic.” The Laryngoscope 118 (9): 1645–1649.
- Vickers, D., L. De Raeve, and J. Graham. 2016. “International Survey of Cochlear Implant Candidacy.” Cochlear Implants International 17 (Suppl 1): 36–41.
- Vickers, D. A., A. Riley, R. Ricaud, C. Verschuur, S. Cooper, T. Nunn, K. Webb, J. Muff, F. Harris, M. Chung, et al. 2016. “Preliminary Assessment of the Feasibility of Using AB Words to Assess Candidacy in Adults.” Cochlear Implants International 17 (Suppl 1): 17–21.