
 ?Mathematical formulae have been encoded as MathML and are displayed in this HTML version using MathJax in order to improve their display. Uncheck the box to turn MathJax off. This feature requires Javascript. Click on a formula to zoom.
Abstract
Objective
Hyperacusis is reported to occur in 3.2–17.1% of the general paediatric population with higher rates in clinical populations such as autism spectrum disorders (ASD). Although hyperacusis is a relatively common form of decreased sound tolerance (DST), no valid paediatric hyperacusis measures are currently available. The purpose of the present study was to develop and validate a paediatric version of the Khalfa Hyperacusis Questionnaire (HQ) as a first step towards filling this measurement gap.
Design
A cross-sectional design was used to evaluate therapist opinions of the paediatric version (P-HQ) and to field test the P-HQ in parents of children with and without ASD. Total scores were compared between ASD and non-ASD groups.
Study sample
Eleven paediatric occupational and speech therapists with expertise in ASD, 64 parents of children with ASD and 37 parents of children without ASD completed online questionnaires. Psychometric analyses were conducted.
Results
A unidimensional construct was found underlying P-HQ and all items displayed sufficient theoretical relevance to hyperacusis and adequate psychometric properties.
Conclusions
The P-HQ demonstrates good internal consistency and shows promise as a potential screening tool for identifying DST in ASD. Further research is warranted to establish normative data and validate cut-off scores.
Keywords:
Introduction
Children with decreased sound tolerance (DST) may perceive everyday sounds as loud, unpleasant, frightening or painful, causing them to avoid certain situations or environments (Amir, Lamerton, and Montague Citation2018). DST, also referred to as auditory sensory over-responsivity, broadly describes difficulties tolerating auditory stimuli, but can include two discrete conditions: hyperacusis and misophonia, with a third condition, phonophobia, often described as a subtype of misophonia (Jastreboff and Jastreboff Citation2015). Each of these conditions is characterised by an aversion to sounds which would not provoke distress/discomfort in an average listener but can be distinguished from one another via subtle differences. For instance, hyperacusis is described as the intolerance of certain everyday sounds that causes significant distress and impairment in day-to-day activities (Aazh et al. Citation2018). Sounds may be perceived as uncomfortably loud, unpleasant, frightening, or painful (Pienkowski et al. Citation2014). Misophonia, on the other hand, can be defined as a disorder of decreased tolerance to specific sounds or “triggers,” which elicit strong negative emotional, physiological, and behavioural responses (Swedo et al. Citation2021). Phonophobia is characterised by sound-based anxiety and avoidance of sound, which is generally considered within the classification of misophonia but can also develop in isolation (Jastreboff and Jastreboff Citation2015).
When considering DST in the paediatric population, autism spectrum disorder (ASD) is one subpopulation with a particularly high prevalence of hyperacusis and misophonia,. ASD is a developmental disability characterised by difficulties with social communication and interaction, as well as repetitive behaviours and restricted interests (American Psychiatric Association, Citation2013). DST symptoms are commonly reported by parents/caregivers of individuals with ASD with an estimated current prevalence of 60.1% (Carson et al. Citation2022). By comparison, these estimated prevalence rates in ASD are notably higher than that of the general paediatric population, which range from 3.2% to 17.1% (Rosing et al. Citation2016). DST can negatively impact the daily lives of children and their families resulting from avoidance behaviours and increased stress, fear and anxiety as well as disruptions in daily routines (Ben‐Sasson et al. Citation2013; Schaaf et al. Citation2011; Scheerer et al. Citation2021). At present, it is unclear whether the DST described in ASD is specific to hyperacusis, misophonia and/or phonophobia or a combination thereof (Williams, He, et al. Citation2021). Given the high prevalence of DST in ASD and the implications it has for children’s quality of life, it is essential for audiologists, psychologists, occupational therapists (OTs), speech-language pathologists (SLPs), and other allied health professionals who work with autistics to have valid, reliable tools that support proper evaluation and treatment of DST conditions.
Currently misophonia and hyperacusis are identified by audiology and medical professionals with information collected through clinical observation, clinical interviews and self-report questionnaires (Aazh, Danesh, and Moore Citation2021; Greenberg and Carlos Citation2018; Khalfa et al. Citation2002; Potgieter et al. Citation2019; Siepsiak, Śliwerski, and Dragan Citation2020). While these questionnaires have been validated in adult populations, they have not yet been studied in paediatric populations. In paediatrics, current methodologies for interviews and questionnaires are primarily ad-hoc, unvalidated measures, often comprised of single items (Rosing et al. Citation2016; Williams, He, et al. Citation2021; Williams, Suzman, et al. Citation2021). Although loudness discomfort levels (LDL) testing has also long been viewed as a useful method for identifying hyperacusis, testing protocols may vary (Aazh and Moore Citation2017; Aazh et al. Citation2018) and this test is not widely accessible to professions outside of audiology such as psychologists, psychiatrists, OTs, or SLPs who also receive referrals to evaluate and treat DST in ASD. Recently, two new psychoacoustic assessments have also been developed for adults with misophonia and hyperacusis, respectively (Enzler, Loriot, et al. Citation2021; Enzler, Fournier, et al. Citation2021). These assessments measure the reaction to potentially bothersome auditory stimuli in real time, rather than relying on the patient recalling past events or others’ reports of their observations. Real time measures of responses to stimuli may provide valuable insight into treatment outcomes and the lived experience of those with these disorders. These psyschoacoustic assessments demonstrate adequate performance with classification accuracy among adults; however, they have not yet been studied in paediatrics. Although several sensory processing parent-report measures are available, none to date include specific subscales for misophonia or hyperacusis. Thus, it is necessary to develop reliable, valid measures for allied health professionals to screen for these conditions in paediatrics.
To begin addressing this measurement gap in paediatrics, this paper focuses on the development and validation of a paediatric parent-report questionnaire for identifying hyperacusis. While valid questionnaires for hyperacusis are lacking in paediatrics, they do exist for adults. The Hyperacusis Questionnaire (HQ), a 14-item, self-report measure of hyperacusis (HQ; Khalfa et al. Citation2002), is the most frequently used hyperacusis measure for research purposes and has been validated for adult populations in several different languages (Bastos and Sanchez Citation2017; Oishi et al. Citation2017; Tortorella et al. Citation2017; Yamada et al. Citation2022). Khalfa et al. (Citation2002) define hyperacusis as discomfort caused by sounds that are acceptable to people with normal hearing. The maximum score is 42 and a cut-off score of 28 is recommended as indicative of auditory hypersensitivity (Khalfa et al. Citation2002), although some researchers have suggested alternative cut-off scores be used to improve identification (Fackrell et al. Citation2015; Meeus et al. Citation2010). Because the HQ is a valid and reliable measure for identifying hyperacusis in adults, it serves as the basis for the current study. Despite the HQ’s utility in diagnosing adults, several HQ items may not be well suited for paediatric patients and it has not been validated for paediatrics. Khalfa et al. (Citation2002) described hyperacusis as a subjective phenomenon that is not easily defined or quantified by objective measurements; consequently, there are currently no gold standard methods for identifying hyperacusis in adults or paediatrics. At present, the HQ paired with ULLs are the highest standard for diagnostic assessment in adults, therefore, it is reasonable to suspect these methods can be useful and valid for paediatrics. However, this has not been directly studied.
As a first step towards improving evaluation tools for DST in paediatrics, the primary objective of the current study is to develop a paediatric parent-report version of the HQ (referred to as P-HQ hereinafter), and further to document preliminary evidence of its validity based on the content and internal structure as well as related psychometric characteristics. As a secondary aim, this study also evaluates the practicality of such an instrument for identifying hyperacusis in autistic children, which is a high-prevalence population for hyperacusis.
Methods
This study was completed in three phases as follows: (1) transformation of items from self-report (HQ) to parent-report (P-HQ), (2) qualitative review of theoretical relevance and acceptability of P-HQ items, and (3) field testing and evaluating the psychometric properties of the P-HQ.
Phase I: Content development of P-HQ
The P-HQ was developed by selecting items that are relevant to hyperacusis according to existing validation studies of the original HQ (Khalfa et al. Citation2002, Copyright © 2012 Karger Publishers, Basel, Switzerland). Then, selected items were modified to make them appropriate for children.
Item and rating scale reduction
Based on previous psychometric studies of the HQ in adults (Fackrell et al. Citation2015; Oishi et al. Citation2017; Yamada et al. Citation2022), four items presented weak associations with the other items of HQ as follows: item 1 “Do you ever use earplugs or earmuffs to reduce your noise perception?,” item 5 “Do you have difficulty listening to conversations in noisy places?,” item 6 “Has anyone you know ever told you that you tolerate noise or certain kinds of sound badly?,” and item 11 “Do noises or particular sounds bother you more in a quiet place than in a slightly noisy room?” (Khalfa et al. Citation2002, 441). Accordingly, items 5 and 11 were omitted from the P-HQ given the congruence of findings regarding the relevance of both items to hyperacusis. However, items 1 and 6 were retained in the initial draft of P-HQ because of their potential importance for measuring factors related to DST features of ASD among children. Specifically, for item 1, children with ASD often use noise cancelling headphones or earmuffs to engage in certain activities or settings. Item 6 was retained to capture observations of others that may help compensate for any lack of insight or self-awareness of a DST problem. Removal of items 5 and 11 resulted in a 12-item questionnaire (see online supplement Figure S1).
Transformation of the HQ items from self-report to parent-report
Based on the 12 items selected from the original HQ, minor modifications were made to convert the question format from self-report questions aimed at collecting information directly from adults to parent-report questions for collecting data on children. For example, Do you have trouble concentrating in noisy surroundings? became Does your child have trouble concentrating in noisy surroundings? Two items were additionally modified to replace adult contextual examples with those that are relevant to paediatric populations. For instance, examples of bothersome stimuli such as “night clubs, pubs or bars” (Khalfa et al. Citation2002, 441), were modified to relevant examples for children including birthday parties, concerts, dances, etc. Further, the rating scale was simplified from four (No = 0 points; Yes, a little = 1 point; Yes, quite a lot = 2 points; and Yes, a lot = 3 points) to three choices (No = 0 points; Sometimes = 1 point; Yes = 2 points) for exploration.
Phase 2: review of theoretical relevance and acceptability of P-HQ items
Participants: therapists
A panel of therapists (n = 11) with ASD expertise was recruited to evaluate the theoretical relevance of P-HQ items to DST observed in the ASD population. To be included in the study, participants were required to (a) be registered licenced therapists, and (b) have experience working with children with ASD. Therapists were known to the researchers and were invited to participate in the study based on their expertise. The sample included nine occupational therapists and two speech-language pathologists who were all females with an average of 10.73 years of clinical expertise working with individuals with ASD. Therapists’ ages ranged from 25 to 60 with an average age of 36.
Therapist questionnaire
Therapists were presented an online survey asking them to rate the theoretical relevance of each item of the P-HQ to children with ASD on a 5-point Likert scale where “Essential” = 5 and “Not relevant” = 1. To evaluate acceptability, therapists were also asked to rate their agreement with statements regarding the clarity of instructions, the usefulness of the P-HQ for monitoring treatment outcomes, whether they would use the P-HQ in practice and whether they would recommend the P-HQ to colleagues. Acceptability questions were also rated on a 5-point Likert scale where “Strongly agree” = 5 and “Strongly Disagree” = 1. The final item on the survey gave therapists the option to provide narrative feedback about their responses (i.e. If you disagreed with any of these statements or have additional comments/suggestions, please provide additional information in the space below.).
Data analysis for therapist questionnaire
The theoretical relevance of P-HQ items to children with ASD was evaluated using descriptive statistics to report the frequency and percent of relevance ratings from therapists. Similarly, acceptability was evaluated using descriptive statistics to report the frequency and percent of acceptability ratings. Qualitative data generated by the open-ended survey item were investigated using text analysis methods (Kuckartz Citation2014).
Phase 3: field testing of P-HQ
In this validation phase, we distributed P-HQ among sampled parents and evaluated the psychometric characteristics of P-HQ items based on their responses. Then, we derived a cut-off score for the P-HQ. We further collected evidence on acceptability of P-HQ items from parents of children with and without ASD.
Participants: parents
The P-HQ was field tested in a group of 101 parents including n = 64 parents of children with ASD and n = 37 parents of children without ASD. Parents were included in the ASD group if they self-reported that a medical professional diagnosed their child with any of the following: autism, ASD, pervasive developmental disorder—not otherwise specified (PDD-NOS), or Asperger’s Syndrome. Parents were included in the non-ASD group if they self-reported that their child did not have a diagnosis of any of the ASD diagnoses above. Parents of children with ASD were not known to the researchers and were recruited through social media posts in parent support groups, through university-based autism centres in South Florida, in-person at outdoor public areas, by word of mouth, and through email distributions via clinics and community organisations. For both groups, parents were included if they were age 18 or over, were able to read in English, and if their child was age 2–17 years (child ages: M = 8.90, SD = 3.09). Based on these criteria, parent-report was collected for 53 (53%) boys, 47 (47%) girls. Only one parent did not report child sex ().
Table 1. Demographic information provided by parents in phase 3: field testing.
Parent questionnaire
Parents were presented the P-HQ in English via an online survey. They were asked to rate each of the 12 P-HQ items on a three-point Likert rating scale where “No” = 0, “Sometimes” = 1, and “Yes” = 2. To evaluate acceptability of the P-HQ, parents were also asked to rate their agreement with four statements regarding the clarity of instructions, whether they would recommend this questionnaire to another parent with concerns about DST and thoroughness of P-HQ items. Acceptability questions were rated on a five-point Likert scale where “Strongly agree” = 5 and “Strongly Disagree” = 1 (Supplement, Table S1). Parents were recruited across two studies over the course of two years. In year one, the survey did not include acceptability questions; whereas these questions were included in year two. As such, the sample for acceptability data is smaller than the overall sample.
Data analysis for field testing
Psychometric properties of the P-HQ were evaluated as follows: internal structure, item analysis and differential item functioning. These, according to the Standards of Educational and Psychological Testing (AERA, APA, and NCME Citation2014), correspond to validity evidence based on internal structure. Additionally, a preliminary cut-off score was identified, and group comparisons were made.
Internal structure of P-HQ
In order to examine the hypothetical construct underlying P-HQ, we conducted a confirmatory factor analysis (CFA) where all the 12 items of P-HQ were specified loading onto one common factor. The following indexes and cut-offs were used to assess model fit (Kline, Citation2016): the test statistic, root mean square error of approximation (RMSEA
), comparative fit index (CFI
), and Tucker-Lewis index (TLI
). Mplus version 8.4 (Muthén and Muthén Citation2017) was used to perform this analysis, and weighted least square with adjusted mean and variance (WLSMV) was adopted given the categorical nature of the response data. We also reviewed modification indexes (MI) for potential model respecifications (Kenny Citation2011).
Item analysis
As indicated in the scale development section, the items of P-HQ share the same pattern of rating points (No = 0, Sometimes = 1, Yes = 2). This reflects our thoughts that the relative difficulties of endorsing a particular response category over the preceding the category are the same across items (Embretson and Reise Citation2013; Wright and Masters Citation1982). Hence, we applied the rating scale model (RSM; Andrich Citation1978) to assess item quality. In RSM, the probability of individual endorsing category
of item
is defined as
where
is the latent trait that a scale is designed to measure,
is the location parameter of an item, and
is the threshold parameter that marks the intersection of the category response curves of two adjacent categories (i.e. category intersection parameter in Embretson and Reise Citation2013). Given there are three response categories of each item in P-HQ, the number of thresholds to estimate equals two.
After fitting the RSM, we used INFIT and OUTFIT statistics to quantify any data-model discrepancies. According to (Wright and Masters (Citation1982), INFIT is computed as the weighted mean squared residuals and is sensitive to response patterns of items whose difficulties are close to persons’ abilities (Jafari et al. Citation2012; Linacre Citation2002), whereas OUTFIT is the unweighted mean squared residuals and is sensitive to surprising responses (Linacre Citation2002). Values of INFIT and OUTFIT vary from zero to infinity where one indicates adequate fit (Wright and Linacre Citation1994). As recommended (Linacre Citation2002), INFIT and OUTFIT between 0.5 and 1.5 are considered acceptable.
In addition, a Wright map was used to examine whether response categories follow a successive order as designed and how items map onto the spectrum of the measured trait. We also calculated item and person reliability. The related item analyses were conducted in R 4.0.3 (R Core Team Citation2020) using the eRm package (Mair, Hatzinger, and Maier Citation2020).
Differential item functioning
Based on the measurement model established from the step of validating internal structure, we further examined potential statistical bias due to group membership for ASD and non-ASD groups. Conceptually, in the framework of differential item functioning (DIF), for individuals on the same level of the measured trait, the probability of endorsing an item should not be a function of their group membership. When DIF presents, it implies individuals’ performance on an item depends not only on the latent trait but also on the group they belong to. The latter would then introduce systematic difference to their performance.
In this study, we used the multiple indicators multiple causes model (MIMIC), which has been demonstrated in simulation studies for efficiency to assess item level DIF (Chun et al. Citation2016; Finch Citation2005; Jin et al. Citation2013). Following the existing literature (Finch Citation2005), based on the measurement model we specified the MIMIC model by introducing direct paths from the grouping variable (ASD/non-ASD) to items of P-HQ and the latent factor. For model identification purpose, no path was specified for item 1 on the grouping variable. We used the MIMIC approach to assess this particular item individually prior to the investigation for the other items, and no DIF was detected for item 1. From the MIMIC model, an item will be flagged for DIF if there is statistically significant direct effect of the grouping variable on this particular item. To avoid the potential increase in type I error rate due to the multiple testing of the 10 items, we adjusted the p-value using Bonferroni adjustment (). Correspondingly, statistical significance was determined if
Cut-off score and group comparison
Given that hyperacusis symptoms are reported higher in ASD group (Rosenhall et al. Citation1999; Tomchek and Dunn Citation2007), a preliminary clinical cut-off was determined as the score that was defined as two standard deviations above the non-ASD mean. A similar approach also was used in Khalfa et al. (Citation2002) to determine a cut-off score for the HQ. Further, an independent samples t-test was used to compare mean differences in P-HQ scores between ASD and non-ASD groups.
Results
Phase 2: review of theoretical relevance and acceptability of P-HQ items
Theoretical relevance of P-HQ items
Therapists rated P-HQ items on a 5-point Likert scale ranging from “Not relevant” (1) to “Essential” (5) to identifying DST in ASD. Summary statistics for each P-HQ item are included in . Average ratings for each item varied from 3.91 to 4.64. Across all items, the average rating of therapists was 4.39 (SD = 0.72), meaning that on average, items were rated as between “Essential” (5) and “Important” (4) to ASD. Only three items were rated as “Relevant” (3) and no items were rated “Somewhat relevant” (2) or “Not relevant” (1).
Table 2. Summary of the paediatric version of the hyperacusis questionnaire (P-HQ) items and therapist ratings of item relevance to ASD (1 = not relevant to 5 = essential).
Acceptability
Therapists and parents reported on the acceptability of the questionnaire as shown in Table S1 (Supplement). The average rating ranged from 4.27 to 4.91 for the therapist group and from 4.19 to 4.36 for the parent group, which suggested that participants of both groups at least agreed with the statements regarding the usefulness, clarity, and relevance to their children’s difficulties with DST of the P-HQ.
Clinician qualitative feedback
A total of four comments were provided by therapists regarding the wording of specific P-HQ items when considering the autistic population. Two comments were specific to the item: Does your child have difficultly reading in a noisy or loud environment? One participant commented that “[reading] may not apply to lower functioning children with autism [whereas], using tablet, reading, etc. may be more relevant.” Another suggested that “we need to be mindful that not all of the children are able to read even at late ages- maybe reword [this item] to include having books read to them. Literacy experiences might not be something they tolerate.” One comment was specific to the item: Does your child ever use ear plugs or earmuffs to reduce his/her noise perception? For this item, the clinician recommended also asking if “your child has been recommended [to use] ear plugs or earmuffs?” Lastly, one comment was specific to the question: Does your child find the noise unpleasant in certain social situations (e.g. birthday parties, concerts/dances, firework displays)? The clinician suggested “there are big differences among the examples given” such that “the child’s reactions may be different for each.” At the end of the survey, four therapists provided comments to suggest additional questions or instrument features for consideration in future versions of the P-HQ as follows:
“Add a comments section for parents to include additional information about exactly what sounds and contexts are considered triggers.”
“Does your child ever [have] a tantrum episode triggered by a sudden or loud noise that requires more than a few minutes to calm down from?”
“Does your child ever exhibit violent/aggressive behaviors when triggered by a loud or sudden noise?”
“Does your child make repetitive noises or sounds such as humming, grinding teeth, singing to block out bothersome sounds?”
Therapists were not given the opportunity to discuss and form a consensus on their suggestions for revisions. Therefore, these data were not used to make changes to the questionnaire items prior to field testing.
Phase 3: field testing of P-HQ
Psychometric properties
Measurement construct of P-HQ
According to the results of CFA (See Online Supplement, Table S2), the initial one-factor measurement model did not show adequate fit to the data (
RMSEA = .094, CFI = .975, TLI = .969). After reviewing the MIs, we found that the residual correlation between items 6 and 7 corresponded to a noticeable value (MI = 47.991), which empirically suggests there is considerable amount of variance between both items even after controlling for the common factor (hyperacusis). That is, an indication of violation of the local independence assumption of RSM. Hence, instead of simply introducing a path between items 6 and 7, we examined the item correlation and also revisited item contents. Accordingly, the correlation between items 6 and 7 was very strong (
), and the contents of both items are close too (item 6 = “When someone suggests doing something (going out to the movie theater, to a concert, parade, etc.), do you or your child immediately think about the noise he/she is going to have to put up with?,” item 7 = “Does your child ever turn down an invitation or participate in an activity of the noise he/she would have to face?”). Consequently, we decided to remove item 6 from the initial measurement model, and fit a revised model with 11 items. As shown in supplemental Table S2, this revised measurement model fitted adequately (
RMSEA = .027, CFI = .998, TLI = .997). Further, from all items presented high loadings ranging from .698 to 907, which implies a strong association between the items and the on the factor (PHQ) they designed to measure. The subsequent analyses were based on this model structure. Details of item correlation and usage of response options are presented in supplemental Table S3.
Table 3. Summary of item fit information, parameter estimates, results of DIF and standardised factor loadings from final measurement model.
Item characteristics of P-HQ
Results of RSM are included in . Accordingly, the INFIT statistics varied from 0.675 to 1.324 and the values of OUTFIT ranged in-between 0.535 and 1.175. No items presented infit or outfit statistics exceeding the range of 0.5–1.5, suggesting acceptable item level fit. As shown in the third panel of , estimates of the location parameter ranged from −0.564 to 1.778 indicating reasonable relative difficulties of the P-HQ items. No items presented questionable (extremely easy or hard) estimates on item difficulties. We also included a Wright map to depict the relative position of PHQ items against the person estimates of PHQ trait (see online supplement Figure S2). As shown, the current collection of items provided a well coverage for individuals whose PHQ levels are within the range of −1 and 2. Additionally, this Wright map also suggests the addition of items with a relative difficulty between 0.5 and 1.0 in order to precisely measure individual with a PHQ level with in this range. In addition, the person separation index was 0.895, indicating adequate reliability. Item and test information functions are given in Online Supplement Figure S3.
Differential item functioning
The far-right panel of contains the results of DIF analysis based on MIMIC. As shown, no items corresponded to an observed p-value exceeding the adjusted level of significance (), which suggests a lack of item-level statistical bias. It is worth noting that DIF analysis cannot be perform on item 7, because there was not variability in the response data for the non-ASD group (i.e. all individuals in the non-ASD group selected ‘No’ on this item).
Cut-off score and group comparison
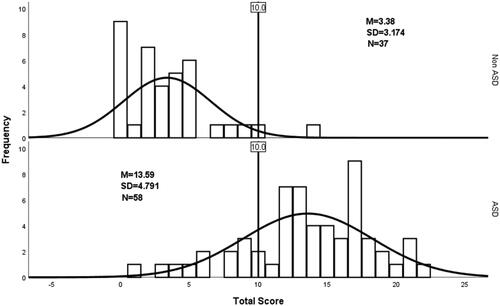
The cut-off score for non-ASD and ASD groups is visualised in . As shown, based on the score distribution of children in non-ASD group, the score that corresponds to two standard deviations above the mean was about 10 (). Hence, a clinical cut-off score of 10 on P-HQ was determined. Correspondingly, for children in ASD group, this cut-off score lies nearly one standard deviation below the average. Using a cut-off of > 10, there are 47 (81.03%) children with ASD with hyperacusis, whereas, this indicates only one (2.70%) child with hyperacusis for the non-ASD group. It is worth noting that only the children with complete P-HQ responses were included in this analysis, which led to a final sample of 95 children with five were excluded due to missing responses. Further, from the independent samples t-test, the assumption of homogeneity of variance was not satisfied and we reported the adjusted t-statistic (t(93)=12.645, p<.001). Accordingly, there was statistically significant difference in the mean P-HQ scores between the ASD and non-ASD groups.
Figure 1. Distributions of total scores of P-HQ questionnaire for non-ASD and ASD groups.
Discussion
The current study represents a first step towards a much-needed parent-report for identifying hyperacusis in paediatric populations. Additionally, this gap in our clinical instruments and empirical research within the paediatric population must be addressed to improve identification and treatment of the highly prevalent, yet poorly understood phenomenon of DST in the ASD paediatric population. Thus, the aim of this study was to develop a parent report version of the Khalfa HQ to identify hyperacusis in paediatrics, and further to collect preliminary validity evidence of this measure. An additional aim of the study was to begin to evaluate the usefulness of such an instrument for measuring hyperacusis in children with ASD who have a high prevalence of DST, broadly defined.
The resulting paediatric hyperacusis questionnaire (P-HQ) included 11 items modified from the original version that are suspected to be specific to hyperacusis and were deemed by therapists as acceptable for evaluating the DST features of children with ASD. Results of the psychometric analyses suggested adequate measurement properties of P-HQ and a lack of DIF (i.e. statistical bias) at the item level. Further, the chosen cut-off score presented efficient distinction between clinical and non-clinical groups (i.e. ASD with complaints of DST compared to non-ASD without complaints of DST). Based on these findings, a preliminary cut-off score of 10 or above has been identified for further evaluation in future studies. Collectively, therapists and parents report good agreement with statements regarding their satisfaction and acceptability of the P-HQ instrument. Therapists ‘agree’ to ‘strongly agree’ that they would use this in clinical practice, recommend it to a colleague and that this instrument would improve their ability to monitor treatment outcomes and progress.
This instrument should be further investigated in a larger sample to establish normative data and to test the suggested cut-off score. Through standardised, validated, norm-referenced assessments, practitioners can use the results to create individualised interventions that are tailored towards each client’s specific needs. Such an instrument would also be important for monitoring treatment outcomes in clinical research on hyperacusis in both the ASD and non-ASD paediatric populations. Further research should also be aimed at using the P-HQ to establish diagnostic severity levels as well as the prevalence of hyperacusis in a larger sample of both autistic and general paediatric populations. For the ASD population, although it was reasonable to start with a parent-report measure, considering varied communication abilities across the autism spectrum, future studies should also focus efforts on developing a complementary self-report version of DST instruments for use throughout paediatrics, including ASD.
Limitations
As mentioned above, this study is an exploratory extension of the Khalfa HQ to paediatric population and is a preliminary validation of the P-HQ. Therefore, the following limitations are highlighted and potential future research is discussed:
First, the composition of the sample for psychometric analysis (
and derivation of the cut-off score (
does not necessarily reflect the actual prevalence of ASD in paediatric population. Hence, we encourage future research to evaluate the psychometric properties of P-HQ and the efficacy of the cut-off score by incorporating a sample that is either representative of the general paediatric population (e.g. national norms) or aligned to their local needs (e.g. local norms).
Second, size of the sample for psychometric analysis is relatively small (). According to some historical research, although, such a sample fits right to the minimum recommended size for CFA (Kline Citation1994) and RSM (Chen et al. Citation2014) there are still additional factors such as communality among items (Mundfrom, Shaw, and Ke Citation2005) and missing responses that could potentially intertwine with sample size, which in turn compromises the accuracy of model results. Further, due to this constraint on sample size, the statistical power to detect item-level DIF is likely to be compromised (i.e. an increased Type II error rate). As a result, a true DIF item is more likely to be marked as DIF free. Hence, we strongly encourage future studies that expand the sample size and validate this measure at a larger scale.
Third, the current study was limited to a sample of female speech and occupational therapists and a sample of parents who have predominantly white and Hispanic/Latino children (via parent-report). Given the homogeneity of the sample, the feedback provided on item content may not be reflective of other cultural experiences and contexts that may be relevant to hyperacusis. Hence, future validation studies should focus on obtaining feedback from experts with a different professional background such as audiology and psychology. Also, children from diverse social and cultural groups (based on parent-report) should be included in future validation, which will facilitate the identification of the relevance and acceptability of P-HQ items. Furthermore, considering that additional paediatric disorders (e.g. ADHD, anxiety, Williams Syndrome, intellectual disability) are also associated with hyperacusis (Amir, Lamerton, and Montague Citation2018; Gothelf et al. Citation2006), the P-HQ should be assessed across diagnostic groups beyond ASD to determine whether it is appropriate for use (and functions equivalently) across different clinical conditions.
Fourth, we only collected two types of validity evidence: content and internal structure. However, according to the Standards (AERA, APA, and NCME Citation2014), to the extent that is relevant, validity evidence based on response process, relation to external variables, and consequences is also critical to support the intended interpretation and use of a measure. For future validation of P-HQ, focus group interviews can be organised to follow up with the parents on their ratings on the practical relevance of circumstances described in P-HQ items, clarity, and potential ways to improve. From this process, evidence based on response process can be documented. For the relation of P-HQ scores to external variables such as convergent, divergent, concurrent, and predictive, this should be planned according to the specific research design. For instance, research efforts could be devoted to studying the association between P-HQ scores and a well-established measure of hyperacusis among children in order to document this type of validity evidence. As for the validity evidence based on consequences, researchers may incorporate P-HQ into evaluation studies that involve measures of hyperacusis among children (e.g. a study that evaluates the efficacy of treatment that aims at improving hyperacusis). From such a study, the direct impact as well as the long-term social consequences due to the use P-HQ scores can be investigated. In addition to validity, reliability is another indicator of a psychometrically sound measure. Given the intended use of P-HQ to differentiating children based on their DST conditions (hyperacusis or non-hyperacusis), it becomes critical to examine the extent to which P-HQ provides an accurate classification of children. Also, in circumstances where children are measured at multiple occasions, test-retest reliability (or longitudinal measurement-invariance) ought to be established.
Conclusion
The results demonstrate evidence of the P-HQ’s content validity for identifying DST in the paediatric population. The analyses from this study demonstrate that the P-HQ is able to differentiate clinical and non-clinical groups. Along with this, the findings agree with the high prevalence rates of DST previously reported in autistic children (Carson et al. Citation2022). The questionnaire is brief and well accepted by therapists and parents in this study. Future research is warranted to establish normative data in a demographically representative sample and further test the sensitivity and specificity of this instrument.
Author’s note
For those interested in obtaining a copy of the questionnaire for research purposes, please contact the corresponding author.
Supplemental Material
Download MS Word (210.9 KB)Acknowledgements
The authors would like to thank Daniella Bendixen, M.S., OTR/L, Rachel Kasliner, M.S., OTR/L, and Teresa Montalvan, M.S., OTR/L for their assistance with recruitment, data collection and preliminary analysis.
Disclosure statement
No potential conflict of interest was reported by the author(s).
Data availability statement
The data that support the findings of this study are available from the corresponding author, [TBC], upon reasonable request.
References
- Aazh, H., A. A. Danesh, and B. Moore. 2021. “Internal Consistency and Convergent Validity of the Inventory of Hyperacusis Symptoms.” Ear and Hearing 42 : 917–926. doi:10.17863/CAM.62080.
- Aazh, H., M. Knipper, A. Danesh, A. Cavanna, L. Andersson, J. Paulin, M. Schecklmann, M. Heinonen-Guzejev, and B. Moore. 2018. “Insights From the Third International Conference on Hyperacusis: Causes, Evaluation, Diagnosis, and Treatment.” Noise & Health 20 (95): 162–170. doi:10.4103/nah.NAH_2_18.
- Aazh, H, and B. C. J. Moore. 2017. “Factors Related to Uncomfortable Loudness Levels for Patients Seen in a Tinnitus and Hyperacusis Clinic.” International Journal of Audiology 56 (10): 793–800. doi:10.1080/14992027.2017.1335888.
- AERA, APA, and NCME (American Educational Research Association, American Psychological Association, & National Council on Measurement in Education), eds. 2014. Standards for Educational and Psychological Testing. Washington, DC: American Educational Research Association.
- APA (American Psychiatric Association). 2013. Diagnostic and statistical manual of mental disorders: DSM-5. Washington, DC: American Psychiatric Association. doi:10.1176/appi.books.9780890425596.
- Amir, I., D. Lamerton, and M. Montague. 2018. “Hyperacusis in Children: The Edinburgh Experience.” International Journal of Pediatric Otorhinolaryngology 112 : 39–44. doi:10.1016/j.ijporl.2018.06.015.
- Andrich, D. 1978. “A Rating Formulation for Ordered Response Categories.” Psychometrika 43 (4): 561–573. doi:10.1007/BF02293814.
- Bastos, S., and T. G. Sanchez. 2017. "Validation of the Portuguese Version of Hyperacusis Questionnaire and Comparison of Diagnostic Skills with Loudness Discomfort Levels." Otolaryngology Research and Reviews 1 (1): 49–54. doi:10.36959/926/551.
- Ben‐Sasson, A., T. W. Soto, F. Martínez‐Pedraza, and A. S. Carter. 2013. “Early Sensory Over‐Responsivity in Toddlers With Autism Spectrum Disorders as a Predictor of Family Impairment and Parenting Stress.” Journal of Child Psychology and Psychiatry, and Allied Disciplines 54 (8): 846–853. doi:10.1111/jcpp.12035.
- Carson, T. B., M. J. Valente, B. J. Wilkes, and L. Richard. 2022. “Prevalence and Severity of Auditory Sensory Over-Responsivity in Autism as Reported by Parents and Caregivers.” Journal of Autism and Developmental Disorders 52 (3): 1395–1402. doi:10.1007/s10803-021-04991-0.
- Chen, W., W. Lenderking, Y. Jin, K. W. Wyrwich, H. Gelhorn, and D. A. Revicki. 2014. “Is Rasch Model Analysis Applicable in Small Sample Size Pilot Studies for Assessing Item Characteristics? An Example Using PROMIS Pain Behavior Item Bank Data.” Quality of Life Research : An International Journal of Quality of Life Aspects of Treatment, Care and Rehabilitation 23 (2): 485–493. doi:10.1007/s11136-013-0487-5.
- Chun, S., S. Stark, E. S. Kim, and O. S. Chernyshenko. 2016. “MIMIC Methods for Detecting DIF Among Multiple Groups: Exploring a New Sequential-Free Baseline Procedure.” Applied Psychological Measurement 40 (7): 486–499. doi:10.1177/0146621616659738.
- Embretson, S. E, and S. P. Reise. 2013. Item Response Theory. Hove: Psychology Press.
- Enzler, F., P. Fournier, and A. J. Noreña. 2021. “A Psychoacoustic Test for Diagnosing Hyperacusis Based on Ratings of Natural Sounds.” Hearing Research 400 : 108124. doi:10.1016/j.heares.2020.108124.
- Enzler, F., C. Loriot, P. Fournier, and A. J. Noreña. 2021. “A Psychoacoustic Test for Misophonia Assessment.” Scientific Reports 11 (1): 11044. doi:10.1038/s41598-021-90355-8.
- Fackrell, K., C. Fearnley, D. J. Hoare, and M. Sereda. 2015. “Hyperacusis Questionnaire as a Tool for Measuring Hypersensitivity to Sound in a Tinnitus Research Population.” BioMed Research International 2015 : 290425. doi:10.1155/2015/290425.
- Finch, H. 2005. “The MIMIC Model as a Method for Detecting DIF: Comparison With Mantel-Haenszel, SIBTEST, and the IRT Likelihood Ratio.” Applied Psychological Measurement 29 (4): 278–295. doi:10.1177/0146621605275728.
- Gothelf, D., N. Farber, E. Raveh, A. Apter, and J. Attias. 2006. “Hyperacusis in Williams Syndrome: Characteristics and Associated Neuroaudiologic Abnormalities.” Neurology 66 (3): 390–395. doi:10.1212/01.wnl.0000196643.35395.5f.
- Greenberg, B, and M. Carlos. 2018. “Psychometric Properties and Factor Structure of a New Scale to Measure Hyperacusis: Introducing the Inventory of Hyperacusis Symptoms.” Ear and Hearing 39 (5): 1025–1034. doi:10.1097/AUD.0000000000000583.
- Kuckartz, U. 2014. “Three Basic Methods of Qualitative Text Analysis.” Qualitative Text Analysis: A Guide to Methods, Practice & Using Software, 65. London: SAGE Publications Ltd. doi:10.4135/9781446288719.n4.
- Jafari, P., Z. Bagheri, S. M. T. Ayatollahi, and Z. Soltani. 2012. “Using Rasch Rating Scale Model to Reassess the Psychometric Properties of the Persian Version of the PedsQL TM 4.0 Generic Core Scales in School Children.” Health and Quality of Life Outcomes 10 (1): 1–11. doi:10.1186/1477-7525-10-27.
- Jastreboff, P. J, and M. M. Jastreboff. 2015. “Decreased Sound Tolerance: Hyperacusis, Misophonia, Diplacousis, and Polyacousis.” Handbook of Clinical Neurology 129 : 375–387. doi:10.1016/B978-0-444-62630-1.00021-4.
- Jin, Y., N. D. Myers, S. Ahn, and R. D. Penfield. 2013. “A Comparison of Uniform DIF Effect Size Estimators Under the MIMIC and Rasch Models.” Educational and Psychological Measurement 73 (2): 339–358. doi:10.1177/0013164412462705.
- Kenny, D. A. 2011. “Respecification of Latent Variable Models.” http://davidakenny.net/cm/respec.htm
- Khalfa, S., S. Dubal, E. Veuillet, F. Perez-Diaz, R. Jouvent, and L. Collet. 2002. “Psychometric Normalization of a Hyperacusis Questionnaire.” ORL; Journal for Oto-Rhino-Laryngology and Its Related Specialties 64 (6): 436–442. doi:10.1159/000067570.
- Kline, P. 1994. Anoe Easy Guide to Factor Analysis (1st publ. ed.). London: Routledge.
- Kline, R. B. 2016. Principles and Practice of Structural Equation Modeling (4th ed.). Guilford Press.
- Linacre, J. M. 2002. “What Do Infit and Outfit, Mean-Square and Standardized Mean?” Rasch Measurement Transactions 16 : 878. https://www.rasch.org/rmt/rmt162f.htm.
- Mair, P., R. Hatzinger, and M. J. Maier. 2020. eRm: Extended Rasch Modeling. R Package Version. 1.0–1. https://cran.r-project.org/package=eRm
- Meeus, O. M., M. Spaepen, M. Ridder, D. D. Heyning, and P. H. Van de. 2010. “Correlation Between Hyperacusis Measurements in Daily ENT Practice.” International Journal of Audiology 49 (1): 7–13. doi:10.3109/14992020903160868.
- Mundfrom, D. J., D. G. Shaw, and T. L. Ke. 2005. “Minimum Sample Size Recommendations for Conducting Factor Analyses.” International Journal of Testing 5 (2): 159–168. doi:10.1207/s15327574ijt0502_4.
- Muthén, L. K, and B. O. Muthén. 2017. Mplus User’s Guide. 8th ed. Los Angeles, CA: Muthén & Muthén.
- Oishi, N., H. Yamada, S. Kanzaki, A. Kurita, Y. Takiguchi, I. Yuge, Y. Asama, M. Masuda, and K. Ogawa. 2017. “Assessment of Hyperacusis With a Newly Produced Japanese Version of the Khalfa Hyperacusis Questionnaire.” Acta oto-laryngologica 137 (9): 957–961. doi:10.1080/00016489.2017.1306654.
- Pienkowski, M., R. S. Tyler, E. R. Roncancio, H. J. Jun, T. Brozoski, N. Dauman, C. B. Coelho, G. Andersson, A. J. Keiner, A. T. Cacace, et al. 2014. “A Review of Hyperacusis and Future Directions: Part II. Measurement, Mechanisms, and Treatment.” American Journal of Audiology 23 (4): 420–436. doi:10.1044/2014_AJA-13-0037.
- Potgieter, I., C. MacDonald, L. Partridge, R. Cima, J. Sheldrake, and D. J. Hoare. 2019. “Misophonia: A Scoping Review of Research.” Journal of Clinical Psychology 75 (7): 1203–1218. doi:10.1002/jclp.22771.
- R Core Team 2020. R: A Language and Environment for Statistical Computing [Computer Software]. Vienna, Austria: R Core Team.
- Rosenhall, U., V. Nordin, M. Sandström, G. Ahlsén, and C. Gillberg. 1999. “Autism and Hearing Loss.” Journal of Autism and Developmental Disorders 29 (5): 349–357. doi:10.1023/A:1023022709710.
- Rosing, S. N., J. H. Schmidt, N. Wedderkopp, and D. M. Baguley. 2016. “Prevalence of Tinnitus and Hyperacusis in Children and Adolescents: A Systematic Review.” BMJ Open 6 (6): e010596. doi:10.1136/bmjopen-2015-010596.
- Schaaf, R. C., S. Toth-Cohen, S. L. Johnson, G. Outten, and T. W. Benevides. 2011. “The Everyday Routines of Families of Children With Autism.” Autism : The International Journal of Research and Practice 15 (3): 373–389. doi:10.1177/1362361310386505.
- Scheerer, N. E., T. Q. Boucher, B. Bahmei, G. Iarocci, S. Arzanpour, and E. Birmingham. 2021. “Family Experiences of Decreased Sound Tolerance in ASD.” Journal of Autism and Developmental Disorders 1–15. doi:10.1007/s10803-021-05282-4.
- Siepsiak, M., A. Śliwerski, and W. Ł. Dragan. 2020. “Development and Psychometric Properties of MisoQuest—A New Self-Report Questionnaire for Misophonia.” International Journal of Environmental Research and Public Health 17 (5): 1797. doi:10.3390/ijerph17051797.
- Swedo, S., D. M. Baguley, D. Denys, L. J. Dixon, M. Erfanian, A. Fioretti, P. J. Jastreboff, et al. 2021. “A Consensus Definition of Misophonia: Using a Delphi Process to Reach Expert Agreement.” medRxiv..
- Tomchek, S. D, and W. Dunn. 2007. “Sensory Processing in Children With and Without Autism: A Comparative Study Using the Short Sensory Profile.” The American Journal of Occupational Therapy 61 (2): 190–200. doi:10.5014/ajot.61.2.190.
- Tortorella, F., S. Pavaci, A. B. Fioretti, F. Masedu, M. Lauriello, and A. Eibenstein. 2017. “The Short Hyperacusis Questionnaire: A Tool for the Identification and Measurement of Hyperacusis in the Italian Tinnitus Population.” Audiology Research 7 (2): 182. doi:10.4081/audiores.2017.182.
- Williams, Z. J., J. L. He, C. J. Cascio, and T. G. Woynaroski. 2021. “A Review of Decreased Sound Tolerance in Autism: Definitions, Phenomenology, and Potential Mechanisms.” Neuroscience and Biobehavioral Reviews 121 : 1–17. doi:10.1016/j.neubiorev.2020.11.030.
- Williams, Z. J., E. Suzman, and T. G. Woynaroski. 2021. “Prevalence of Decreased Sound Tolerance (Hyperacusis) in Individuals With Autism Spectrum Disorder: A Meta-Analysis.” Ear and Hearing 42 (5): 1137–1150. doi:10.1097/AUD.0000000000001005.
- Wright, B. D, and J. M. Linacre. 1994. “Reasonable Mean-Square Fit Values.” Rasch Measurement Transactions 8 : 370. https://www.rasch.org/rmt/rmt83b.htm
- Wright, B. D, and G. N. Masters. 1982. Rating Scale Analysis. Chicago, IL: MESA Press.
- Yamada, H., T. Ishikawa, N. Oishi, and K. Ogawa. 2022. “Cut-off Score of the Khalfa Hyperacusis Questionnaire with 10 Selected Items.” International Journal of Audiology, (AHEAD-OF-PRINT) 61 (3): 245–246. doi:10.1080/14992027.2021.1894491.