
Abstract
Objective
To examine the association between individual and cumulative leisure noise exposure in addition to acceptable yearly exposure (AYE) and hearing outcomes among a nationally representative sample of Canadians.
Design
Audiometry, distortion-product otoacoustic emissions (DPOAEs) and in-person questionnaires were used to evaluate hearing and leisure noise exposure across age, sex, and household income/education level. High-risk cumulative leisure noise exposure was defined as 85 dBA or greater for 40 h or more per week, with AYE calculations also based on this occupational limit.
Study sample
A randomised sample of 10,460 respondents, aged 6–79, completed questionnaires and hearing evaluations between 2012 and 2015.
Results
Among 50–79 year olds, high-risk cumulative leisure noise was associated with increased odds of a notch while high exposure to farming/construction equipment noise was associated with hearing loss, notches and absent DPOAEs. No associations with hearing loss were found however, non-significant tendencies observed included higher mean hearing thresholds, notches and hearing loss odds.
Conclusion
Educational outreach and monitoring of hearing among young and middle-aged populations exposed to hazardous leisure noise would be beneficial.
Introduction
Hearing impairment is the most prevalent sensory deficit with an estimated 1.5 billion individuals affected globally (WHO Citation2021). The cumulative effect of unprotected exposure to excessive noise during everyday activity is an increased risk of noise induced hearing loss (NIHL). The intensity and duration of this exposure are key factors in determining the overall impact on hearing. According to the World Health Organisation (WHO), approximately one billion teenagers and young adults are at risk of NIHL due to hazardous recreational listening behaviours (WHO Citation2015, Citation2019). The mechanism of NIHL involves damage to increasing numbers of cochlear hair cells over time resulting in a gradual degradation of hearing sensitivity. The insidious nature of hearing loss means that individuals are often unaware of their hearing difficulty until the deficit becomes more pronounced and they experience difficulty communicating, also known as functional hearing loss.
Historically, the focus has been on occupational noise exposure and its impact on hearing, however high pre-employment NIHL prevalence in young construction and trades workers raised concerns about non-occupational noise exposure (Leensen et al. Citation2011; Rabinowitz et al. Citation2006; Seixas et al. Citation2005). Most cumulative leisure noise studies have been based on an occupational limit of 85 dBA, for 40 h/week, however, methods for determining the loudness of a leisure activity have varied, with some using associated sound pressure levels (SPLs) based on scientific literature while others have employed loudness estimates using vocal effort or loudness scales (Jokitulppo et al. Citation2006). This highlights the complexity of estimating leisure noise exposure and the different methods used for determining risk to hearing.
One method of estimating risk from total leisure noise exposure introduced by Williams et al. (Citation2010) and subsequently applied by Beach et al. (Citation2013) and Dehnert et al. (Citation2015), involves calculating an acceptable yearly exposure (AYE) derived from an acceptable daily exposure of 85 dBA over 8 h, equivalent to 1.01 Pa2h, the numerical level acceptable for a typical work day. Using 220 days as an approximate working year, 1 AYE (equivalent to 222.2 Pa2h) was deemed the acceptable yearly noise exposure; therefore, using self-reported exposure duration and the sound pressure level associated with each leisure activity to calculate AYE, total leisure noise activities which exceeded 1 AYE represented high-risk noise exposure (Williams et al. Citation2010).
An Australian study by Beach et al. (Citation2013) involving 18–35 year olds (n = 1000), using five high noise activities and calculated AYEs, estimated that 14.1% may be at risk of NIHL while Dehnert et al. (Citation2015) surveyed nineteen leisure activities using both AYE and cumulative leisure noise exposure to estimate hearing risk among adolescents, aged 13–19 (n = 2,143). Dehnert et al. (Citation2015) reported that 41.9% were exposed to hazardous cumulative leisure noise (greater than 85 dBA, 40 h/week) and also identified specific high-risk leisure activities with AYEs exceeding 1, such as attending concerts, visiting discotheques and loud personal listening device (PLD) usage. In a broader population-based Canadian study of 6–79 year olds (n = 10,460) in which nine loud leisure noise sources were considered, nearly one-third of participants had cumulative leisure noise exposures of greater than 85 dBA over 40 h/week (Feder et al. Citation2019). Hearing status was not reported in the aforementioned studies, however, according to ISO (Citation1999:2013), the authors concluded that participants were at risk of developing NIHL if this exposure persisted over years (Feder et al. Citation2019).
Some studies have included audiometric evaluation of participants exposed to high levels of leisure noise from different sources with variable findings (Jokitulppo et al. Citation2006; Tung and Chao Citation2013; Dalton et al. Citation2001; Degeest et al. Citation2017; Keppler et al. Citation2015). A study of male Finnish conscripts (n = 1054), aged 19–27, found that nearly one-third had weekly leisure noise exposure of greater than 85 dBA, using an estimation of loudness scale, but only 20% had a hearing loss greater than 20 dB HL, at one or more frequencies (0.5–8 kHz) (Jokitulppo et al. Citation2006). In the aforementioned study, subjects completed a questionnaire detailing their exposure to leisure-time activities with regards to hours per week, number of years and a loudness estimation (rated from 1 to 5) for each activity. The 1–5 ratings were then transformed into estimated equivalent sound pressure levels (1 = 60 dBA; 2 = 70 dBA; 3 = 80 dBA; 4 = 90 dBA; 5 = 100 dBA) and together with the reported hours per week of exposure, a weekly equivalent noise level was calculated for each activity and compared to the reference noise exposure (40 h work week, 85 dBA) to determine the proportion of conscripts who surpassed the occupational limit. However, this study cohort represents a biased sample with findings that cannot be generalisable to civilians or females. In contrast, a Flemish study of 18–30 year olds (n = 517), using the same methodology as Jokitulppo et al. (Citation2006) to estimate lifetime leisure noise exposure, reported that none of the participants had clinical hearing loss (PTA: 0.5–8 kHz) using 20 and 25 dB HL thresholds, despite a total or cumulative leisure time noise exposure of approximately 7 years (Degeest et al. Citation2017). Total or cumulative (lifetime) leisure noise exposure was calculated using the self-reported total time in years spent in each leisure activity and in all of the activities combined (Degeest et al. Citation2017; Jokitulppo et al. Citation2006). Similarly, a smaller study of 18–35 year olds (n = 163) found no significant differences in hearing thresholds when high, intermediate and low lifetime equivalent noise exposure groups were compared (Keppler et al. Citation2015). However, Dalton et al. (Citation2001) reported a marginally increased risk of high-frequency hearing loss (>60 dB HL, PTA: 4, 6, 8 kHz) among 48–92 year olds when loud leisure noise activities (90 dBA or greater) were summed. In a study of first-year university students in Taiwan (n = 1878), 11.9% had hearing thresholds over 25 dB HL (one or both ears), with no significant audiometric differences found between the high leisure noise exposure group (n = 190) and low leisure noise exposure controls (n = 191) (Tung and Chao Citation2013). However, high leisure noise exposure was not based on 85dBA over 40 h or AYEs but involved selecting the top 10% of students with the highest total dose of recreational exposure for the previous 12 months, based on self-reported durations and frequencies (Tung and Chao Citation2013). The differing methodology does not allow comparison to studies that used an occupational noise limit or AYE to estimate cumulative noise exposure.
Occupational noise studies commonly examine the prevalence of an audiometric “noise notch” which typically develops at 3, 4 or 6 kHz with recovery at 8 kHz and which represents the first sign of NIHL among noise-exposed individuals (Mirza et al. Citation2018). Regardless of whether loud noise is experienced at work or during leisure, a notch can broaden and affect adjacent frequencies with continued noise exposure (Mirza et al. Citation2018; McBride and Williams Citation2001). Workers exposed to loud occupational noise have higher odds of an audiometric notch compared to those non-exposed using varying notch definitions (Feder et al. Citation2017; Carroll et al. Citation2017), while leisure noise studies have presented mixed findings (Wei et al. Citation2017; Twardella et al. Citation2017; le Clercq et al. Citation2016). The Niskar notch definition (Niskar et al. Citation2001), more commonly used in leisure noise studies, was not associated with high PLD usage (n = 2143) or with total leisure time exposure among 9th Grade students (n = 1837) or among a cohort of 18–23 year olds (n = 278) (Twardella et al. Citation2017; Wei et al. Citation2017; Dehnert et al. Citation2015). However, a meta-analysis by le Clercq et al. (Citation2016) reported a wide prevalence of audiometric notches (8.3–46%) across five studies of music-exposed children or adolescents, with the notch prevalence rising with increased music exposure or among older participants (Phillips et al. Citation2010; Archana et al. Citation2014; Mostafapour et al. Citation1998; West and Evans Citation1990; Zocoli et al. Citation2009).
Distortion-product otoacoustic emissions (DPOAE) testing is an assessment tool evaluating the integrity of the outer hair cells of the cochlea which are often damaged in the early stages of NIHL before the impairment becomes a functional hearing loss (Lapsley Miller et al. Citation2006; Rask-Andersen et al. Citation2000). Research findings suggest that OAEs may be used as objective means to assess noise-induced, sensory-cell damage to cochlear frequency regions that appear to be audiometrically normal (Attias et al. Citation2001; Atchariyasathian, Chayarpham, and Saekhow Citation2008; Lapsley Miller et al. Citation2006). In some adolescent or young adult leisure noise studies, absent or lower strength OAE emissions indicating damage to some of the hair cells were reported among participants with amplified music exposure compared to controls (Silva et al. Citation2017; Biassoni et al. Citation2014).
Demographic variables such as age, sex and education or household income levels were examined in relation to leisure noise exposure and hearing in studies with conflicting results. Males had a higher prevalence of leisure noise exposure compared to females in some studies, while others reported no sex differences (Smith et al. Citation2000; Jokitulppo and Bjork Citation2002; Dehnert et al. Citation2015; Beach et al. Citation2013). Beach et al. (Citation2013) found no significant sex differences among young adults who completed secondary education, however among those who did not, males had higher leisure noise exposure. Several studies have found that younger subjects, particularly teenagers and young adults, participated in louder leisure noise activities compared to older subjects (Biassoni et al. Citation2014; Jokitulppo and Bjork Citation2002; Beach et al. Citation2013; Feder et al. Citation2019). Fewer studies have examined the relationship between leisure noise and hearing in relation to household education or income level. One adolescent study by Dehnert et al. (Citation2015) reported a greater likelihood of audiometric notches among students with lower educational levels, however, the overall prevalence of notches was low, while another population-based adolescent study reported an association between low household income and hearing loss (Rhee et al. Citation2019). Neither study found a relationship between high-risk cumulative leisure noise exposure and low income or education (Dehnert et al. Citation2015; Rhee et al. Citation2019).
The majority of leisure noise exposure and hearing studies comprised teenagers or young adults from either the U.S, Australia or European Union countries. To date, there are no population-based studies examining leisure noise exposure and hearing status among a broad age range of Canadians. The present study, based on 2012–2015, Cycle 3 and 4, Canadian Health Measures Survey (CHMS) data, was designed to examine the relationship between loud leisure noise exposure and hearing among a nationally representative sample of Canadians, aged 6–79. Specifically, the objectives of this study were to examine the association between individual and cumulative high-risk leisure noise exposure of 85 dBA or greater for 40 h or more per week and AYEs greater than 1 and a) pure-tone average (PTA) hearing thresholds, b) mean hearing thresholds, c) absent DPOAEs (as defined in this study), d) Niskar audiometric notch and e) sociodemographic variables of age, sex, household income and education.
Methods
Study design and study population
Recruitment of CHMS participants took place for Cycle 3 (2012–2013) and Cycle 4 (2014–2015) consecutively, across Canada. In this ongoing cross-sectional survey, one or two individuals were randomly selected from each household being surveyed, using a multistage weighted person-level sampling strategy by age and sex. The CHMS excludes full-time members of the Canadian Forces, residents of the three territories, First Nations Reserves and other Aboriginal settlements, certain remote regions, and institutionalised residents. Despite these exclusions, CHMS data are considered to be representative of the Canadian population. The CHMS uses a rigorous methodology for validating responses, as outlined in the CHMS User Guide (Statistics Canada Citation2015). Available at: http://www23.statcan.gc.ca/imdb-mdi/document/5071_D4_T9_V2-eng.htm
The sampling protocol covers approximately 96% of the Canadian population. The CHMS carried out on approximately 10,000 individuals over a four-year period, allows estimates for sex and age groups, as presented in this study (Statistics Canada Citation2015). This study was approved by the Health Canada and Public Health Agency of Canada Review Ethics Board (Protocol #2005-0025).
Data collection
Individuals were invited to complete a household questionnaire, administered in the individual’s home. This was followed by an invitation to participate in the physical measures component of the CHMS, which involved travel to a mobile examination clinic (MEC) site for testing including a hearing evaluation. Participants who agreed to take part in the physical measures component were allotted a $100 honorarium. Proxy interviews were accepted in cases of physical and/or intellectual impairment and for children under age 12.
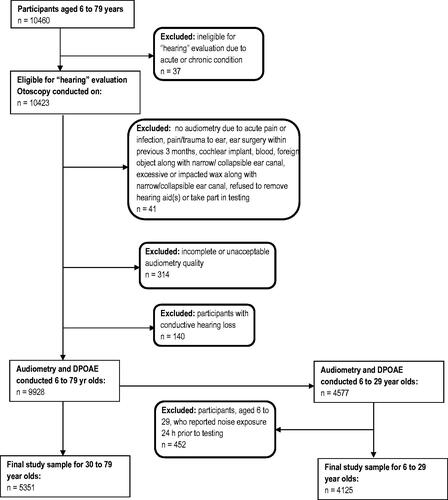
Household questionnaires including noise exposure questions and a hearing evaluation module were administered to participants, aged 6–79 years (n = 10,460). Participants were excluded at different stages of the hearing evaluation module as indicated in .
Figure 1. Canadian Health Measures Survey: Exclusions for hearing evaluation module (unweighted). Note: DPOAE: distortion product otoacoustic emissions.
Household questionnaire
Self-reported data were collected in-person, in English or French, using a computer-assisted household questionnaire, comprised of 12 different modules, requiring approximately 90–110 min to complete. A wide range of questionnaire modules was included from sun exposure to dietary habits in addition to demographic, socioeconomic, health and lifestyle information. The noise exposure module consisted of 52 questions, with an administration time of approximately 30–40 min. The complete CHMS household questionnaire (Cycle 3 and 4) can be accessed online at: https://www23.statcan.gc.ca/imdb-bmdi/instrument/5071_Q2_V4-eng.htm#a29.
In the noise exposure module, exposure to potentially hazardous noise sources was estimated by asking participants about specific sources of loud noise exposure during the previous year, including duration and frequency. The first portion of the noise exposure module was dedicated to loud workplace noise exposures, with findings previously published (Feder et al. Citation2017). The second portion of this module focussed on the following loud leisure noise exposure sources: power tools (e.g. circular saws, grinders, belt sanders, hammer drills) heavy industrial, farming or construction equipment (e.g. bulldozers, gas turbines, large compressors), hand-held gasoline engines (e.g. leaf blowers, hedge trimmers, gas-powered chainsaws), motorcycles or snowmobiles driven at highway speeds, sporting or entertainment events, amplified music at concerts, nightclubs or as a band member, loud music listening without headphones or earbuds (e.g. home or car stereos), loud PLD usage and firearms or guns (number of rounds fired or exposed to).
Hearing evaluation protocol
Participants were evaluated in a MEC. The possibility that a temporary threshold shift (i.e. a temporary increase in hearing threshold following loud noise exposure) may have influenced measurements was considered by asking all participants to recall their exposure to loud noise/music in the 24 h before testing. Among 6–29 year olds, loud noise/music exposure was reported by 11.1% (95% CI: 8.7–13.5) of participants in the 24 h prior to testing, with significant differences observed at 3 kHz (p < 0.01), 6 kHz (p < 0.05) and HFPTA (p < 0.05) where those who reported 24-h prior noise exposure showed a higher likelihood of having a hearing loss compared to the non-exposed group (data not shown). This group of participants (n = 452) was therefore removed from the hearing analysis. Among 30–79 year olds, exposure to loud noise/music was reported by 5.4% (95% CI: 4.3–6.8), with no significant differences observed in hearing loss prevalence among those exposed and not exposed in the previous 24 h. The proportion of absent DPOAEs among individuals exposed and not exposed to loud noise/music in the previous 24 h among 30–79 year olds was statistically similar, in that 28% were in the exposed group compared to 30% in the non-exposed group.
All testing was carried out by trained health measures specialists with supervision provided by a certified audiologist who conducted periodic on-site visits to ensure quality control. Hearing tests, with the exception of otoscopy and tympanometry, were conducted in a portable audiometric sound booth (Eckel, AB-4230 AQ5).
A Casella CEL-633 sound level meter monitored ambient sound pressure levels inside the sound booth. Testing was paused if sound pressure levels exceeded 55 dB SPL (A-weighted) for more than 2 s. This testing protocol safeguard was developed in the case of loud environmental or people noise (from inside or outside the MEC) which may potentially interfere with hearing test results.
The hearing evaluation consisted of: otoscopy, tympanometry, distortion product otoacoustic emission (DPOAE) and audiometric evaluation (0.5–8 kHz). Otoscopy was performed, prior to testing, using the Welch Allyn otoscope (Model 25020) to identify gross abnormalities of the outer ear. Criteria for otoscopic exclusion included obstructed ear canal, acute pain or infection, open wounds or bandages covering the ear(s), refusal to remove hearing aid, or chronic abnormalities including congenital atresia or microtia of the ear canal (one or both ears). No further testing was performed if the individual was excluded by otoscopy.
Tympanometry was conducted using the GSI 39 Auto Tympanometer. A normal tympanogram was defined as compliance between 0.2 and 1.8 cm3 with middle ear pressure between −150 and +50 daPa in an equivalent ear canal volume of between 0.75 cm3 and 2.0 cm3 (Jerger Citation1970). Tympanometry was not administered when blood, pus or impacted wax, eardrum perforation, growth in the ear canal, and/or significant skin abnormality or discharge was observed during otoscopy.
DPOAE was conducted using the OtoRead Standard and Clinical-OAE instrument. The custom protocol set for the instrument identified a “Pass” when otoacoustic emissions were detected at a 6 dB signal-to-noise ratio for three out of four test frequencies (f2 = 2, 3, 4, and 5 kHz, presented at L1 = 65 dB SPL, L2 = 55 dB SPL, measured at 2f1-f2, with f2/f1 = 1.21). If the Pass criteria were not met, the OtoRead instrument indicated a “Refer” on the testing. For the purposes of this analysis, a “Refer” was considered to be an absent DPOAE. Criteria for exclusion from DPOAE testing included the inability to conduct otoscopy, occlusions in both ears, presence of blood, a foreign object/substance in both ears, impacted wax in both ears, unwillingness or unable to remove his/her hearing aids from both ears.
The audiometric evaluation was carried out using a computer-controlled CCA-100 mini audiometer with inserted earphones (EAR 5A). In cases where a participant was excluded from tympanometry for the reasons noted above, audiometry was performed using supra-aural headphones (TDH-39) instead of inserted earphones. In addition, supra-aural headphones were offered when a participant found insert earphones very uncomfortable or a good fit for insert earphones could not be attained. Among all participants, 70% used insert earphones, 27.7% used supra-aural headphones and for 2.3%, this information was missing. The audiometer was calibrated daily using the Bio-Acoustic simulator BAS-200. Hearing thresholds were assessed at 0.5, 1, 2, 3, 4, 6 and 8 kHz. Testing followed procedures recommended for standard audiometry using automatic mode, except when the respondent could not physically press the response button, had very slow response times, or when difficulties were noted with automatic mode. Manual mode was carried out using the modified Hughson-Westlake ascending method (Carhart and Jerger Citation1959). Individuals who refused or had apparent cognitive deficits that could potentially interfere with testing were excluded from audiometric evaluation.
Definitions
Audiometric mean hearing thresholds for individual frequencies (0.5–8 kHz) and for each pure-tone average (PTA) were calculated using the worse ear value for each participant. HL was defined as hearing thresholds of greater than or equal to 20 dB HL for 6–19 year olds and greater than 25 dB HL for 20–79 year olds at the following PTAs: four frequency (0.5, 1, 2, and 4 kHz) (FFPTA), high frequency (3, 4, 6 and 8 kHz) (HFPTA) and low frequency (0.5, 1 and 2 kHz) (LFPTA). Individuals with either bilateral or unilateral loss were classified as having a hearing loss.
An audiometric “notch” was defined as follows: Thresholds at 0.5 and 1 kHz are less than or equal to 15 dB HL, and the maximal threshold at 3, 4, or 6 kHz is greater than or equal to 15 dB HL higher or worse than the highest threshold for 0.5 and 1 kHz, and the threshold at 8 kHz is greater than or equal to 10 dB HL lower or better than the maximal threshold for 3, 4, or 6 kHz, unilaterally or bilaterally (Niskar et al. Citation2001).
Leisure noise exposure: Acceptable yearly exposures, cumulative and individual (single source) exposure
Acceptable yearly exposures (AYE), previously used by Williams et al. (Citation2010) and Beach et al. (Citation2013), were derived from the acceptable daily exposure (ADE), which is a calculated estimate of total leisure noise exposure using a common occupational daily exposure limit of 85 dBA over 8 h (equivalent to 1.01 Pa2h). To calculate the number of ADEs over a 12-month period, self-reported frequency and duration for each loud leisure noise exposure were used. Total leisure noise exposure was expressed as a proportion of the AYE, with greater than 1 representing high-risk noise exposure and an AYE of less than or equal to 1 being acceptable noise exposure. Note that these proportions (greater than 1 AYE and less than or equal to 1 AYE) may not equal 100% as individuals not exposed to the targeted leisure noise were retained in the denominator.
AYE of amplified music, sporting entertainment events, car/home stereo listening. This variable combined the calculated AYEs for the three aforementioned leisure noise sources (according to self-reported frequency and duration of loud exposure from each of these leisure noise activities).
The calculation of AYEs for firearm exposure required a unique methodology and was based on the self-reported number of rounds fired or exposed to in the previous 12 months. As previously reported by Feder et al. (Citation2019), 1 shot/day (or 5 shots per week) was calculated to be the maximum daily (weekly) permissible exposure. Consequently, 260 shots/year were considered high or greater than 1AYE and therefore participants who chose either of the two highest categories (for the number of rounds fired or exposed to) exceeded 1AYE. For information regarding the criteria applied to derive an AYE across all leisure noise exposures, see Feder et al. (Citation2019).
High-risk cumulative or individual (single source) leisure noise exposure, based on self-reported duration and frequency for each loud leisure noise activity and associated sound pressure levels (SPLs), was categorised as either 1) equivalent to or above the occupational limit of 85 dBA (LEX, 40 h; ISO Citation1999:2013) for 40 h or more per week or 2) below 85 dBA, equivalent to less than 40 h/week. To calculate the cumulative noise exposure, participants’ total time (in hours per week) for each loud leisure activity was multiplied by the appropriate noise weighting factor and then summed across all activities. For details regarding the methodology used for determining the noise weighting factor, associated SPLs for each leisure noise activity and calculation of cumulative leisure noise exposure from all sources, see Feder et al. (Citation2019).
Cumulative leisure noise exposure refers to total noise exposure from all loud leisure noise sources surveyed, based on self-reported duration and frequency as described above.
Individual or single source leisure noise exposure refers to total noise exposure from one specific source of loud leisure noise, based on self-reported duration and frequency, as described above.
Participants reporting not being exposed to noise from any specific leisure activity comprised the non-exposed group.
Statistical analysis
Population weighted frequencies and cross-tabulations were used to explore the characteristics of participants by demographic variables of age, sex, education and household income, participation in each noisy leisure activity and the overall prevalence of hearing loss. All estimates were weighted at the person level to represent the population. The population weighting procedure has been described in previous publications (Feder et al. Citation2021; Feder et al. Citation2017; Citation2017b). See the CHMS user guide for details about the weighting procedure and its application (Statistics Canada Citation2015).
The analyses were carried out using the following age groupings: 6–11 year olds, 12–19 year olds, 20–29 year olds, 30–49 year olds and 50–79 year olds, with additional analysis for 20–39 year olds to allow comparison to other studies. Cumulative leisure noise exposure and AYEs were calculated for each age group, with these analyses yielding similar results regardless of whether PLD usage was included. Therefore, the final analyses includes PLD usage. The estimated time in hours per week was also calculated for individual (single source) leisure noise exposures. Findings for PLD usage and hearing outcomes have been previously published (Feder et al. Citation2021).
In order to assess the relationship between audiometric mean hearing thresholds (continuous outcome variable) and leisure noise exposures (predictor variable), linear regression models were applied. Audiometric mean evaluations were analysed at the individual frequencies 0.5–8 kHz, and at HFPTA, FFPTA and LFPTA. Assumptions of normality and constant variance were verified using the Anderson Darling test for normality and Levene's test for constant variance. In the case of binary outcome variables (i.e. prevalence of hearing loss, audiometric notch, absence of DPOAE), a logistic regression model was used to assess the relationship between these prevalence rates (binary outcome variable) and leisure noise exposures (predictor variables). Hearing loss was analysed at the individual frequencies 0.5–8 kHz, and at HFPTA, FFPTA and LFPTA.
All regression models, either linear or logistic, were adjusted for age, sex, household income and CHMS cycle. A preliminary analysis indicated that whether an individual used insert earphones or supra-aural headphones during audiometry affected the relationship between mean hearing thresholds and cumulative leisure noise exposure for the 6–11 year old age group only. Therefore, for this age group, the models were further adjusted for whether insert earphones or supra-aural headphones were used during testing. For ages 20–79, models were further adjusted for exposure to having worked in a noisy environment (Yes/No). The highest household education level was also considered in the above models but was found to be significantly correlated with household income (chi-square test of independence, p < 0.0001), and therefore was removed from the analysis in order to avoid multicollinearity issues.
When associating hearing loss, audiometric notch, absence of DPOAE or mean hearing thresholds to leisure noise exposures, participants with conductive hearing loss were removed from the analysis. Conductive hearing loss was defined as having absent DPOAEs and flat tympanograms. Satterthwaite F test was based on the variables in the full logistic or linear regression models; odds ratios from logistic regression were also adjusted for all other variables in the model. Comparisons within variables were always made to the reference category group of the variable, as listed in the tables.
Analyses were conducted using SAS Enterprise Guide 7.1 and SUDAAN 11.0.0 software. To account for the complex survey design, p-values, 95% confidence intervals, and coefficients of variation (CV), were estimated using the bootstrap technique with 22 degrees of freedom (Rao Citation1992; Rust and Rao Citation1996). Statistical significance was specified as a p-value of less than 0.05. All comparisons were carried out using the Satterthwaite F test, and Bonferroni corrections were made where multiple pair-wise comparisons were carried out. In the tables and text, estimates with a CV between 16.6% and 33.3% are flagged with an E (interpret with caution); those with a CV that exceeds 33.3% cannot be released and are designated F.
Results
Study population
A total of 10,460 respondents aged 6–79, took part in Cycle 3 and 4 of the CHMS, 2012–2015, representing approximately 30.8 million Canadians (49.9% males), with fairly equal distribution across household income levels (See Supplementary Table A). A disparity in household education level was observed, with the majority reporting some postsecondary education or higher (n = 8024) compared to those reporting secondary education or less (n = 1971). The combined response rate for the household questionnaire and the hearing evaluation module were 89.6% and 78.3%, respectively. Overall, middle and older aged males, aged 50–79, had significantly higher hearing loss prevalence and higher mean hearing thresholds at all PTAs compared to females, and males, aged 30–49, had significantly higher mean hearing thresholds at FFPTA and HFPTA compared to females (p < 0.01 in all cases). See Supplementary Tables B and C.
Loud individual (single source) leisure noise exposures: mean hearing thresholds and PTA hearing loss
Among 6–11 year olds, leisure noise exposure of 40 h or more per week for motorcycles/snowmobiles driven at highway speeds was associated with significantly higher mean hearing thresholds at LFPTA and FFPTA (p < 0.05), compared to the low or non-exposed group (). Among 12–19 year olds, a non-significant tendency towards higher mean hearing thresholds at 6 and 8 kHz and HFPTA was observed among those reporting amplified music exposure for 40 h or more per week compared to less than 40 h/week or the non-exposed group (). In contrast, a significantly lower mean hearing threshold at LFPTA was observed among those reporting amplified music exposure for 40 h or more per week (p < 0.05) compared to the non-exposed group.
Figure 2. Mean hearing thresholds for noise exposure from motorcycles and snowmobiles driven at highway speeds (high, low, no exposure) among 6–11 year olds. Note: Mean hearing thresholds were adjusted for age, sex, household income, earphone or supra-aural headphone use during testing and CHMS cycle. *Significantly different from reference category (no exposure), p < 0.05; LF: low frequency; FF: four frequency; HF: high frequency; PTA: pure tone average.
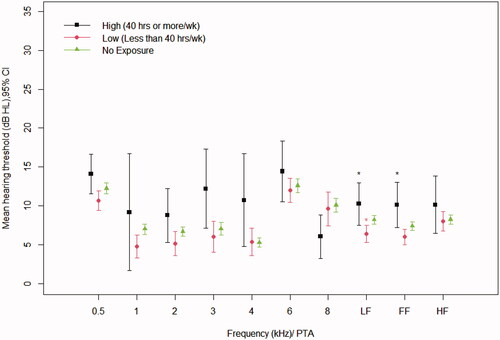
Figure 3. Mean hearing thresholds for specific leisure noise exposures (high, low, no exposure) by age group: (Panel A, B and C). (Panel A) 12–19 year olds: Mean hearing thresholds for Amplified Music exposure (high, low, no exposure). (Panel B) 20–39 year olds: Mean hearing thresholds for exposure to noise from Power Tools, Motorcycles/Snowmobiles at highway speed and Firearms (high, low, no exposure). (Panel C) 50–79 year olds: Mean hearing thresholds for exposure to noise from industrial Farming or Construction Equipment (high, low, no exposure). Note: All mean hearing thresholds were adjusted for age, sex, household income, ever exposed to a noisy work environment and CHMS cycle; PTA: pure tone average; LF: low frequency; FF: four frequency; HF: high frequency; *significantly different from reference category (no exposure), p < 0.05.
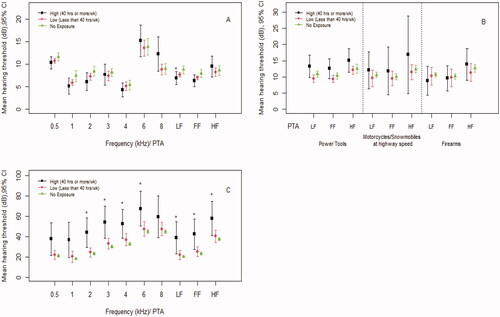
Among 20–29 year olds, when exposures of 40 h or more per week were considered for power tools and firearms, a non-significant tendency towards higher mean hearing thresholds was observed at most frequencies compared to less than 40 h/week or the non-exposed groups (at all frequencies and PTAs) (see Supplementary Figure A – Panels A and B). Similarly, among 30–49 year olds, 40 h or more per week of exposure to heavy industrial farming or construction equipment noise was associated with a non-significant increase in mean hearing thresholds (at FFPTA, HFPTA, 4 and 6 kHz) compared to less than 40 h/week or the non-exposed groups. (See Supplementary Figure A – Panel C).
Among 20–39 year olds, non-significant higher mean hearing thresholds were observed for all PTAs and frequencies among those exposed to 40 h or more per week of power tool noise compared to those non-exposed; these findings were also observed for those exposed to 40 h or more per week of motorcycles/snowmobiles driven at highway speeds and exposure to firearms, for which higher mean hearing thresholds were observed at HFPTA (see ) and 3, 4, 6 and 8 kHz (data not shown). However, among 20–39 years olds reporting amplified music exposure for 40 h or more per week, the contrary finding was observed in that this exposure was associated with lower mean hearing thresholds compared to those non-exposed, at FFPTA (8.0 dB HL vs 11.0 dB HL, p < 0.05), LFPTA (8.1 dB HL vs 11.1 dB HL, p < 0.01) and at 0.5 kHz (11.1 dB HL vs 14.6 dB HL), 1 kHz (6.2 dB HL vs 9.7 dB HL) and 2 kHz (8.3 dB HL vs 11.9 dB HL) (p < 0.05, in all cases). Among 50–79 year olds, significantly higher mean thresholds were observed for industrial farming/construction equipment noise at 3 (36.5 dB HL) and 4 kHz (39.4 dB HL) compared to the non-exposure groups (30.2 dB HL, 32.8 dB HL, respectively) (p < 0.05). When considering leisure noise exposure of 40 h or more per week from heavy industrial farming/construction equipment noise, a significantly higher prevalence of hearing loss (at all PTAs; p < 0.05, in all cases) and higher mean hearing thresholds (at all PTAs and at 2 kHz, 3 kHz, 4 kHz, 6 kHz; p < 0.05, in all cases) were found compared to those non exposed (). The odds ratios for hearing loss and participation in an individual loud leisure noise activity, that is yes/no in the previous 12 months, by age group, not considering duration or frequency, can be seen in .
Table 1. The odds ratio for the prevalence of hearing loss in relation to exposure or participation in each loud leisure noise activity (yes/no) in the previous 12 months, by age group.
Cumulative leisure noise exposure (40 hours or more per week): mean hearing thresholds and PTA hearing loss
No significant associations were found between mean hearing thresholds and hearing loss and cumulative leisure noise exposure of 40 h or more per week among 6–29 year olds (). However among 6–11 year olds, although not significant, mean hearing thresholds were higher for those whose parent or guardian reported 40 h or more per week of cumulative leisure noise exposure, compared to less than 40 h/week or the non-exposed group, for FFPTA and HFPTA ( and ). In addition, a higher prevalence of hearing loss at 6 kHz (19.8%; CI: 12.1, 30.6) was observed among those who reported 40 h or more per week of cumulative leisure noise exposure compared to those not exposed (15.8%; CI: 10.1, 23.9), although the difference was not significant (data not shown).
Figure 4. Cumulative leisure noise exposure and mean hearing thresholds by age group: 6–11, 12–19, 20–29. Note: Mean hearing thresholds were adjusted for age, sex, household income and CHMS cycle; for 6–11 year olds, mean hearing thresholds were further adjusted for whether insert earphones or supra-aural headphones were used. Age groups 20 years and older were further adjusted for noisy workplace exposure. Personal listening device usage was included in cumulative leisure noise exposure estimates. PTA: pure tone average; LF: low frequency; FF: four frequency; HF: high frequency. FFPTA: four frequency pure tone average at 0.5, 1, 2 and 4 kHz; HFPTA: high frequency pure tone average at 3, 4, 6 and 8 kHz; LFPTA: low frequency pure tone average at 0.5, 1 and 2 kHz. Source: 2012/2013; 2014/2015 Canadian Health Measures Survey (CHMS).
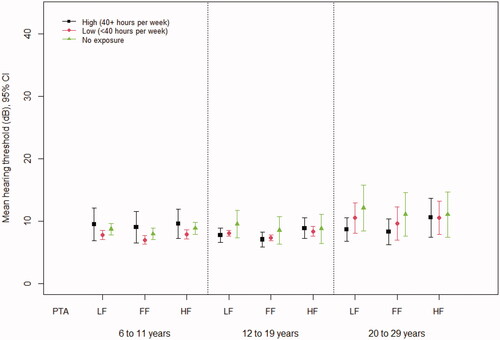
Figure 5. Cumulative leisure noise exposure and mean hearing thresholds by age group: 20–39, 30–49, 50–79. Note: Mean hearing thresholds were adjusted for age, sex, household income and CHMS cycle. Age groups 20 years and older were further adjusted for noisy workplace exposure. Personal listening device usage was included in cumulative leisure noise exposure estimates. PTA: pure tone average; LF: low frequency; FF: four frequency; HF: high frequency. FFPTA: four frequency pure tone average at 0.5, 1, 2 and 4 kHz; HFPTA: high frequency pure tone average at 3, 4, 6 and 8 kHz; LFPTA: low frequency pure tone average at 0.5, 1 and 2 kHz. Source: 2012/2013; 2014/2015 Canadian Health Measures Survey (CHMS).
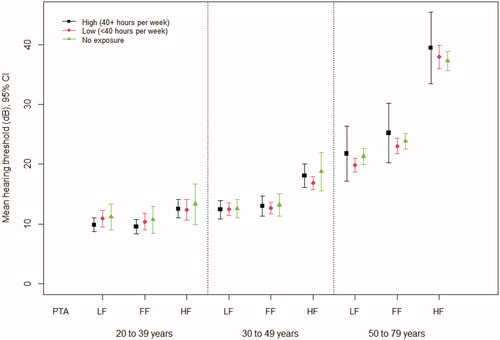
Among 20–39 year olds exposed to high cumulative leisure noise, non-significant higher odds of FFPTA HL (1.2 times higher) and LFPTA HL (1.2 times higher) were observed (). In addition, cumulative leisure noise exposure of 40 h or more per week among 50–79 year olds, was associated with non-significant higher odds of HFPTA hearing loss (1.6 times higher) compared to the non-exposed group (OR 1.6; 95% CI: 0.7–3.4) ().
Table 2. Odds ratioa (95% CI) for cumulative leisure noise exposureb and average yearly exposureb for each pure tone average by age group.
Average yearly exposure: mean hearing thresholds and PTA hearing loss
Among 50–79 year olds, the mean hearing thresholds for those with AYEs greater than 1 were consistently higher compared to those with AYEs less than 1, at all frequencies and PTAs, although the differences were not significant ( and ).
Figure 6. AYE and mean hearing thresholds for 6–11, 12–19, 20–29 year olds. Note: Mean hearing thresholds were adjusted for age, sex, household income and CHMS cycle; for 6–11 year olds, mean hearing thresholds were further adjusted for whether insert earphones or supra-aural headphones were used. Age groups 20 years and older were further adjusted for noisy workplace exposure. Personal listening device usage was included in AYE estimates. PTA: pure tone average; LF: low frequency; FF: four frequency; HF: high frequency. FFPTA: four frequency pure tone average at 0.5, 1, 2, 4 kHz; HFPTA: high frequency pure tone average at 3, 4, 6. 8 kHz; LFPTA: low frequency pure tone average at 0.5, 1. 2 kHz. Source: 2012/2013; 2014/2015 Canadian Health Measures Survey (CHMS).
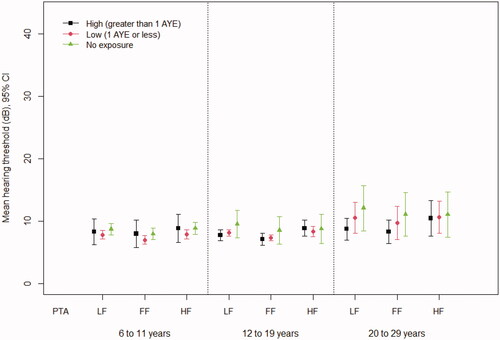
Figure 7. AYE and mean hearing thresholds for 20–39, 30–49, 50–79 year olds. Note: Mean hearing thresholds were adjusted for age, sex, household income and CHMS cycle. Age groups 20 years and older were further adjusted for noisy workplace exposure. Personal listening device usage was included in AYE estimates. PTA: pure tone average; LF: low frequency; FF: four frequency; HF: high frequency. FFPTA: four frequency pure tone average at 0.5, 1, 2, 4 kHz; HFPTA: high frequency pure tone average at 3, 4, 6, 8 kHz; LFPTA: low frequency pure tone average at 0.5, 1, 2 kHz. Source: 2012/2013; 2014/2015 Canadian Health Measures Survey (CHMS).
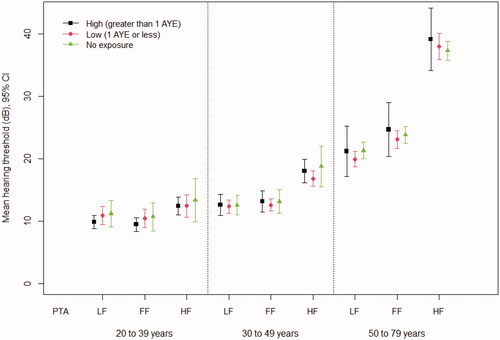
Among 20–39 year olds with AYEs greater than 1, non-significant higher odds of FFPTA HL (1.2 times higher) and LFPTA HL (1.1 times higher) were observed (). Among 50–79 year olds, non-significant higher odds of an HFPTA hearing loss (1.6 times higher) among those with greater than 1AYE were observed compared to those not exposed (OR 1.6; 95% CI: 0.8, 3.1) ().
Average yearly exposure: amplified music, sporting/entertainment events, car/home stereo listening
In considering the combined leisure noise exposure from amplified music, sporting/entertainment events and car/home stereo listening among 6–79 year olds, nearly half (49.0%; 95% CI: 46.3–51.7) of all participants (n = 5247, representing 15.1 million Canadians) were exposed to less than or equal to 1 AYE compared to 9.9% (95%CI: 8.4–11.6) (n = 702, representing 3 million Canadians) who were exposed to greater than 1 AYE. Among 20–39 year olds, the majority (55.9%, 95%CI: 50.5–61.3, n = 1287, representing 5.3 million Canadians) had AYEs of less than or equal to 1, while 20.8% (95% CI: 16.4–25.1, n = 280, representing 2 million Canadians) had AYEs greater than 1. Approximately half of these participants or 10.9% (95%CI:7.8–14.1, n = 157, representing 1 million Canadians) of all 20–39 year olds were exposed to more than twice the AYE per year, and 8.6%E (95% CI: 5.9–12.2, n = 126, representing 0.8 E million Canadians) were exposed to more than 3 times the AYE from these three activities.
Niskar audiometric notch and DPOAE
Overall, significantly more males compared to females had a higher prevalence of the Niskar audiometric notch and absent DPOAEs, with males, aged 30–49 and 50–79, showing a higher notch and absent DPOAE prevalence compared to other age groups (p < 0.05 in all cases) (see Supplementary Table B). For age groups under age 30, few significant associations were found between loud leisure noise exposures, individual or cumulative and the Niskar audiometric notch or absent DPOAEs. When 20–39 year olds were considered, a higher prevalence of absent DPOAEs was observed for power tool noise (OR: 2.7, 95% CI: 1.4, 5.1; p < 0.01) and for handheld gasoline engine noise (OR: 1.8, 95% CI: 1.1, 3.2; p < 0.05). Among 6–11 year olds, listening to loud home or car stereos without headphones was associated with a higher prevalence of absent DPOAEs (OR: 5.2, 95% CI: 1.5, 18.0; p < 0.05).
Among 12–19 year olds and 20–39 year olds, a higher prevalence of the Niskar audiometric notch was observed for several individual (single source) leisure noise exposure sources, cumulative leisure noise exposure and AYEs greater than 1. Although these prevalence rates were not significantly higher compared to the non-exposed, they show a pattern among younger aged individuals. See Supplementary Results – Appendix A.
Among 30–49 year olds, the odds of an absent DPOAE were significantly higher (p < 0.05) among those who reported power tool noise exposure totalling 40 h or more per week or more compared to those who did not (OR: 2.8, 95%CI: 1.1, 7.0). Among middle-aged and older Canadians, aged 50–79, those who reported amplified music exposure or heavy industrial farming or construction equipment noise for less than 40 h/week, had significantly higher odds of a Niskar notch than those who did not report this leisure noise exposure, with the odds 1.6 times higher for amplified music (OR = 1.6, 95% CI: 1.1–2.4, p < 0.05) and 1.9 times higher for heavy industrial farming or construction equipment noise (OR = 1.9, 95% CI: 1.3–2.8, p < 0.01) compared to the non-exposed group. Among 50–79 year olds, significantly higher odds of an audiometric notch were observed among those reporting high cumulative leisure noise exposure (OR: 1.7, 95%CI: 1.1, 2.6) or with AYEs greater than 1 (OR: 1.8, 95%CI: 1.1, 2.8) (p < 0.05, in both cases) compared to the no exposure group. As well, for those exposed to heavy industrial farming or construction equipment noise for 40 h or more per week, higher odds of an absent DPOAE were observed; the odds were 6.9 times higher (OR= 6.9, 95% CI: 1.7–27.7, p < 0.01) compared to those not exposed to this leisure noise.
Loud leisure noise exposure and sociodemographic variables
Among all sources of loud leisure noise exposure, the most prevalent were amplified music (40.5%; 95% CI: 38.1–42.8), power tool noise (37.3%; 95% CI: 34.3–40.2) and home or car stereo listening (34.3%; 95% CI: 31.6–36.9), with loud amplified music and home or car stereo listening highest among 20–29 year olds (67.1%; 95% CI: 58.4–75.8 and 53.8%; 95% CI: 44.5–63.0, respectively) compared to other age groups (Supplementary Figure B).
A significantly higher proportion of males compared to females were exposed to 40 h or more per week of noise from power tools, heavy industrial farming or construction equipment, motorcycle/snowmobiles at highway speed, amplified music and firearms (p < 0.01, in all cases). Similarly, a significantly higher proportion of males were exposed for less than 40 h/week to loud leisure noise from power tools, heavy industrial/farming or construction equipment, gasoline engines, sporting/entertainment events, car or home stereo listening and firearms (p < 0.01, in all cases). (Supplementary Table D).
In terms of cumulative loud leisure noise for 40 h or more per week, nearly 3 times as many males (30.8%, 95%CI: 27.2, 34.4) compared to females (12.4%, 95%CI: 10.2, 14.6) reported this exposure (p < 0.01), however, no sex differences were observed for less than 40 h/week (male: 52.1%; female: 55.9%). Similar findings were observed using AYEs (Supplementary Table E). Significantly more women do not participate in any noisy leisure activities (31.7%; 95% CI: 29.0–34.4) compared to males (17.1%; 95% CI: 14.4–19.9) (p < 0.01).
For the majority of loud leisure noise exposures totalling less than 40 h/week, a significantly higher proportion of individuals were from high-income households ($100 K or more per annum) compared to low ($50 K per annum) or medium income ($50 to under $100 K per annum) groups (p < 0.05, in all cases). However, leisure noise of 40 h or more per week from motorcycle/snowmobiles, driven at highway speeds and firearms were both significantly associated with household incomes of $100 K or more per annum (p < 0.05 and p < 0.01, respectively) (Supplementary Table D).
Discussion
This is the first population-based study to examine high-risk cumulative leisure noise exposure and AYE ratios in relation to hearing outcomes among a broad age group of 6–79 year old Canadians. Our findings suggest that significant associations between hearing outcomes and cumulative leisure noise exposure are not apparent until middle age or older, with specific leisure noise sources featuring more predominantly. Among 50–79 year olds, exposure to heavy industrial farming or construction equipment noise for 40 h or more per week was associated with hearing loss (all PTAs and most frequencies), significantly higher mean hearing thresholds (some frequencies), higher odds of an audiometric notch and absent DPOAEs compared to those not exposed. Interestingly, significantly higher odds of a notch were also found among 50–79 year olds exposed to less than 40 h/week of farming/construction equipment noise or amplified music, such that the odds of a notch were 1.9 times and 1.6 times higher, respectively, compared to those non-exposed. It may be that older individuals have been exposed to these leisure noise sources for longer periods during their lifetime resulting in a long-term impact on hearing. Some individuals may have also been exposed to farming or construction equipment noise as part of their livelihood with the boundary potentially blurred between leisure and occupational noise exposure for segments of this population. For example, a retired farmer or construction worker may choose to engage in agricultural or construction activity pursuits during leisure time.
These findings are similar to a population-based leisure noise study by Dalton et al. (Citation2001) involving 48–92 year olds (n = 3,571) in which the odds of a hearing loss (PTA of 0.5, 1, 2, 4 kHz greater than 25 dB HL) including a high-frequency hearing loss (PTA of 4, 6, 8 kHz greater than 60 dB HL) for participants who used a chainsaw, power tools or engaged in woodworking or metalworking were increased significantly compared to those who did not, after adjusting for confounders including age, sex and noisy occupation history. The leisure noise sources identified by Dalton et al. (Citation2001) differ somewhat from the present study which included farming and construction machinery noise, as a single category, with no specific questions about metal or woodworking. Nonetheless, similar to Dalton et al. (Citation2001), the present study’s middle to older adult age group showed consistent hearing loss associated with this loud leisure noise exposure while also adjusting for age, sex and having ever worked in a noisy environment. Construction and agricultural noise represent a potentially hazardous noise exposure with these sources often containing more damaging impulse sounds (Depczynski et al. Citation2005; Starck, Toppila, and Pyykkö Citation2003), with farming one of the highest ranked occupations for hearing loss risk (Milz et al. Citation2008). Furthermore, exposure to farming noise tends to begin at a young age and continues until middle age or older (Ehlers and Graydon Citation2011) with relatively low hearing protection usage among farmers (Depczynski, Challinor, and Fragar Citation2011; McCullagh et al. Citation2016; McCullagh, Lusk, and Ronis Citation2002), all of which contribute to the high risk of hearing loss associated with this noise exposure.
None of the other activities included in the Dalton et al. (Citation2001) study was associated with hearing loss when evaluated individually, however, when all loud leisure noise activities, equal to or greater than 90 dB SPL, were summed, a marginally increased risk of high-frequency hearing loss (PTA: 4,6,8 kHz; >60 dB HL)(OR:1.01; 95% CI:1.00–1.01) was reported. While the definition of hearing loss differed compared to the present study, cumulative noise exposure among 50–79 year olds in the present study was associated with non-significant increases in both mean hearing thresholds and the odds of an HFPTA hearing loss (1.6 times higher) compared to the non-exposed group. Together with the significantly increased prevalence of audiometric notches among those exposed to high-risk cumulative leisure noise, these findings may point to a subtle change in hearing among noise-exposed 50–79 year olds. The older age cut-off in the Dalton et al. (Citation2001) study (up to age 92 vs up to age 79) compared to the present study may have contributed to their significant hearing loss findings, as increasing age is strongly associated with hearing loss.
Despite a large proportion of teenagers and young adults exposed to loud cumulative leisure noise totalling 40 or more hours per week and AYEs greater than 1, no significant associations with hearing loss, the Niskar notch or elevated mean hearing thresholds were found in the present study. These findings are consistent with Dehnert et al. (Citation2015) in that no association with hearing loss thresholds or the Niskar notch was reported despite 42.0% of participants (n = 2,143), showing high-risk cumulative leisure noise exposure compared to 27.0% of 12–19 year olds in the present study. Dehnert et al. (Citation2015) also found a substantially higher number of teenagers exposed to discotheque noise compared to the present study; over half (54.2%) had an AYE greater than 1 for this noise source alone compared to 9.4% of 12–19 year olds in the present study. This difference may be due to the nationally representative sample of the present study compared to the restricted recruitment of 9th-grade students from one German city (Regensburg) by Dehnert et al. (Citation2015). While no association between discotheque noise and hearing outcomes was reported by Dehnert et al. (Citation2015), the present study found both a non-significant tendency towards higher mean hearing thresholds (at high frequencies of 6 and 8 kHz) and higher odds of an audiometric notch among teenagers exposed to 40 h or more per week of amplified music compared to the non-exposed group. This may be an indication that while no detectable effects on hearing were observed in this young cohort at this single point in time, deficits may become apparent over time with continued loud noise exposure.
In examining high-risk cumulative leisure noise exposure (40 h or more per week), AYEs (greater than 1 AYE) and hearing outcomes among young adults, higher mean hearing thresholds or higher odds of an audiometric notch were not observed. Among 20–29 year olds, 43.8% had high-risk cumulative leisure noise exposure, much higher than the exposure for 12–19 year olds (27.0%); and for amplified music exposure (40 h or more per week) alone, exposure was more than double (26.3% vs 9.1%), with no consistent pattern towards higher mean hearing thresholds or audiometric notches. One explanation may be the lower number of participants in the 20–29 year old age group compared to the 12–19 year old age group, which may have affected hearing outcomes despite the weighting applied. Nonetheless, our findings are aligned with other studies which reported no association between hearing loss, DPOAEs and leisure noise exposure among 18–30 year olds. A study (n = 517) by Degeest et al. (Citation2017) reported no “clinical” hearing loss (PTA: 0.5–8 kHz) using 20 and 25 dB HL thresholds despite a high percentage (92.5%) who attended nightclubs or music venues. Similarly, Keppler et al. (Citation2015) (n = 163) found no significant associations between high-risk cumulative recreational noise exposure and hearing loss thresholds or DPOAE amplitudes among young adults. However, the aforementioned findings were based on a small sample size with a far smaller percentage exceeding the cumulative 40 h or more weekly noise equivalent of 85 dBA compared to the present findings for 20–29 year olds (3.1% vs 43.8%). Studies have shown variable outcomes with regards to cumulative leisure noise exposure which may be explained partly by the leisure noise sources included, using a sample of convenience versus a population-based sample and the differing methodologies for calculating cumulative leisure noise exposure.
The use of DPOAEs has been more common in occupational noise studies, however, leisure noise and hearing studies are increasingly using this evaluation as an adjunct for identifying precursors to early NIHL. While audiometric evaluation remains the “gold standard” for identifying clinical hearing loss in the standard frequencies (0.5–8 kHz), typically using hearing loss thresholds of 20 or 25 dB HL for children and adults, respectively, there is research showing that audiometry does not capture subtle noise-induced cochlear changes (Attias et al. Citation2001; Lapsley Miller et al. Citation2006; Marshall et al. Citation2001). OAE outcomes can signal subclinical outer hair cell damage and preclinical frequency-specific hearing loss not observed using pure-tone audiometry in the conventional test frequencies (Laffoon et al. Citation2019; Marshall et al. Citation2001; Balatsouras Citation2004; Attias et al. Citation2001; Hamdan et al. Citation2008).
Consistent with Keppler et al. (Citation2015), the present study found no association between absent DPOAEs and cumulative or individual leisure noise exposure for those under the age of 30. However, analysis of a broader adult age grouping of 20–39 year olds found a significantly higher prevalence of absent DPOAEs for power tool and gasoline engine noise exposure compared to those non-exposed and for most other leisure noise activities/exposures of less than 40 h per week, a non-significant higher prevalence of absent DPOAEs was observed. This may be an indication that degradation of the outer hair cells of the cochlea may be taking place among those exposed to specific sources of loud leisure noise. A diminishment of outer hair cell integrity is an early sign of cochlear dysfunction and may occur prior to any discernible elevation in audiometric PTA thresholds (Attias et al. Citation2001; Seixas et al. Citation2004; Prasher and Sulkowski Citation1999). A study of 13–18 year olds, which examined amplified music exposure, found that although hearing thresholds were within normal limits, those in the high exposure group were 9.33 times more likely to develop cochlear alterations, observed by a higher proportion of failed DPOAEs, compared to the non-exposed group (Silva et al. Citation2017). Similarly, a higher prevalence of absent DPOAEs was found among a university cohort of music majors compared to non-music majors despite no differences in audiometric thresholds (Warner Henning and Bobholz Citation2016). While these studies focussed on high-risk amplified music exposure as opposed to cumulative leisure noise exposure, these findings highlight potential subclinical deterioration with regards to a single loud leisure noise source among adolescent and young adult cohorts, which may warrant further investigation.
Among 20–39 year olds in the present study, nearly 40% had AYEs greater than 1 which is nearly triple that reported by Beach et al. (Citation2013) for a similar age group (18–35 year olds; n = 1000) (14.1%). It should be noted that the Beach et al. (Citation2013) study comprised a convenience sample of individuals recruited online, through direct mail and personal invitations compared to the nationally representative sample in the present study and furthermore included only five high-noise leisure activities (nightclubs, concerts/live music venues, pubs/bars/clubs, fitness classes/sporting events). To compare to Beach et al. (Citation2013), AYEs for three closely matched leisure activities (amplified music, sporting/entertainment events, car/home stereo listening) calculated for the present study found that 20.8% or 1.97 million Canadians, aged 20–39, had AYEs greater than 1, a ratio still higher but somewhat more comparable to the 14.1% reported by Beach et al. (Citation2013). Nonetheless, no relationship was observed between high-risk annual noise exposure (AYE greater than 1) for these three leisure noise activities or for all leisure noise exposures (using cumulative noise exposure of 40 h or more or AYE greater than 1) and audiometric outcomes. It may be that for this age group, the impact of loud leisure noise exposure has not yet become apparent or measurable using audiometric evaluation.
However, Beach et al. (Citation2013) reported a significantly greater occurrence of tinnitus among those with high annual noise exposure, a finding consistent with other young adult and adolescent studies (Rhee et al. Citation2020; Shargorodsky et al. Citation2010). In a U.S. population-based study, leisure time noise exposure was associated with increased odds of frequent tinnitus in adults without hearing impairment (Shargorodsky et al. Citation2010). While tinnitus often co-exists with hearing loss, in isolation it may be viewed as a precursor to NIHL. It would be beneficial to examine tinnitus prevalence among individuals with high cumulative leisure noise exposure in future CHMS studies.
Specific hearing tests which examine the ability to understand speech in background noise may also be useful to include in future CHMS studies. This phenomenon is sometimes called “hidden hearing loss” or “noise-induced synaptopathy” to describe the mechanism occurring in those who have difficulty understanding speech in background noise despite normal audiograms. This difficulty has been linked to potential damage between the inner hair cells of the cochlea and their afferent neurons following loud noise exposure and resultant temporary threshold shifts (TTS) (Liberman et al. Citation2016; Shi et al. Citation2016). There is speculation that even though hearing thresholds return to normal following TTS, cochlear neuronal degeneration is occurring (Liberman et al. Citation2016; Pienkowski Citation2017). Therefore, the addition of speech-in-noise testing may be a useful addition to future hearing and leisure noise studies.
Overall, Canadians, aged 20–39 year olds had the highest prevalence of high-risk AYEs (1 AYE or greater) (34.5%) compared to all other age groups. However, high-risk AYEs for 12–19 year olds (32.3%) and 40–59 year olds (21.2%) were not insignificant and represent a substantial number of individuals in these age groups who are at-risk of NIHL. Among 20–39 year olds, non-significant higher odds of an FFPTA HL or LFPTA HL were found among those with high-risk AYEs or high cumulative leisure noise exposure compared to those non-exposed. Additionally, non-significant higher mean hearing thresholds (for all or most frequencies) observed for some leisure noise sources totalling 40 h or more per week (power tools, farming or construction machinery, snowmobiles/motorcycles at highway speeds, firearms) may be an indication of the beginning of subtle changes occurring in the auditory system. However, further research would be needed to corroborate these findings, as well as longitudinal studies to examine audiometric outcomes over time.
Other considerations for future studies include examining the risk of simultaneous chemical exposure associated with some sources of leisure noise, such as carbon monoxide from snowmobile or motorcycle exhaust fumes or lead exposure from firearms. There is research showing some chemicals and solvents in combination with loud noise exposure may have an additive effect on the auditory system and the development of potential NIHL (Vyskocil et al. Citation2012; Johnson and Morata Citation2010).
Among 6–11 year old children in the present study, high-risk cumulative leisure noise exposure was associated with non-significant but elevated mean hearing thresholds for FFPTA, HFPTA and at 3 and 4 kHz. This finding in the youngest age group may indicate a tendency towards changes in the audition which may result in future NIHL should high cumulative noise exposure persist. Previous research found that HFPTA hearing loss (PTA: 3, 4, 6, 8 kHz; 20 dB HL threshold) affected 6.4% of 6–11 year olds in a Canadian population-based study (Feder et al. Citation2017). However, apart from findings by Feder et al. (Citation2021) indicating loud PLD listening by 13.1% (or 283,000) of 6–11 year olds which were not associated with hearing loss or elevated mean thresholds, there are few population-based studies examining leisure noise exposure and hearing in this young age group. In the present study, 40 h or more per week of motorcycles/snowmobiles (driven at highway speeds) among 6–11 year olds, was associated with significantly higher mean hearing thresholds. It is unclear whether respondents included the use of all-terrain vehicles (ATVs) in addition to snowmobiles and motorcycles. If so, perhaps ATV usage among young paediatric populations (under age 11) documented in an injury data report (Chu et al. Citation2019), indicates a higher prevalence of ATV usage than expected and is a partial explanation for this finding. However, as leisure noise exposure data were collected by proxy or parental report for children under age 12, speculation may be raised regarding the reliability of this finding. It is therefore important that these findings be corroborated in future studies.
In terms of sociodemographic variables, the present study found that overall, a significantly higher prevalence of males compared to females (27.9% vs 10.6%) had high-risk cumulative leisure noise exposure. This finding is in contrast to Jokitulppo and Bjork (Citation2002) in which no sex differences among a Finnish urban population of adults, aged 25–58, were found; likewise, no significant male-female differences were reported in an adolescent study (Dehnert et al. Citation2015). This may be due to the different age range and/or methodology used in the aforementioned studies compared to the present study. Interestingly, among those exposed to cumulative leisure noise of fewer than 40 h/week, no significant sex differences were observed in the present study. This leads to speculation that higher risk leisure noise exposure may be linked to males, with females more likely to be prudent in their engagement in loud leisure activities, thereby putting themselves at less risk of hearing damage.
However, similar to Jokitulppo and Bjork (Citation2002), the present study found a higher proportion of men compared to women (10% vs 6%) participated in specific loud leisure noise activities such as attending concerts, nightclubs or being in a band and using power tools (8% vs 0.5%). A population-based study involving 48–92 year olds, also found a higher proportion of men took part in specific leisure activities (i.e. those involving power tools, chainsaws or driving a noisy recreational vehicle) (Dalton et al. Citation2001). This is consistent with the present study findings in which a higher proportion of males were exposed to noise from farming or construction machinery and from driving a snowmobile or motorcycle at highway speeds. This is not surprising as these leisure noise exposures are traditionally favoured by men while as Dalton et al. (Citation2001) reported, women took part in less noisy leisure activities such as playing a musical instrument, using a kitchen appliance, and a vacuum cleaner or hairdryer. In the present study, overall, across all age groups, males have a significantly higher prevalence of hearing loss compared to females (for all PTAs) which may reflect the increased likelihood of their participation in high noise leisure activities and their high cumulative leisure noise exposure.
Nearly three times as many males as females had high-risk cumulative leisure noise exposure, however, when this exposure was under 40 h per week, no sex differences were observed which is consistent with other population-based studies (Dalton et al. Citation2001; Armitage et al. Citation2020). Interestingly, this is in contrast to high-risk PLD usage, for which fairly equal male-female engagement was reported in a population-based Canadian study (Feder et al. Citation2021). Among 50–79 year olds, males had a significantly higher prevalence of hearing loss while among younger male age groups there was a non-significant tendency towards higher hearing loss prevalence. This may be explained by the accumulation of loud noise exposure over years in older males compared to their younger counterparts in whom the effects of loud leisure noise exposure in terms of audiometric outcomes, may not yet be apparent. The low use of hearing protection during exposure to recreational noise reported in several studies may also be a contributing factor (Armitage et al. Citation2020; Balanay and Kearney Citation2015; Feder et al. Citation2019; Gilles et al. Citation2013).
Previous research found that individuals from high-income households ($100 K or greater) were more likely to report amplified music and sporting/entertainment event exposure among others, compared to middle or low-income households (Feder et al. Citation2019). However, when the weekly duration of exposure was examined in the present study, the proportion of individuals engaging in risky leisure noise exposure (40 h or more per week) was equally distributed among high, medium and low household income groups, with the exception of motorcycle or snowmobile driving (at highway speeds) and firearm usage, for which a higher proportion of individuals were from high-income households. This finding may be related to the cost associated with owning and operating a recreational vehicle or firearm or attending a shooting range or club. The present study finding that less risky cumulative leisure noise exposure (less than 40 h or more per week) for many loud leisure activities was associated with high household income ($100 K or greater) may likewise be attributed to needing funds to participate in many leisure activities i.e. attending concerts, nightclubs, sporting and entertainment events.
Strengths and limitations
The strength of this study is the large randomly selected sample encompassing a broad age range and yielding nationally representative data. However, the self-reported collection of leisure noise information including duration and frequency, in the framework of the previous 12 months, has inherent limitations with regard to participant recall bias or error. Another limitation of the present study is that duration of leisure noise exposure in years was not captured and may be beneficial to include in future research. For example, Dalton et al. (Citation2001) found that for every 5-year interval of woodworking exposure, the hearing loss risk increased 6 per cent. In addition, not capturing the number of years of exposure or participation in each leisure noise activity precluded the calculation of lifetime leisure noise exposure estimates. Therefore, the inclusion of questions regarding leisure noise duration, in years, would be a beneficial addition to the CHMS questionnaire for future studies. It should be noted that the lower number of participants in the 20–29 year old age group surveyed in the CHMS Cycle 3 and 4 may have affected hearing outcomes despite the weighting applied. Another limitation may be the lack of bone conduction testing which may have hindered a complete exclusion of individuals with conductive hearing loss.
The use of hearing protection was not considered in this analysis and may represent a limitation. However, it is noteworthy that a previous study based on this CHMS cohort reported low hearing protection usage for most leisure noise activities, ranging from under 3% (amplified music, sporting or entertainment events) to 20% (power tools, gasoline engine noise) and 30% for use during farming/construction equipment noise, with the highest usage reported for firearms (44%) (Feder et al. Citation2019). Another limitation pertains to the range of leisure noise activities surveyed and the fact that some activities were not included such as exposure to fireworks/firecrackers, very noisy toys, fitness or aerobic classes and video arcades or gaming centres. For example, a Korean population-based study of adolescents (n = 2,879) reported a positive correlation between cumulative hours spent in local gaming centres and high-frequency hearing loss (Rhee et al. Citation2019). The use of absent DPOAEs instead of the strength of emissions represents a potential study limitation. The lack of data for individual DPOAE test frequencies did not allow the analysis of emission strength that may have shown changes in cochlear function in relation to high-risk cumulative leisure noise exposure. Lastly, extended high frequencies (9–16 kHz), which some studies have shown to be more sensitive to early onset NIHL, were not included as part of the audiometric evaluation conducted in the present study.
Conclusion
In this population-based Canadian study encompassing a broad age range of children, adolescents, young adults and older adults, 50–79 year olds emerged as having salient significant hearing outcomes in relation to high-risk leisure noise exposure, both cumulative and individual. It may be that for older individuals, exposure to loud leisure noise sources which have likely persisted for longer periods of time, have allowed cochlear changes and impacts on hearing acuity to occur compared to younger age groups. Depending on the years of high-risk cumulative leisure exposure among individuals in this age group, these findings may be partly due to accelerated or early onset age-related hearing loss. However, a retrospective study design would be needed to investigate this hypothesis.
However, among adolescents and young adults, despite substantial high-risk cumulative leisure noise exposure and AYEs, no significant associations with hearing outcomes were found. It may be that measurable changes using audiometric evaluation are not yet apparent in these younger age groups as the effects of noise exposure on hearing are greatest during the first ten to fifteen years of exposure (American College of Occupational, Environmental Medicine (ACOEM) Citation2018). Non-significant hearing outcomes associated with high-risk cumulative and individual (single source) leisure noise exposures may be an indicator of future hearing impacts should this leisure noise exposure pattern persist. This highlights the importance of educational outreach, longitudinal studies and following younger individuals’ hearing status over time.
Supplemental Material
Download MS Word (18.9 KB)Supplemental Material
Download MS Word (63.7 KB)Supplemental Material
Download MS Word (25.5 KB)Supplemental Material
Download MS Word (51.9 KB)Disclosure statement
No potential conflict of interest was reported by the author(s).
Correction Statement
This article has been republished with minor changes. These changes do not impact the academic content of the article.
Additional information
Funding
References
- American College of Occupational, Environmental Medicine (ACOEM). 2018. “ACOEM Guidance Statement: Occupational Noise-Induced Hearing Loss.” Journal of Occupational & Environmental Medicine 60 (9):e498–e501. doi:10.1097/JOM.0000000000001423
- Archana, R., C. Chandrakiran, H. Altaf, P. D. Surya, and S. Rajiv. 2014. “Effect of Usage of Personal Music Players on Hearing in Students Aged 18–25 yrs.” Journal of Evolution of Medical and Dental Sciences 3 (61):13560–13571. doi:10.14260/jemds/2014/3810.
- Armitage, C. J., M. T. Loughran, and K. J. Munro. 2020. “Epidemiology of the Extent of Recreational Noise Exposure and Hearing Protection Use: Cross-sectional Survey in a Nationally Representative UK Adult Population Sample.” BMC Public Health 20 (1):1529. doi:10.1186/s12889-020-09602-8.
- Atchariyasathian, V., S. Chayarpham, and S. Saekhow. 2008. “Evaluation of Noise-Induced Hearing Loss with Audiometer and Distortion Product Otoacoustic Emissions.” Journal of Medicine Assoc Thai 91:1066–1071. PMID: 18839846.
- Attias, J., G. Horovitz, N. El-Hatib, and B. Nageris. 2001. “Detection and Clinical Diagnosis of Noise-Induced Hearing Loss by Otoacoustic Emissions.” Noise & Health 3 (12):19–31. PMID: 12678938.
- Balanay, J. A. G, and G. D. Kearney. 2015. “Attitudes Toward Noise, Perceived Hearing Symptoms, and Reported Use of Hearing Protection among College Students: Influence of Youth Culture.” Noise and Health 17 (79):394–405. doi:10.4103/1463-1741.169701.
- Balatsouras, D. G. 2004. “The Evaluation of Noise-Induced Hearing Loss with Distortion Product Otoacoustic Emissions.” Medical Science Monitor 10:218–222. PMID: 15114273.
- Beach, E. F., M. Gilliver, and W. Williams. 2013. “Estimating Young Australian Adults’ Risk of Hearing Damage from Selected Leisure Activities.” Ear and Hearing 34 (1):75–82. doi:10.1097/AUD.0b013e318262ac6c.
- Biassoni, E., C. M. R. Serra, M. Hinalaf, M. Abraham, M. Pavlik, J. P. Villalobo, C. Curet, S. Joekes, M. R. Yacci, and A. Righetti. 2014. “Hearing and Loud Music Exposure in a Group of Adolescents at the Ages of 14-15 and Retested at 17-18.” Noise and Health 16 (72):331–341. doi:10.4103/1463-1741.140515.
- Carhart, R, and J. F. Jerger. 1959. “Preferred Method for Clinical Determination of Pure-Tone Thresholds.” Journal of Speech and Hearing Disorders 24 (4):330–345. doi:10.1044/jshd.2404.330.
- Carroll, Y. I., J. Eichwald, F. Scinicariello, H. J. Hoffman, S. Deitchman, M. S. Radke, C. L. Themann, and P. Breysse. 2017. “Vital Signs: Noise-Induced Hearing Loss Among Adults – United States 2011-2012.” MMWR. Morbidity and Mortality Weekly Report 66 (5):139–144. doi:10.15585/mmwr.mm6605e3
- Chu, A., S. Orr, B. Moloughney, S. McFaull, K. Russell, and S. A. Richmond. 2019. “The Epidemiology of All-Terrain Vehicle- and Snowmobile-Related Injuries in Ontario.” Ontario Agency for Health Protection and Promotion (Public Health Ontario). Toronto, ON: Queen’s Printer for Ontario.
- Dalton, D. S., K. J. Cruickshanks, T. L. Wiley, B. E. K. Klein, R. Klein, and T. S. Tweed. 2001. “Association of Leisure-Time Noise Exposure and Hearing Loss.” International Journal of Audiology 40 (1):1–9. doi:10.3109/00206090109073095.
- Degeest, S., E. Clays, P. Corthals, and H. Keppler. 2017. “Epidemiology and Risk Factors for Leisure Noise-induced Hearing Damage in Flemish Young Adults.” Noise & Health 19 (86):10–19. doi:10.4103/1463-1741.199241.
- Dehnert, K., U. Raab, C. Perez-Alvarez, T. Steffens, G. Bolte, H. Fromme, and D. Twardella. 2015. “Total Leisure Noise Exposure and its Association with Hearing Loss Among Adolescents.” International Journal of Audiology 54 (10):665–673. doi:10.3109/14992027.2015.1030510.
- Depczynski, J., R. C. Franklin, K. Challinor, W. Williams, and L. J. Fragar. 2005. “Farm Noise Emissions During Common Agricultural Activities.” Journal of Agricultural Safety and Health 11 (3):325–334. doi:10.13031/2013.18575.
- Depczynski, J., K. Challinor, and L. J. Fragar. 2011. “Changes in the Hearing Status and Noise Injury Prevention Practices of Australian Farmers from 1994 to 2008.” Journal of Agromedicine 16 (2):127–142. doi:10.1080/1059924X.2011.554770.
- Ehlers, J, and P. Graydon. 2011. “Noise-induced Hearing Loss in Agriculture: Creating Partnerships to Overcome Barriers and Educate the Community on Prevention.” Noise & Health 13 (51):142–146. doi:10.4103/1463-1741.77218.
- Feder, K., J. McNamee, L. Marro, and C. Portnuff. 2021. “Personal Listening Device Usage Among Canadians and Audiometric Outcomes Among 6-29 Year Olds.” International Journal of Audiology 60 (10):773–788. doi:10.1080/14992027.2021.1878398.
- Feder, K., L. Marro, J. McNamee, and D. Michaud. 2019. “Prevalence of Loud Leisure Noise Activities among a Representative Sample of Canadians Aged 6-79 years.” The Journal of the Acoustical Society of America 146 (5):3934–3946. doi:10.1121/1.5132949.
- Feder, K., D. Michaud, J. McNamee, E. Fitzpatrick, H. Davies, and T. Leroux. 2017. “Prevalence of Hazardous Occupational Noise Exposure, Hearing Loss, and Hearing Protection Usage among a Representative Sample of Working Canadians.” Journal of Occupational and Environmental Medicine 59 (1):92–113. doi:10.1097/JOM.0000000000000920.
- Feder, K., D. Michaud, J. McNamee, E. Fitzpatrick, P. Ramage-Morin, and Y. Beauregard. 2017b. “Prevalence of Hearing Loss Among a Representative Sample of Canadian Children and Adolescents, 3 to 19 Years of Age.” Ear and Hearing 38 (1):7–20. doi:10.1097/AUD.0000000000000345.
- Gilles, A., G. Van Hal, D. De Ridder, K. Wouters, and P. Van de Heyning. 2013. “Epidemiology of Noise-induced Tinnitus and the Attitudes and Beliefs Towards Noise and Hearing Protection in Adolescents.” PLOS One.8 (7):e70297. doi:10.1371/journal.pone.0070297.
- Hamdan, A.-L., K. S. Abouchacra, A. G. Zeki Al Hazzouri, and G. Zaytoun. 2008. “Transient-Evoked Otoacoustic Emissions in a Group of Professional Singers Who Have Normal Pure-Tone Hearing Thresholds.” Ear and Hearing 29 (3):360–377. doi:10.1097/AUD.0b013e31816a0d1e.
- ISO. 1999:2013. “Acoustics—Estimation of Noise-induced Hearing Loss.” Geneva, Switzerland: International Organization for Standardization.
- Jerger, J. 1970. “Clinical Experience with Impedance Audiometry.” Archives of Otolaryngology 92 (4):311–324. doi:10.1001/archotol.1970.04310040005002.
- Johnson, A.-C, and T. C. Morata. 2010. “Occupational Exposure to Chemicals and Hearing Impairment.” The Nordic Expert Group for Criteria Documentation of Health Risks from Chemicals.” Work and Health Scientific Report Series: Occupational and Environmental Medicine at Sahlgrenska Academy, University of Gothenburg 44 (4):1–175. https://gupea.ub.gu.se/bitstream/2077/23240/1/gupea_2077_23240_1.pdf.
- Jokitulppo, J, and E. A. Bjork. 2002. “Estimated Leisure-Time Noise Exposure and Hearing Symptoms in a Finnish Urban Adult Population.” Noise Health 5:53–62. http://www.noiseandhealth.org/text.asp?2002/5/17/53/31834.
- Jokitulppo, J., M. Toivonen, and E. Bjork. 2006. “Estimated Leisure-Time Noise Exposure, Hearing Thresholds, and Hearing Symptoms of Finnish Conscripts.” Military Medicine 171 (2):112–116. doi:10.7205/milmed.171.2.112.
- Keppler, H., I. Dhooge, and B. Vinck. 2015. “Hearing in Young Adults. Part II: The Effects of Recreational Noise Exposure.” Noise & Health 17 (78):245–252. doi:10.4103/1463-1741.165026.
- Laffoon, S., M. Stewart, Y. Zheng, and D. K. Meinke. 2019. “Conventional Audiometry, Extended High-Frequency Audiometry, and DPOAEs in Youth Recreational Firearm Users.” International Journal of Audiology 58 (Sup1):S40–S48. doi:10.1080/14992027.2018.1536833.
- Lapsley Miller, J. A., L. Marshall, L. M. Heller, and L. M. Hughes. 2006. “Low-level Otoacoustic Emissions May Predict Susceptibility to Noise-induced Hearing Loss.” The Journal of the Acoustical Society of America 120 (1):280–296. doi:10.1121/1.2204437.
- le Clercq, C. M. P., G. van Ingen, L. Ruytjens, and M. P. van der Schroeff. 2016. “Music-Induced Hearing Loss in Children, Adolescents, and Young Adults: A Systematic Review and Meta-Analysis.” Otology & Neurotology 37 (9):1208–1216. doi:10.1097/MAO.0000000000001163.
- Leensen, M. C., J. C. van Duivenbooden, and W. A. Dreschler. 2011. “A Retrospective Analysis of Noise-Induced Hearing Loss in the Dutch Construction Industry.” International Archives of Occupational and Environmental Health 84 (5):577–590. doi:10.1007/s00420-010-0606-3.
- Liberman, M. C., M. J. Epstein, S. S. Cleveland, H. Wang, and S. F. Maison. 2016. “Toward a Differential Diagnosis of Hidden Hearing Loss in Humans.” PLOS One 11 (9):e0162726. doi:10.1371/journal.pone.0162726.
- McBride, D. I, and S. Williams. 2001. “Audiometric Notch as a Sign of Noise Induced Hearing Loss.” Occupational and Environmental Medicine Occupational and Environmental Medicine 58 (1):46–51. doi:10.1136/oem.58.1.46.
- McCullagh, M. C., T. Banerjee, A. Cohen, and J. J. Yang. 2016. “Effects of Interventions on Use of Hearing Protectors Among Farm Operators: A Randomized Controlled Trial.” International Journal of Audiology 55 (sup1):S3–S12. doi:10.3109/14992027.2015.1122239.
- McCullagh, M. C., S. L. Lusk, and D. L. Ronis. 2002. “Factors Influencing Use of Hearing Protection Among Farmers: A Test of the Pender Health Promotion Model.” Nursing Research 51 (1):33–39. doi:10.1097/00006199-200201000-00006.
- Marshall, L., J. A. Lapsley Miller, and L. M. Heller. 2001. “Distortion-Product Otoacoustic Emissions as a Screening Tool for Noise-Induced Hearing Loss.” Noise & Health 3 (12):43–60.
- Milz, S. A., J. R. Wilkins, A. L. Ames, and M. K. Witherspoon. 2008. “Occupational Noise Exposures Among Three Farm Families in Northwest Ohio.” Journal of Agromedicine 13 (3):165–174. doi:10.1080/10599240802406049.
- Mirza, R., D. B. Kirchner, E. R. Dobie, and J. Crawford. 2018. “ACOEM Guidance Statement: Occupational Noise-Induced Hearing Loss.” Journal of Occupational and Environmental Medicine 60 (9):e498–e501. doi:10.1097/JOM.0000000000001423.
- Mostafapour, S. P., K. Lahargoue, and G. A. Gates. 1998. “Noise-Induced Hearing Loss in Young Adults: The Role of Personal Listening Devices and Other Sources of Leisure Noise.” The Laryngoscope 108 (12):1832–1839. doi:10.1097/00005537-199812000-00013.
- Niskar, A. S., S. M. Kieszak, A. E. Holmes, E. Esteban, C. Rubin, and D. J. Brody. 2001. “Estimated Prevalence of Noise-Induced Hearing Threshold Shifts among Children 6 to 19 Years of Age: The Third National Health and Nutrition Examination Survey, 1988–1994, United States.” Pediatrics 108 (1):40–43. doi:10.1542/peds.108.1.40.
- Phillips, S. L., V. C. Henrich, and E. S. T. Mac. 2010. “Prevalence of Noise-Induced Hearing Loss in Student Musicians.” International Journal of Audiology 49 (4):309–316. doi:10.3109/14992020903470809.
- Pienkowski, M. 2017. “On the Etiology of Listening Difficulties in Noise Despite Clinically Normal Audiograms.” Ear and Hearing 38 (2):135–148. doi:10.1097/AUD.0000000000000388.
- Prasher, D, and W. Sulkowski. 1999. “The Role of Otoacoustic Emissions in Screening and Evaluation of Noise Damage.” International Journal of Occupational Medicine and Environmental Health 12:183–192. PMID: 10465908.
- Rabinowitz, P. M., M. D. Slade, D. Galusha, C. Dixon-Ernst, and M. R. Cullen. 2006. “Trends in the Prevalence of Hearing Loss Among Young Adults Entering an Industrial Workforce 1985 to 2004.” Ear and Hearing 27 (4):369–375. doi:10.1097/01.aud.0000224125.12338.9a.
- Rao, J. N. K., C. F. J. Wu, and K. Yue. 1992. “Some Recent Work on Resampling Methods for Complex Surveys.” Survey Methodology 18 (2):209–217.
- Rask-Andersen, H., L. Ekvall, A. Scholtz, and A. Schrott-Fischer. 2000. “Structural/Audiometric Correlations in a Human Inner Ear with Noise-induced Hearing Loss.” Hearing Research 141 (1–2):129–139. doi:10.1016/S0378-5955(99)00216-6.
- Rhee, J., D. Lee, H. J. Lim, M. K. Park, M. W. Suh, J. H. Lee, Y.-C. Hong, and S.-H. Oh. 2019. “Hearing Loss in Korean Adolescents: The Prevalence Thereof and Its Association with Leisure Noise Exposure.” PLOS One 14 (1):e0209254. doi:10.1371/journal.pone.0209254.
- Rhee J., D. Lee, M. W. Suh, J. H. Lee, Y. Hong, et al. 2020. “Prevalence, Associated Factors, and Comorbidities of Tinnitus in Adolescents.” PLOS ONE, 15: e0236723.
- Rust, K. F, and J. N. K. Rao. 1996. “Variance Estimation for Complex Surveys Using Replication Techniques.” Statistical Methods in Medical Research 5 (3):283–310. doi:10.1177/096228029600500305.
- Seixas, N., B. Goldman, L. Sheppard, R. Neitzel, S. Norton, and S. G. Kujawa. 2005. “Prospective Noise Induced Changes to Hearing Among Construction Industry Apprentices.” Occupational and Environmental Medicine 62 (5):309–317. doi:10.1136/oem.2004.018143.
- Seixas, N. S., S. G. Kujawa, S. Norton, L. Sheppard, R. Neitzel, and A. Slee. 2004. “Predictors of Hearing Threshold Levels and Distortion Product Otoacoustic Emissions Among Noise Exposed Young Adults.” Occupational and Environmental Medicine 61 (11):899–907. doi:10.1136/oem.2003.009209.
- Shargorodsky, J., S. G. Curhan, G. C. Curhan, and R. Eavey. 2010. “Change in Prevalence of Hearing Loss in US Adolescents.” JAMA 304 (7):772–778. doi:10.1001/jama.2010.1124.
- Shi, L., Y. Chang, X. Li, S. Aiken, L. Liu, and J. Wang. 2016. “Cochlear Synaptopathy and Noise-Induced Hidden Hearing Loss.” Neural Plasticity 2016:6143164. doi:http://dx.doi.org/10.1155/2016/6143164.
- Silva, V. G., C. Oliveira, P. L. Tauil, I. M. C. Silva, and A. L. L. Sampaio. 2017. “Amplified Music Exposure Carries Risks to Hearing.” International Journal of Pediatric Otorhinolaryngology 93:117–122. doi:10.1016/j.ijporl.2016.12.023.
- Smith, P., A. Davis, M. Ferguson, and M. E. Lutman. 2000. “The Prevalence and Type of Social Noise Exposure in Young Adults in England.” Noise & Health 2 (6):41–56. PMID: 12689478.
- Starck, J., E. Toppila, and I. Pyykko. 2003. “Impulse Noise and Risk Criteria.” Noise & Health 5 (20):63–73. Available from: https://www.noiseandhealth.org/text.asp?2003/5/20/63/31687.
- Statistics Canada 2015. Canadian Health Measures Survey Data User Guide: Cycle 3. http://www23.statcan.gc.ca/imdb-bmdi/document/5071_D4_T9_V2-eng.htm
- Tung, C.-Y, and K.-P. Chao. 2013. “Effects of Recreational Noise Exposure on Hearing Impairment Among Teenage Students.” Research in Developmental Disabilities 34 (1):126–132. doi:10.1016/j.ridd.2012.07.015.
- Twardella, D., U. Raab, C. Perez-Alvarez, T. Steffens, G. Bolte, and H. Fromme. 2017. “Usage of Personal Music Players in Adolescents and Its Association with Noise-Induced Hearing Loss: A Cross-Sectional Analysis of Ohrkan Cohort Study Data.” International Journal of Audiology 56 (1):38–45. doi:10.1080/14992027.2016.1211762.
- Vyskocil, A., T. Leroux, G. Truchon, F. Lemay, F. Gagnon, M. Gendron, A. Boudjerida, N. El-Majidi, and C. Viau. 2012. “Effect of Chemical Substances on Hearing. Interactions With Noise.” Institut de recherche Robert-Sauvé en santé et en sécurité du travail (IRSST), Studies and Research Projects, Report R-747. SBN: 978-2-89631-627-4 (PDF). https://www.irsst.qc.ca/media/documents/PubIRSST/R-747.pdf?v=2021-09-17
- Warner Henning, R. L., and K. Bobholz. 2016. “Distortion Production Otoacoustic Emissions in College Music Majors and Nonmusic Majors.” Noise & Health 18 (80):10–20. doi:10.4103/1463-1741.174372.
- Wei, W., S. Heinze, D. G. Gerstner, S. M. Walser, D. Twardella, C. Reiter, V. Weilnhammer, C. Perez-Alvarez, T. Steffens, and C. E. W. Herr. 2017. “Audiometric Notch and Extended High- Frequency Hearing Threshold Shift in Relation to Total Leisure Noise Exposure: An Exploratory Analysis.” Noise & Health 19 (91):263–269. doi:10.4103/nah.NAH_28_17.
- West, P. D, and E. F. Evans. 1990. “Early Detection of Hearing Damage in Young Listeners Resulting from Exposure to Amplified Music.” British Journal of Audiology 24 (2):89–103. doi:10.3109/03005369009077849.
- Williams, W., E. F. Beach, and M. Gilliver. 2010. “Clubbing: The Cumulative Effect of Noise Exposure from Attendance at Dance Clubs and Night Clubs on Whole-of-Life Noise Exposure.” Noise & Health 12 (48):155–158. doi:10.4103/1463-1741.64970.
- World Health Organization (WHO). 2021. “World Report on Hearing: Executive Summary.” 9789240021570-eng.pdf.
- World Health Organization (WHO). 2019. “New WHO-ITU Standard Aims to Prevent Hearing Loss Among 1.1 Billion Young People.” https://www.who.int/news-room/detail/12-02-2019-new-who-itu-standard-aims-to-prevent-hearing-loss-among-1.1-billion-young-people
- World Health Organization (WHO). 2015. “Hearing Loss Due to Recreational Exposure to Loud Sounds: A Review.” https://apps.who.int/iris/bitstream/handle/10665/154589/9789241508513_eng.pdf
- Zocoli, A. M. F., T. C. Morata, J. M. Marques, and L. J. Corteletti. 2009. “Brazilian Young Adults and Noise: Attitudes, Habits, and Audiological Characteristics.” International Journal of Audiology 48 (10):692–699. doi:10.1080/14992020902971331.