
 ?Mathematical formulae have been encoded as MathML and are displayed in this HTML version using MathJax in order to improve their display. Uncheck the box to turn MathJax off. This feature requires Javascript. Click on a formula to zoom.
Abstract
Objective
Distorted loudness perception is one of the main complaints of hearing aid users. Measuring loudness perception in the clinic as experienced in everyday listening situations is important for loudness-based hearing aid fitting. Little research has been done comparing loudness perception in the field and in the laboratory.
Design
Participants rated the loudness in the field and in the laboratory of 36 driving actions. The field measurements were recorded with a 360° camera and a tetrahedral microphone. The recorded stimuli, which are openly accessible, were presented in three conditions in the laboratory: 360° video recordings with a head-mounted display, video recordings with a desktop monitor and audio-only.
Study samples
Thirteen normal-hearing participants and 18 hearing-impaired participants with hearing aids.
Results
The driving actions were rated as louder in the laboratory than in the field for the condition with a desktop monitor and for the audio-only condition. The less realistic a laboratory condition was, the more likely it was for a participant to rate a driving action as louder. The field–laboratory loudness differences were bigger for louder sounds.
Conclusion
The results of this experiment indicate the importance of increasing realism and immersion when measuring loudness in the clinic.
Introduction
One of the common complaints of hearing-impaired (HI) participants with hearing aids is about loudness: some sounds are too loud, and others are not heard (Anderson, Gordon-Salant, and Dubno Citation2018). When participants are provided with hearing aids, the hearing aids are fitted and adjusted in the clinic with controlled acoustic situations and audiometric tests, which are far from reflecting real-life scenarios. These disparities between the clinic and the field may lead to inaccurate estimates of loudness perception and, in consequence, to inappropriate settings in the hearing aids (Keidser et al. Citation2008).
To overcome these problems, loudness-related measurements in the laboratory should become more ecologically valid (Keidser et al. Citation2020) than established methods, ie they should better reflect real-life loudness perception. Loudness perception differences between the field and the laboratory have rarely been studied, as the complexity of a field situation is rather difficult to reproduce in the laboratory. Among the few existing studies, the experiment of Smeds et al. (Citation2006) showed some interesting disparities between the field and the laboratory. Normal-hearing (NH) participants and participants with hearing loss were instructed to use research hearing aids in the field for a week. They could adjust the loudness through the volume control, and, when they did, the research hearing aid recorded the gain of the device and the sound pressure level of the field situation. Then, the participants were invited to the laboratory, where they had to adjust the volume of their research hearing aids, this time in a controlled audiovisual laboratory experiment. The stimuli in the laboratory, which consisted of recordings of a bushwalk, an office situation, a small gathering, a motorway and sawing wood with a power tool, were presented through a television screen and two frontal loudspeakers. The NH participants chose lower gains in the laboratory than in the field, whereas the participants with hearing loss did the opposite: they chose higher gains in the laboratory than in the field. Several explanations were given in the article, such as the difficulty of imagining being in a particular situation in the laboratory, the possibility of the participants with hearing loss using lower gains in the field because of undesired soft background noises and the possibility of the NH participants using higher gains in the field to compensate for the reduced frequency range of the hearing aids.
A key factor when measuring loudness perception in the laboratory is visual information: visual cues have been found to influence loudness perception. When sounds were presented together with congruent visual cues, they were usually perceived as less loud (Fastl Citation2004). In further experiments, the differences between immersive audiovisual simulations (i.e. a car simulator and videos via a head-mounted display) and audio-only reproduction were investigated. The loudness judgments, which were measured with a free-modulus magnitude estimation task, were decreased by about 15% in the immersive audiovisual simulations, in some individual cases by more than 50%. In free-modulus magnitude estimation, the participant is asked to assign a numerical value to the first stimulus. The following stimuli are rated consecutively relative to that number, eg if the first stimulus had a rating of 10 and the next one a rating of 5, that means a reduction of 50% for the second stimulus. These findings were confirmed in similar experiments, reviewed in Fastl and Florentine (Citation2011).
The aim of our work was to compare loudness perception for field and different laboratory setups and to further explore the factors influencing loudness perception in laboratory experiments. We measured loudness perception in the field and in the laboratory with the same participants. NH and HI participants were included, as the study of Smeds et al. (Citation2006) showed differences between these groups. We recorded the stimuli in the field and replicated them in the laboratory with different setups. The laboratory setups ranged from immersive experiences (head-mounted display and stereo audio) to more simple clinical setups (only audio with a single frontal loudspeaker), as we wanted to know which requirements a clinical setup should have to measure loudness perception as in the field.
The methods and results of the field experiment can be found in Llorach et al. (Citation2019) for the NH participants and in Oetting et al. (Citation2019) for the participants with hearing loss. Our work provides an addition to the findings of Smeds et al. (Citation2006), where a direct comparison between the stimuli in the laboratory and the field could not be done, due to the uncontrolled nature of the field situations and to the work of Patsouras (Citation2003), where there were no field measurements to compare to the audiovisual simulations. To the best of our knowledge, this is the first work that compares field and laboratory loudness perception using the same kind of stimuli and the same participants. Implications for fitting procedures for the participants with hearing loss are discussed in Oetting et al. (Citation2019).
Materials and methods
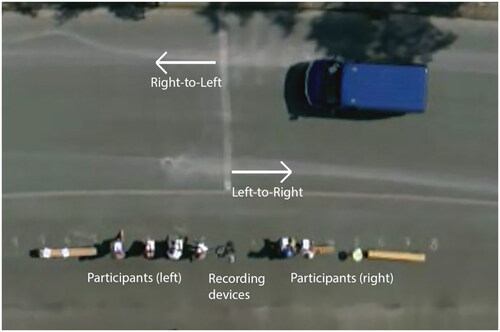
The participants were asked to rate the perceived loudness of different driving actions, using the response scale of the categorical loudness scaling (CLS) procedure (ISO 16832:2006 Citation2006) for loudness. The CLS uses an ordinal scale with name tags from “not heard” and “very soft”, to “loud” and “extremely loud”. The field experiment was conducted in a private street on a former military facility. The participants were distributed in four different sessions/dates. The listening positions were on a side of the street, and the participants rated the driving actions of four vehicles (see and ). These driving actions were recorded with a 360° camera (Xiaomi Mi Sphere Camera, Xiaomi, Hong Kong), a tetrahedral microphone (Core Sound TetraMic, Core Sound, LLC, Teaneck, USA), and a sound level metre.
Figure 1. Vehicles used in the experiment. From left to right: car (Opel Corsa 2016), motorbike (Suzuki VX 800 800 cc 1994), van (Ford Transit FT100 1999) and street sweeper (Kärcher MC 50). The figure is taken from Llorach et al. (Citation2019).
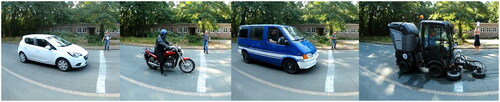
Figure 2. Setup of the field experiment. The figure is taken from Llorach et al. (Citation2019).
In the laboratory experiments, the recorded driving actions were played back in three conditions: (1) 360° video playback with a head-mounted display (HMD) and stereo audio with loudspeakers at ±60° (360VID); (2) video playback with a computer monitor and stereo audio with loudspeakers at ±60° (2DVID) and (3) audio-only with a frontal loudspeaker (AO).
With such a design it is not possible to discern the effect of visual cues independently, as the audio setup was different in the audio-only condition. Rather than measuring the effect of visual cues, this experiment compares two audiovisual setups and a setup (AO) that represents the simplest clinical setup for loudness measurements. Because the audiovisual setups had the same audio setup, a comparison between the two visual displays (HMD and computer monitor) was possible.
Participants
Thirteen NH participants (six female and seven male) and 18 participants with hearing loss (11 female and seven male) participated in the field and in the laboratory experiments. The NH participants had a pure-tone average across the frequencies 500, 1000, 2000 and 4000 Hz between −2 and 13 dB HL. The age of the NH participants ranged from 27 to 72 years with an average of 53.5 years. The pure-tone average of the HI participants was between 34 and 52 dB HL with an average of 42.4 dB HL. The difference between the pure-tone average of the left and right ears was below 15 dB, so all participants had symmetric hearing loss. The age of the HI participants ranged from 69 to 80 years with an average of 74.9 years. Ten HI participants were experienced with hearing aids and eight were new users. Phonak Audéo B90-312 hearing aids were fitted with trueLOUDNESS (program 1) and with NAL-NL2 (program 2) (Oetting et al. Citation2018). The two fitting methods were used as part of the experiment described in Oetting et al. (Citation2019). In this work, only the ratings with the trueLOUDNESS fitting were considered, which accounts for binaural loudness summation and aims at avoiding under- and over-amplification. In particular, to derive trueLOUDNESS gains, binaural broadband loudness summation was measured in each participant with hearing loss according to the procedure described in Oetting et al. (Citation2016), which employs loudness scalings of narrowband noise signals and the IFnoise, a wideband signal with the long-term speech spectrum. The approach of Oetting et al. (Citation2018) was then used to modify frequency-specific gains derived from narrowband loudness scaling by a binaural broadband gain correction taken from a 3D-gaintable (Oetting et al. Citation2018, ). The binaural broadband gain correction was fixed for an interaural level difference parameter of ΔL = 0 and a bandwidth parameter of B = 9.3, which corresponds to the bandwidth estimation for the speech shaped noise signal (IFnoise, Holube Citation2011), that was used to measure the binaural broadband loudness summation.
The gains for program 1 were adjusted according to the trueLOUDNESS gain calculations for levels of 50, 65 and 80 dB SPL of the IFnoise signal. An acoustician manually adjusted the gains to match the target trueLOUDNESS functions and the gain functions of the hearing aid. Program 2 used the fitting method NAL-NL2 and its corresponding software to calculate the gains.
Individual ear moulds (cShells, when possible) or domes (open, closed or power dome according to the recommendations of the Phonak fitting software) were used for acoustic coupling. In the laboratory experiments, the trueLOUDNESS fitting with the same hearing aids and earmolds as in the field experiment was used. More details of the hearing aid fitting and a description of the HI participants can be found in Oetting et al. (Citation2019). Ethical permission was granted by the ethics committee of the CvO Universität Oldenburg (Drs. 1r63/2016). The participants were recruited, contacted and reimbursed through Hörzentrum Oldenburg GmbH.
Stimuli
Four vehicles were used, which are shown in : a white car (Opel Corsa 2016), a red motorbike (Suzuki VX 800 800 cc 1994), a dark blue van (Ford Transit FT100 1999) and a street sweeper (Kärcher MC 50). Loudness for the first three vehicles was rated in 10 conditions (five driving actions, once on each side of the street). These actions were “stand by with the engine on”, “stand by to drive forward”, “pass by at 30 km/h”, “pass by at 50 km/h” and “brake until stopping”. The vehicles drove towards the end of the street and turned back, once out of the sight of the participants, to do the next driving action, this time on the other side of the street. For example, a vehicle would “stand by to drive forward” on the participant’s street side, reach the end of the street, turn back and “pass by at 30 km/h” on the other side of the street. Loudness ratings for the street sweeper were assessed for six driving situations (three actions, once on each side of the street): “stand by with the engine on”, “stand by with the brushes on” and “stand by to move and brush forward”.
Each driving action was repeated eight times (four sessions, test and retest for the NH participants and program 1 and program 2 for the participants with hearing loss). The drivers aimed to repeat the driving actions identically. The sound level for each driving action had an average standard deviation (SD) of 1.7 dB and a reliability coefficient of 0.96 (p < 0.001). The sound pressure levels of the driving actions were measured with a sound level metre (Nor140, Norsonic Tippkemper GmbH, Oelde-Stromberg, Germany) and were calculated as the maximum level in dB SPL in windows of 125 ms. The average level for each driving action is shown in .
Table 1. Vehicle driving actions with average maximum level in dB SPL (125 ms windows).
The recorded signals in the field were edited for the laboratory experiment. Out of the eight recordings for each driving action, the one that contained less noise and distractions (birds chirping, wind, coughing) was selected for each driving action, leading to 36 final recordings for the laboratory. Each driving action recording was edited and cut to last 12 seconds. The acoustic recordings of the Tetrahedral microphone were synthesised to a stereo format (XY microphone setup) using the VVMic software from VVAudio. The faces of the participants were blurred for anonymity in the video recordings of the 360° camera. The sound levels of the selected driving actions ranged from 67.8 to 94.6 dB SPL (maximum level in windows of 125 ms). The acoustic levels in the laboratory were adjusted using a sound level metre (Nor140, Norsonic Tippkemper GmbH, Oelde-Stromberg, Germany) to match the sound pressure levels recorded in the field. The sound level metre was placed at the approximate position of the participant’s ears in the laboratory. A global gain was set for all driving actions to adjust the sound levels. Due to the room acoustics of the laboratory and the signal differences between driving actions, variability of ±2 dB between the levels of the field and the laboratory was present. This sound level variability was not controlled for each driving action, as it was similar to the variability of the repetition of the driving actions (SD of 1.7 dB SPL). The audiovisual recordings of the driving actions for the laboratory experiment can be found in Llorach et al. (Citation2020)
Setup
In the field experiments, the participants sat on the side of the road where the vehicles were driving (see ). The participants sat on benches and chairs and they kept their sitting position for the whole experiment.
In the laboratory experiment, the participants sat on a chair in an acoustically treated room. They sat in the middle of a circle of 12 spectrally flat loudspeakers GENELEC 8030 BPM (Genelec Oy, Olvitie, Finland). The loudspeakers were at a distance of 1.2 m from the centre, at a height of 1.2 m and were located every 30°. Only the loudspeakers placed at ± 60° (stereo) and the frontal direction (mono) were used. For the 360VID and 2DVID conditions, the stereo loudspeakers were used. The frontal loudspeaker was used for the AO condition. In the 2DVID condition, the participants had a computer monitor in front of them, where the videos were displayed. The computer monitor was at an approximate height of 70 cm and within arm’s reach of the participant. This computer monitor was moved away from the participant in the other two conditions because they used the head-mounted display (HMD) for the 360VID condition and they did not have any visual stimuli in the AO condition. The head-mounted display was the HTC Vive (HTC Corporation, New Taipei City, Taiwan). The videos were reproduced with the “Media Player Classic - Home Cinema” software in condition 2DVID and with the “Steam 360 Video Player” in condition 360VID. The computer used Windows 10 with an NVIDIA Quadro M5000 graphics card. The participants had a button on their lap that would mute the playback, in case of emergency or extreme discomfort.
Procedure
Field experiment
The participants were distributed across four sessions, as there was a limited number of seats. In each session, all 36 driving actions were done, then there was a pause of 30 min, and the 36 driving actions were repeated. For the NH participants, this was a test and retest of the ratings. The participants with hearing loss were tested for the first 36 driving actions using the trueLOUDNESS fitting, and after the pause, the NAL-NL2 fitting.
The participants were instructed to rate the loudness of the driving actions. A researcher indicated the number of the driving action to rate when the driving action was being executed (see video recordings in Llorach et al. [Citation2020]). The indication was given to instruct the participants to rate the current action. This was especially important for the static driving actions, eg stand by, as they had to know that that was actually an action to be rated (the vehicles had to move to that position beforehand and that could be mistaken for a driving action). Once all participants had rated the current driving action, the next driving action was executed. The driving actions followed the order shown in and each vehicle did all its driving actions consecutively. The car started first, followed by the motorbike, the van and the street sweeper.
Laboratory experiment
The laboratory experiments used the same participants. The field and laboratory experiments were separated by approximately eight months. For the participants with hearing loss, the same hearing aids with the trueLOUDNESS fitting were used. An audiologist measured the audiometric threshold to detect changes relative to their previous audiograms (none were found) and assisted with the hearing aids during the experiment.
The HMD was shown and given to the participants to familiarise them with the technology. The interpupillary distance of the participants was measured and the HMD was adjusted correspondingly. The straps of the HMD were adjusted to the head of the participants while the driving actions of the car were shown through the device without sound. During this adaptation phase, the participants were asked to explore the 360° environment by head movements and to make themselves comfortable with the HMD. This phase lasted less than 2 min.
The order of the driving actions was the same as in the field experiment. The researcher who indicated the number of the driving action in its loudest instant in the field was visible in the videos. After each driving action, the video was paused until the participant indicated the perceived loudness. During this pause, the driving action number and the response scale were shown in the video, and no sounds were played back. In the 360VID condition, an additional letter was added for each loudness category in the questionnaire appearing in the video. In this way, the participants could answer verbally without taking off the head-mounted display. The order of the laboratory conditions was balanced (Latin square design): each condition was in first, second or third place the same number of times as the other conditions across participants.
Data processing
Not all participants experienced the same sound levels during the field experiment, as they were seated in different positions along the road (see ). The sound pressure levels that they experienced in the laboratory were different from the ones they were exposed to in the field for most driving actions, as the levels in the laboratory were not adjusted individually. We approximated the sound pressure level differences by assuming that the sound sources were omnidirectional and that there were no spectral differences. We used the following equation to compute the sound level differences:
(1)
(1)
where
is the calculated sound level difference between the recording device and the participant,
is the approximate distance between the position of the sound level metre and the position of the vehicle at its loudest instant of a driving action,
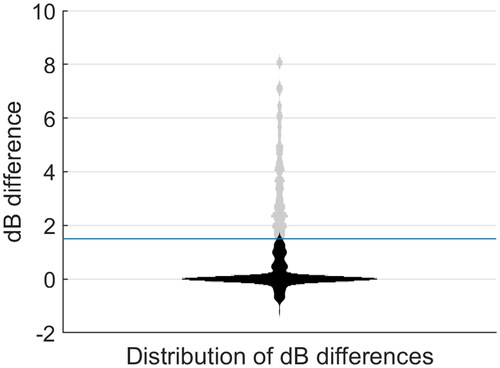
is the approximate distance between the sitting position of the participant and the position of the vehicle in its loudest instant of a driving action and sgn is the sign function, which determines if the dB difference is positive or negative. The driving actions that had equal levels for all participants (; 3A, 4A, 8A, 9A) had a 0 dB difference. The level differences between the laboratory and the field stimuli had an average value of 1.9 dB with a SD of 2.3 dB, with a range from −0.8 dB to 8.1 dB across all participants and driving actions.
We removed the ratings of the participants where the sound level difference was bigger than 1.5 dB. If a participant experienced a level difference above the set threshold according to our estimate, his/her loudness ratings of that driving action were removed for all conditions (field, 360VID, 2VID, AO). The value of the threshold was chosen to have a non-skewed distribution of level differences while preserving ratings for all participants and driving actions. Overall, 36% of the ratings were removed (19% NH, 17.0% HI), with a maximum of 61% for one participant. None of the 36 driving actions were completely removed. shows the distribution of the sound level differences.
Figure 3. Distribution of the sound level differences between the field and the laboratory for all ratings due to differences in sitting position and the driving actions. Grey indicates the differences for which ratings were removed. Black shows the differences for the remaining ratings. The criterion for removing the ratings for a given driving action is marked with a blue horizontal line.
Statistical analysis
The differences in loudness perception ratings were analysed with two different approaches: metric-model analysis (repeated-measures ANOVA and Bonferroni-corrected pairwise comparisons) and ordinal analysis (non-overlap of all pairs (NAP) (Parker and Vannest Citation2009) and group comparisons with Mann–Whitney U tests). The repeated-measure ANOVA analysed the effects on a group level and assumed that the rating data were metric, whereas the NAP measure analysed the effect size on an individual level and used the ordinal ratings. These two analyses were complementary: NAP scores only provided information about what happened with each participant, whereas the repeated-measures ANOVA analysed effects on a general level. The design of these two complementary approaches is described in this section.
The repeated-measures ANOVA indicated if the loudness ratings were affected by the condition, if there were differences between groups (NH vs HI), and if there were interactions between condition and group. For this analysis, each participant had four numerical values as the dependent variable (one for each condition, being the average of the loudness ratings for that condition) and a group factor (NH or HI). In other words, the within-subject factor was condition (Field, 360VID, 2DVID, AO) and the between-subject factor was hearing type (normal hearing or hearing impaired). To obtain a numerical value for each condition as the dependent variable, the loudness ratings of a given condition were averaged, of which there were 36 in the best case and 14 in the worst case due to data removal (see ). To average them, the loudness categories were transformed to a monotonically increasing numerical scale between 0 and 50 in steps of 5 for each loudness category/response alternative, as recommended by the ISO 16832:2006 standard. We assumed that the loudness categories were equidistant (see Discussion section). Because the NH participants gave ratings for two field measurements (test and retest), the mean of the test and retest rating was used to calculate the average rating for the field condition. For the participants with hearing loss, we used the field ratings that were done with the trueLOUDNESS fitting for the averaging, as the same fitting was used in the laboratory conditions. Bonferroni-corrected pairwise comparisons, if a main effect was found, indicated which conditions/groups were different from each other and the direction of the effect.
Metric-model analyses, such as ANOVA, are often used for analysis of behavioural ordinal data. Nevertheless, Liddell and Kruschke (Citation2018) showed that this can lead to errors. Therefore, we included NAP to measure the nonparametric effect size and to complement the metric-model analysis. NAP provided a score for a comparison between conditions for each participant, ie it compared the ratings in condition A to the ratings in condition B of a participant. Using confidence intervals, the NAP scores indicated how many participants rated a condition significantly louder, quieter, or similarly loud than another condition. The NAP scores of the NH and HI participants were compared with Mann–Whitney U tests to check if there were differences between groups.
The result of NAP is an intuitive number from 0 to 1: if all ratings in condition A are bigger than in condition B, the NAP score is 1; if all ratings are equal in the two conditions, the score is 0.5; if all the ratings for A are below the ratings for B, the score is 0. Six comparisons were done in the analysis: Field-360VID, Field-2DVID, Field-AO, 360VID-2DVID, 360VID-AO, 2DVID-AO. We modified the NAP formula to compare a driving action rating of condition A to its corresponding one in condition B, instead of comparing a rating of condition A to all the ratings in condition B. This was done because the loudness ratings of our experiment were paired: a rating in condition A had its equivalent in condition B. As a result, ratings of unrelated driving actions were not compared to each other. The modified formula is the following:
(2)
(2)
where k is the participant number, n is the number of driving action ratings (between 14 to 36 for each participant), TRT is the test/retest rating (two for NH participants and one for HI participants for the field condition, one for all other conditions), r is the rating of the driving action i, and A and B are the conditions being compared. The ratings were a numerical scale between 0 and 50 (the loudness categories were transformed to a numerical scale as recommended by ISO 16832:2006). For the HI participants, we selected the ratings of the field condition when the trueLOUDNESS fitting was used.
To determine if a NAP value was significantly above or below the chance level (0.5), the confidence intervals were computed. If the confidence intervals contained the 0.5 value, the two conditions being compared were not different from each other for that participant. Otherwise, the conditions compared were significantly different for that participant. The confidence intervals were computed using the standard error formulas proposed in Newcombe (Citation2006) in Method 6, namely:
(3)
(3)
where k is the participant number, and n is the number of driving action ratings for each participant. The confidence intervals were computed as
where z was defined as 1.645 for a confidence interval of 90%.
Group differences were analysed with Mann–Whitney U test using the NAP scores. Six Mann–Whitney U tests were done, one for each comparison of conditions. The test indicated if the differences of loudness perception between conditions were different for the NH and HI groups.
To understand the NAP results and the variability of the ratings better, an additional comparison between the field test and field retest of the NH ratings was added to the analysis.
Results
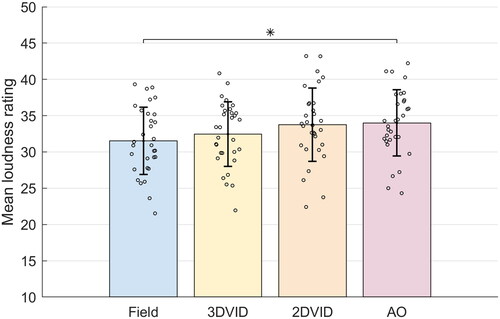
The results of the repeated-measures ANOVA are described as the following: Levene’s test showed that the variances for the dependent variable were equal. Mauchly’s test indicated that the assumption of sphericity was violated, χ2(5) = 14.504, p = 0.013, and therefore, the Greenhouse-Geisser correction was used. There was no interaction between condition and hearing type, F(2.214, 6.586) = 0.280, p = 0.781. Hearing type did not have a significant effect on the mean loudness ratings, F(1, 1.491) = 0.022, p = 0.882. The mean loudness rating differed significantly between conditions, F(2.243, 131.618) = 5.591, p = 0.004. Pairwise comparisons with Bonferroni correction showed that the mean loudness ratings for the field condition were significantly different from those for the AO condition (p = 0.018), but not from those for the 2DVID condition (p = 0.060) or the 360VID condition (p = 1.0). The laboratory conditions did not differ significantly from one another, according to pairwise comparisons. shows the distributions of the mean loudness ratings for the four conditions. Overall, the loudness ratings were slightly higher in the laboratory than in the field. The two laboratory conditions that were not significantly different from the field were the 360VID and the 2DVID, which included visual cues and stereo audio. The 2DVID condition, which was less immersive than the 360VID, was borderline non-significant (p = 0.06).
Figure 4. Distribution of the mean loudness ratings. Each bar has 31 black dots on top, one for each participant. Each dot is the mean of the loudness ratings of that participant for that condition (average of 14–36 ratings for each participant). Each bar represents the mean for each condition: Field, 360VID, 2DVID and AO. The vertical line in the middle of each bar indicates the standard deviation of the distribution. The one significant difference is indicated with an asterisk (p < 0.05).
For the ordinal analysis, NAP scores were computed for each individual and pairwise comparison (31 × 6). Additionally, NAP scores were computed for the test-retest field ratings of the 13 NH participants. To summarise each comparison, we report the number of participants that rated loudness significantly higher in condition A, the number of participants that did not rate loudness significantly different, and the number of participants that rated loudness significantly higher in condition B. Confidence intervals described in the previous section were used to determine if there was a significant difference. summarises the scores.
Table 2. Number of participants with a certain loudness perception difference or similarity between conditions.
According to NAP scores, loudness perception in the 360VID condition and the Field condition did not follow a specific tendency: 12 participants rated loudness higher in the 360VID condition and 10 participants rated loudness higher in the Field condition, as shown in . The differences between the field and the other two laboratory conditions indicated that loudness was usually rated higher in those laboratory conditions: 18 participants rated loudness higher in the 2D condition and 16 did in the AO condition, whereas only 5 participants rated loudness higher in the Field condition in comparison to the 2D and AO conditions (see ). The results of the repeated-measures ANOVA were somewhat in concordance with the NAP scores: the AO-Field difference was significant, while the 2D-Field difference was borderline significant (p = 0.06).
If a laboratory condition was less realistic, loudness was usually rated higher in that condition. Twelve participants rated loudness higher the 2D condition than in the 360VID condition, and five participants did the opposite. Similarly, 14 participants rated loudness higher in the AO condition than in the 360VID condition where 5 participants did the opposite. The difference between the 2D and AO conditions was less pronounced but in the same direction: eleven participants rated loudness higher in the AO condition than in the 2D condition, whereas six participants did the opposite. The pairwise comparisons of the repeated-measures ANOVA did not show significant differences between laboratory conditions.
Loudness in the laboratory conditions was similar for more participants than in the field versus laboratory comparisons (see ). In the comparisons between laboratory conditions, the number of participants with similar loudness ratings ranged between 12 (39%) and 14 (45%), whereas in the comparisons between laboratory conditions and the field, the number of participants ranged from 8 (26%) to 10 (32%) participants. When looking at the test-retest comparison of the NH participants, the relative number of participants with similar ratings was higher (7 out of 13 − 54%).
Six Mann–Whitney U tests (one for each comparison) were conducted using the NAP scores and the hearing type to determine if there were differences between groups. None of the tests showed significant differences. The U values ranged between 92 and 107, and the p values were between 0.326 and 0.704. The variances (Levene’s test) and normality (Shapiro–Wilk test) of the NAP scores were equal between groups.
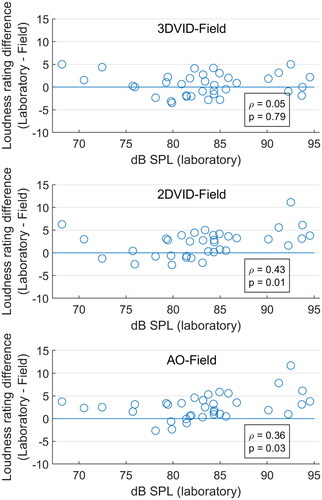
To assess whether these differences differed for loud and soft noises, we computed the correlation between the sound pressure level of the driving actions and the laboratory-field loudness rating differences. The loudness rating differences were computed between the field and the laboratory conditions for each driving action and participant. For each driving action we computed the average laboratory-field difference across participants, resulting into 36 data points. shows the loudness laboratory-field difference for each driving action. Each circle represents the difference for a driving action. The Spearman correlation coefficient between the 360VID-Field loudness rating differences and the sound pressure levels was 0.05 (p = 0.79), the 2DVID-Field loudness rating differences and the sound pressure levels was 0.43 (p < 0.01) and between the AO-Field loudness rating differences and the sound pressure levels was 0.36 (p = 0.03). If there were differences between the laboratory and the field ratings, these were higher when the sounds had a higher level. This correlation was only significant for the 2DVID-Field and the AO-Field differences.
Figure 5. Relationship between the sound levels and the laboratory–field differences in loudness ratings. Each circle (36 for each panel) represents the mean loudness difference for a driving action. The average is done between participants: 31 ratings or less due to data removal. The relationship with each laboratory condition is represented in a different panel: 360VID (top), 2DVID (centre) and AO (bottom). The Spearman correlation coefficient (ρ) and its p value are shown on the bottom-right of each panel. If the driving action circles are above zero, these driving actions were rated louder in the laboratory.
The loudness ratings of this experiment can be found in Llorach et al. (Citation2022).
Discussion
The vehicle driving actions were perceived as louder in the laboratory than in the field for the 2DVID condition (computer monitor and stereo loudspeakers), and for the AO condition (no visuals and a single loudspeaker): the repeated-measures ANOVA showed a significant difference between the AO condition and the field, and the NAP scores showed a higher percentage of participants rating the loudness in the 2DVID and the AO conditions higher than in the field.
When using immersive visual cues and stereo audio, loudness perception was similar in the field and in the laboratory: the 360VID condition showed similar loudness ratings to the field condition on average (no significant difference found in the metric-model analysis) and the NAP scores for the Field-360VID comparison were balanced (similar number of participants who rated one or the other condition as higher). The 360VID condition (HMD with 360° videos and stereo audio) was realistic enough to elicit the same loudness perception as in the field.
The results suggest that as the realism of the laboratory increased, the loudness ratings were lower and resembled more the ones from the field: the NAP scores for the comparisons between laboratory conditions showed that the least realistic condition had always a higher percentage of participants with higher loudness ratings (see ). Therefore, immersive and realistic simulations should be considered for clinical evaluations of loudness perception that target ecological validity.
When comparing the 360VID and the 2DVID conditions, only the visual cues changed (from a head-mounted display to a computer monitor). Using immersive visual cues instead of a computer monitor made participants rate loudness lower according to the NAP scores, in line with the literature (Fastl and Florentine Citation2011). Regarding the loudness differences between the AO condition and the two other laboratory conditions (360VID and 2DVID), which factor (visual cues or stereo audio) had more influence could not be determined: the 2DVID and 360VID conditions had visual cues and stereo audio and the AO condition used mono audio and no visual cues.
The loudness perception differences between the field and the laboratory became more apparent for higher sound levels in the AO and the 2DVID conditions, meaning that the field–laboratory differences might be more apparent when using intense stimuli and undetectable for low-level sounds. Clinical evaluations should pay special attention to these differences, as intense sounds are the ones that usually cause loudness discomfort.
Although the field–laboratory differences were small on average in terms of categorical units, these differences should be considered in the methods for measuring loudness perception and in hearing aid fitting procedures. According to Heeren et al. (Citation2013), the functions relating CUs and levels in dB SPL can have slopes of more than 0.1 CU per dB SPL. Although the field–laboratory rating differences found here were below one CU, these could be equivalent to 10 dB SPL in some situations. Gain adjustments in the hearing aid of that magnitude could influence listening comfort with hearing aids. As stated by van Beurden et al. Citation2018: “[…] there is need to adjust fitting rules for bilaterally fitted hearing aids to take the large individual differences in loudness summation into account”. Therefore, research institutes and clinical facilities should be aware that increasing the ecological validity of their methodologies may provide a better assessment of real-life hearing experiences and consequently better hearing aid fitting.
In the following paragraphs the limitations and challenges of comparing field and laboratory loudness perception are described. These should be considered when interpreting the results of this experiment.
Limitations
Making an exact replica of a field situation in the laboratory is very challenging, if not impossible (Keidser et al. Citation2020), and requires expensive equipment and expertise (Llorach et al. Citation2018). In this experiment, we tried to reproduce the field stimuli in the laboratory as accurately as possible using a setup that could be used in other labs or clinics. This means that marked differences between the laboratory and field setups were present and could have influenced the results.
The participants sat in different positions in the field experiment. They did not see and hear the same stimuli as the recording devices. By being in a different sitting position, the sound pressure levels, and the spectral shape of the driving actions changed. We tried to minimise this factor in the experimental design by doing the measurements in four sessions, in order to have fewer participants for each session and to have them sitting closer to the middle position and the recording devices. Nevertheless, we still had to remove about one third of the collected loudness ratings.
The driving actions were repeated eight times in the field and only one of those repetitions was used in the laboratory. Therefore, most participants did not experience the driving actions in the same way, as they were only present for two of those eight repetitions in the field. Nevertheless, the repetition of the driving actions was quite accurate in terms of sound pressure levels (Pearson correlation coefficient = 0.96, p < 0.001) (Llorach et al. Citation2019) and the test-retest reliability of the ratings of the NH participants was high (Spearman correlation coefficient = 0.85, p < 0.001) (Llorach et al. Citation2019). Therefore, the effect on the ratings may be minimal.
The driving repetitions with less background noise and distractions were selected for the laboratory stimuli and for the open data publication (Llorach et al. Citation2020). This selection was done to create stimuli that can be used in future experiments where the main content is the driving actions. Nevertheless, this curation of the material could have added a bias to the differences between the laboratory and the field, as the laboratory stimuli were the ones with less noise. Not enough data were collected to find out if a bias existed. But as mentioned before, the test-retest reliability of the ratings of the NH participants was high enough to consider that this bias, if present, was minimal.
The acoustic experience in the laboratory was not the same as in the field. In the laboratory, the sound came from one or two visible loudspeakers, and although the room was acoustically treated, it was not fully anechoic. Acoustic reflections, room modes and distance to the loudspeakers (Mershon et al. Citation1981) could have affected the loudness ratings and added variability to the field-equivalent sound pressure levels. We wanted the design of our laboratory experiment to be closer to a clinical test than an exact reconstruction of the field experiment. Therefore, we did not provide any acoustic context in the laboratory: in the field experiment, the participants heard the vehicles when they were getting ready for each driving action and there was background noise between driving actions. They could expect a certain loudness, which did not happen in the laboratory.
The field and laboratory experiments were separated by eight months due to technical preparations and time availability of the researchers. Separating two phases of this kind of experiment for such a long extent of time is not recommended. Hearing abilities may worsen, and participants may become unavailable for the second session after such a long time.
These differences and limitations between the laboratory and field experiment could explain the variabilities of the NAP scores in the ordinal analysis. There were no comparisons between conditions where all participants had the same tendency, ie all participants rated one or the other condition higher. The test-retest field comparison of the NH participants showed that 54% (7 out of 13) of the participants had similar ratings, as indicated by the NAP scores. The 360VID-Field comparison, where loudness perception was not significantly different, had only nine participants (29%) with similar ratings. It would be expected that the percentage of participants with similar ratings increases when loudness perception is similar. Nevertheless, the 360VID-Field comparison had a small percentage of participants with similar ratings.
The variability in the NAP scores can be explained by the differences and limitations between the field and the laboratory, but individual differences in loudness perception are a factor to consider. Previous literature has shown that there are individual differences in loudness perception within a homogeneous group. In fact, the trueLOUDNESS fitting is based on such individual differences: Oetting et al. (Citation2018) and found large individual differences in binaural loudness summation, a measure that is usually not considered when fitting hearing aids. Unfortunately, individual binaural loudness summation was not recorded for all participants and were not considered in this experiment. We considered hearing type, as Smeds et al. (Citation2006) found differences between NH and HI participants when measuring field–laboratory gain preferences. We did not find differences in loudness ratings between hearing groups, even though we had a bigger sample size. The repeated-measures ANOVA did not show a significant difference between groups nor interactions, and the Mann–Whitney U tests on the NAP scores of the condition comparisons did not show significant differences between groups. The general tendency in our experiment was that the loudness ratings were higher in the 2DVID and AO laboratory conditions than in the field for both groups. Smeds et al. (Citation2006) found a similar effect for the NH participants in a condition comparable to the 2DVID condition, ie NH participants chose lower hearing aid gains in the laboratory. In our study, the HI participants rated the stimuli as louder in the 2DVID conditions than in the field in opposition to what was found by Smeds et al. (Citation2006): HI participants chose higher gains in the laboratory than in the field. In Smeds et al. (Citation2006) participants were asked to set the preferred loudness, whereas in our study we asked them to rate perceived loudness. These two measures are different (preference vs perception) and could explain the differences found between the studies, eg NH and HI could have the same loudness perception in the laboratory, but the HI impaired chose to set the gains higher in Smeds et al. (Citation2006).
Categorical loudness scaling
In our experiment we did not follow some of the standard procedures of categorical loudness scaling described by ISO 16832:2006. For example, the whole audible range should be presented (from not heard to too loud) and each signal should be presented at five sound levels. In our experiment, the lowest sound level was well above the hearing level (>65 dB SPL) and each driving action was presented at the same level for each laboratory condition. These limitations should be taken into consideration when comparing the CU ratings to other studies using the same rating scale.
The standard procedure calculates the average of the sound levels that belong to a loudness category. In our case, we calculated the average of the loudness categories for a condition once these were transformed to a numerical scale, to be able to compare between conditions in the metric-model analysis (repeated-measures ANOVA). We assumed that the categorical units have a linear relationship with dB SPL and the loudness categories are equidistant, as suggested by ISO 16832:2006. The loudness function, ie the relationship between loudness categories and sound pressure levels, of narrowband noise signals has been fitted in previous work using two straight lines (Brand and Hohmann Citation2002). For binaural broadband noise signals, the loudness function tends to be a single straight line (Oetting et al. Citation2016). Therefore, the linear relationship between loudness categories and sound pressure levels can be justified.
Future work
Future work should test laboratory audiovisual conditions with participants who were not in the field, as the participants experienced the same actions in the field and in the laboratory. The hypothesis is that the rating differences between the audio-only and the audiovisual conditions will become significant and bigger, as in previous work (Fastl Citation2004). Another possible experiment would be to let the participants adjust the volume/gain of the stimuli, as in Smeds et al. (Citation2006). The hypothesis is that the chosen levels would be lower for the audio-only condition than for the audiovisual conditions and to the levels recorded in the field.
A further improvement to the study design would be to add other urban vehicles, such as electrical scooters. Such quieter vehicles would give references for the quieter categories of the loudness scale and thus increase its validity.
The 360VID condition of this experiment was the most realistic and the one that achieved similar loudness perception as in the field. Future research should test immersive audio reproduction techniques, eg Ambisonics or Vector Base Amplitude Panning, together with immersive visual cues. The hypothesis of such research would be that increasing the realism of an immersive simulation does not affect loudness perception, once the simulation is realistic enough to elicit ecologically valid loudness perception. Defining the “realistic enough” simulation could provide insightful indicators for clinical setups targeting ecological validity.
Acknowledgements
Thanks to Julia Schütze, Anja Kreuteler for helping conduct the experiments, to Petra von Gablenz for helping with the ordinal analysis and to Melanie Krüger for contacting the participants. Special thanks to the personnel of the old military facility.
Disclosure statement
No potential conflict of interest was reported by the author(s).
Additional information
Funding
References
- Anderson, S., S. Gordon-Salant, and J. R. Dubno. 2018. “Hearing and Aging Effects on Speech Understanding: Challenges and Solutions.” Acoustics Today 14 (4):10–18. doi:10.1121/AT.2018.14.4.12
- Brand, T., and V. Hohmann. 2002. “An Adaptive Procedure for Categorical Loudness Scaling.” The Journal of the Acoustical Society of America 112 (4):1597–1604. doi:10.1121/1.1502902
- Fastl, H. 2004. “Audio-visual Interactions in Loudness Evaluation.” In Proc. of Proc. Int. Congress on Acoustics ICA 2004, 18. Intern. Congress on Acoustics, Kyoto, Japan, Vol. II, 1161–1166. Acoustic Science and Technology for Quality of Life, 4.-09.04.2004. Ed.: Intern. Commission on Acoustics. https://mediatum.ub.tum.de/1138383
- Fastl, H., and M. Florentine. 2011. “Loudness in Daily Environments.” In Loudness, edited by M. Florentine, A. Popper, and R. Fay, Vol. 37, 199–221. Springer Handbook of Auditory Research. New York, NY: Springer. doi:10.1007/978-1-4419-6712-1_8.
- Heeren, W., V. Hohmann, J. E. Appell, and J. L. Verhey. 2013. “Relation between Loudness in Categorical Units and Loudness in Phons and Sones.” The Journal of the Acoustical Society of America 133 (4):EL314–EL319. doi:10.1121/1.4795217
- Holube, I. 2011. “Speech Intelligibility in Fluctuating Maskers.” Proceedings of the International Symposium on Auditory and Audiological Research 3: 57–64. https://proceedings.isaar.eu/index.php/isaarproc/article/view/2011-06.
- ISO 16832:2006. 2006. Acoustics—Loudness Scaling by Means of Categories. Geneva: International Organization for Standardization. https://www.iso.org/standard/32442.html.
- Keidser, G., G. Naylor, D. S. Brungart, A. Caduff, J. Campos, S. Carlile, M. G. Carpenter, et al. 2020. “The Quest for Ecological Validity in Hearing Science: What It Is, Why It Matters, and How to Advance It.” Ear & Hearing 41 (Supplement 1):5S–19S. doi:10.1097/AUD.0000000000000944
- Keidser, G., A. O’Brien, L. Carter, M. McLelland, and I. Yeend. 2008. “Variation in Preferred Gain with Experience for Hearing-aid Users.” International Journal of Audiology 47 (10):621–635. doi:10.1080/14992020802178722
- Liddell, T. M., and J. K. Kruschke. 2018. “Analyzing Ordinal Data with Metric Models: What Could Possibly Go Wrong?” Journal of Experimental Social Psychology 79:328–348. doi:10.1016/j.jesp.2018.08.009
- Llorach, G., G. Grimm, M. M. Hendrikse, and V. Hohmann. 2018. “Towards Realistic Immersive Audiovisual Simulations for Hearing Research: Capture, Virtual Scenes and Reproduction.” In Proceedings of the 2018 Workshop on Audio-visual Scene Understanding for Immersive Multimedia, Seoul, Republic of Korea, 33–40. New York, NY: Association for Computing Machinery. doi:10.1145/3264869.3264874
- Llorach, G., G. Grimm, M. Vormann, V. Hohmann, and M. Meis. 2020. “Vehicle Driving Actions for Loudness and Annoyance Perception.” [Dataset]. Zenodo. doi:10.5281/zenodo.3822311.
- Llorach, G., D. Oetting, M. Vormann, C. Fitschen, M. Krüger, M. Schulte, M. Meis, and V. Hohmann. 2022. “Loudness and Annoyance Ratings of Vehicle Noise.” [Dataset]. Zenodo. doi:10.5281/zenodo.6519277.
- Llorach, G., M. Vormann, V. Hohmann, D. Oetting, C. Fitschen, M. Meis, M. Krüger, and M. Schulte. 2019. “Vehicle Noise: Loudness Ratings, Loudness Models and Future Experiments with Audiovisual Immersive Simulations.” In INTER-NOISE and NOISE-CON Congress and Conference Proceedings, Madrid, Spain, Vol. 259, No. 3, 6752–6759. Institute of Noise Control Engineering. doi:10.5281/zenodo.4276090
- Mershon, D. H., D. H. Desaulniers, S. A. Kiefer, T. L. Amerson Jr, and J. T. Mills. 1981. “Perceived Loudness and Visually-determined Auditory Distance.” Perception 10 (5):531–543. doi:10.1068/p100531
- Newcombe, R. G. 2006. “Confidence Intervals for an Effect Size Measure Based on the Mann–Whitney Statistic. Part 2: Asymptotic Methods and Evaluation.” Statistics in Medicine 25 (4):559–573. doi:10.1002/sim.2324
- Oetting, D., J. H. Bach, M. Krueger, M. Vormann, M. Schulte, and M. Meis. 2019. “Subjective Loudness Ratings of Vehicle Noise with the Hearing Aid Fitting Methods NAL-NL2 and trueLOUDNESS.” Proceedings of the International Symposium on Auditory and Audiological Research 7: 289–296. http://proceedings.isaar.eu/index.php/isaarproc/article/view/2019-33.
- Oetting, D., V. Hohmann, J. E. Appell, B. Kollmeier, and S. D. Ewert. 2016. “Spectral and Binaural Loudness Summation for Hearing-impaired Listeners.” Hearing Research 335:179–192. doi:10.1016/j.heares.2016.03.010
- Oetting, D., V. Hohmann, J. E. Appell, B. Kollmeier, and S. D. Ewert. 2018. “Restoring Perceived Loudness for Listeners with Hearing Loss.” Ear and Hearing 39 (4):664–678. doi:10.1097/AUD.0000000000000521
- Parker, R. I., and K. Vannest. 2009. “An Improved Effect Size for Single-case Research: Nonoverlap of All Pairs.” Behavior Therapy 40 (4):357–367. doi:10.1016/j.beth.2008.10.006
- Patsouras, C. 2003. “Geräuschqualität von Fahrzeugen-: Beurteilung, Gestaltung und multimodale Einflüsse,” Dissertation, Shaker.
- Smeds, K., G. Keidser, J. Zakis, H. Dillon, A. Leijon, F. Grant, E. Convery, and C. Brew. 2006. “Preferred Overall Loudness. II: Listening through Hearing Aids in Field and Laboratory Tests.” International Journal of Audiology 45 (1):12–25. doi:10.1080/14992020500190177
- van Beurden, M., M. Boymans, M. van Geleuken, D. Oetting, B. Kollmeier, and W. A. Dreschler. 2018. “Potential Consequences of Spectral and Binaural Loudness Summation for Bilateral Hearing Aid Fitting.” Trends in Hearing 22:2331216518805690. doi:10.1177/2331216518805690