
Abstract
Objective
Several viruses are known to have a negative impact on hearing health. The global prevalence of COVID-19 means that it is crucial to understand whether and how SARS-CoV2 affects hearing. Evidence to date is mixed, with studies frequently exhibiting limitations in the methodological approaches used or the populations sampled, leading to a substantial risk of bias. This study addressed many of these limitations.
Design
A comprehensive battery of measures was administered, including lab-based behavioural and physiological measures, as well as self-report instruments. Performance was thoroughly assessed across the auditory system, including measures of cochlear function, neural function and auditory perception. Hypotheses and analyses were pre-registered.
Study samples
Participants who were hospitalised as a result of COVID-19 (n = 57) were compared with a well-matched control group (n = 40) who had also been hospitalised but had never had COVID-19.
Results
We find no evidence to support the hypothesis that COVID-19 is associated with deficits in auditory function on any auditory test measure. Of all the confirmatory analyses, only the self-report measure of hearing decline indicated any difference between groups.
Conclusion
Results do not support the hypothesis that COVID-19 infection has a significant long-term impact on the auditory system.
Introduction
While several viruses are known to negatively impact the auditory-vestibular system (Cohen, Durstenfeld, and Roehm Citation2014), and direct SARS-CoV-2 infection of the inner ear has been observed (Jeong et al. Citation2021), the extent to which COVID-19 is related to audio-vestibular sequelae remains unclear. Recent systematic reviews estimate the prevalence of post-COVID-19 hearing loss symptoms at around 3–4%, and post-COVID-19 tinnitus symptoms at around 5–10% (Almufarrij and Munro Citation2021; Beukes et al. Citation2021; Jafari, Kolb, and Mohajerani Citation2022; Lough et al. Citation2022). Lough et al. (Citation2022) estimated the prevalence of post-COVID-19 rotatory vertigo to be 2.4%. Most of the studies included in the reviews used self-report metrics, and the quality of these studies, where judged, was mostly considered “fair” (i.e. results deemed to be unbiased despite missing details). A systematic review from Meng et al. (Citation2022) concluded that it is still unclear whether COVID-19 increases the risk of sudden sensorineural hearing loss. The global, and ongoing, prevalence of COVID-19 (WHO Citation2022), means that it is crucial to increase our understanding of whether and how COVID-19 affects hearing.
The considerable challenges associated with conducting research during the COVID-19 pandemic, alongside the need for rapid publication of pandemic-related research, has meant that studies to date often feature understandable but significant limitations (Ioannidis et al. Citation2022; Kapp et al. Citation2022). Case-control studies investigating COVID-19 and hearing often show bias in selection of the control group or lack of details about the groups’ characteristics or selection. Small sample sizes are also common, as is incomplete reporting of methodology or results and lack of long-term follow-up. Within the bounds of these limitations, results from case-control studies have been mixed. Some report auditory deficits in COVID-19 patients, such as reduced otoacoustic emissions (Daikhes et al. Citation2020; Kokten et al. Citation2022; Mustafa Citation2020) and increased hearing thresholds (Gedik et al. Citation2021; Kokten et al. Citation2022; Mustafa Citation2020). Others find no significant impact of COVID-19 on auditory symptoms or hearing thresholds (Dror et al. Citation2021; Taitelbaum-Swead et al. Citation2022). While Dorobisz et al. (Citation2023) found reduced auditory function on a range of measures in a large group of patients with long-COVID versus healthy controls, the long-COVID group were selected on the basis of reporting post-COVID-19 hearing impairment, significantly limiting any conclusions that can be drawn from the comparison.
Other studies have focussed on differences between self-report measures in COVID-19 participants and controls, again with mixed results. Saunders et al. (Citation2022) found that those who had had COVID-19 were more likely to report new or worse auditory symptoms compared to controls. However, AlJasser et al. (Citation2022) found no significant difference in self-report of hearing or tinnitus symptoms between their COVID-19 and control groups, though their COVID-19 group were more likely to report rotatory vertigo (which is consistent with vestibular dysfunction). While the Saunders et al. (Citation2022) data are compelling due to a large group size, inclusion of control group and inclusion of both pre- and post-COVID-19 data, the authors themselves highlight the potential for bias, inconsistency and inaccuracy in self-report data, and hence the danger of drawing conclusions about causality (see also Saunders et al. Citation2023).
The present study overcomes many of the limitations present elsewhere. A relatively large sample of participants who were hospitalised as a result of COVID-19 infection was compared with a well-matched control group who had also been hospitalised but had never had COVID-19. Care was taken to recruit well-described, unbiased samples, and these groups were tested well beyond the typical COVID-19 recovery window. The use of a mobile research van for testing helped to remove barriers to participation, with the goal of increasing the diversity of participants. A comprehensive battery of auditory test measures was undertaken to thoroughly assess auditory ability and to isolate the specific loci of any COVID-19-related disorder. The combination of objective, behavioural and self-report measures recorded within the same set of participants represents the most comprehensive and thorough contribution from a single auditory study to date.
The protocol and hypotheses for the study were pre-registered (Guest et al. Citation2021). For each outcome measure, the prediction was that COVID-19 participants would show a deficit relative to control participants.
Materials and methods
Participants
Ninety-seven participants took part in the study; 57 in the COVID-19 group and 40 in the control group. Groups were matched for age, gender, body mass index (BMI) and time since hospital admission (see for summary).
Table 1. Summary of participant characteristics per participant group.
Information about specific COVID-19 variants was not available, and information about vaccine status was not sought. Extensive details of participant health and demographic characteristics can be found in theSupplementary Materials in the online repository for the project (https://osf.io/rc5fu/).
Participants were recruited primarily via the Cross Speciality Research Nursing team at the Manchester NHS Foundation Trust using inpatient and outpatient clinic hospital records. Additional participants were recruited via word of mouth and advertising. Advertisements for the study referred only to experience of hospitalisation and omitted mention of hearing health to avoid biasing responses. Inclusion criteria for participation were: aged between 18 and 70 years old; admitted to hospital at least once (but no more than twice) in 2020–2021; and no self-report of profound hearing loss. For inclusion in the COVID-19 group, participants must have been hospitalised for COVID-19. For inclusion in the control group, participants must have been hospitalised with any other (i.e. non-COVID) illness, and must not knowingly have had COVID-19 at any time. Control participants were admitted for a range of illnesses, predominantly for respiratory conditions (25 out of 40 participants). Details of reasons for hospitalisation can be found in the Supplementary Materials. The study was approved by the London Central NHS Research Ethics Committee (ref: 21/PR/0137).
Measures
Health and demographic data were collected by experimenters at the beginning of test sessions. Otoscopic examination and tympanometry were performed prior to all testing. Tympanometry was recorded with an Interacoustics Titan device, using a 226 Hz probe tone.
Outcome measures were categorised into three broad domains: cochlear function, neural function (peripheral and central) and auditory perception. Measures are described in detail below and are summarised in . Each measure was conducted in both ears where possible.
Table 2. Summary of outcome measures and their basic characteristics.
Cochlear function
Pure-tone audiometry (PTA). Testing took place in a sound-treated booth. Data collection was performed according to British Society of Audiology recommended procedures (British Society of Audiology Citation2018) at air conduction frequencies of 0.25, 0.5, 1, 2, 4, 8, 12.5 and 16 kHz and bone conduction frequencies of 0.5, 1 and 2 kHz, with appropriate masking applied to the non-test ear according to the recommended procedures. Testing took place using either an Interacoustics Callisto or Maico audiometer, with appropriately calibrated circumaural headphones (DD450 or HDA 300 respectively).
Distortion product otoacoustic emissions (DPOAEs). Measured using primary tones labelled f1 and f2, with a ratio (f2/f1) equal to 1.22. The following f2 frequencies were measured; 0.5, 1, 2, 4, 8 and 10 kHz (primary tone intensity levels used for f1 = 65 dB SPL and f2 = 55 dB SPL). This was recorded using the Interacoustics Titan device. For each frequency, a total recording time of 35 s was used, with frequencies tested in a descending order.
Neural function
Acoustic reflex thresholds (ARTs). Recorded ipsilaterally with the Interacoustics Titan device, in automatic screening mode, with threshold criterion set to sensitive (0.03 ml). Measured using wideband evoking stimulus (spectral properties: “As per ‘Broadband noise’ specified in IEC 60645-5, but with 500 Hz as lower cut-off frequency”), with a 226 Hz probe tone. Presentation started at 60 dB HL automatically increasing in 5 dB steps until two responses meeting the 0.03 ml criterion were observed at a single presentation level. Presentation stopped automatically once threshold was found or a maximum 100 dB HL presentation level was reached. The procedure was repeated twice and an additional, third time if there was ≥10 dB difference between the first two threshold measurements.
Auditory Brainstem Response (ABR). Testing took place in a sound-treated booth. ABRs were recorded using the Interacoustics Eclipse with ER3A insert phones. Appropriate correction for the sound wave delay due to the length of the insert tubing was included in the clinical interface. Stimuli were monaural 80 dB nHL broadband clicks presented at a rate of 11.1/sec. A two-channel recording was performed between the high forehead and both mastoids, using the ipsilateral mastoid recording when reporting results for a given ear. The ground electrode was on the low forehead. Online band-pass filtering of the EEG signal was applied between 0.1 and 2 kHz. A recording window of 0–15 ms was applied. The procedure was stopped after 5000 accepted epochs were recorded (with online artefact rejection of ±40 μV). Participants were in a reclined armchair for the duration of testing and instructed to keep their eyes closed, stay relaxed and to sleep if possible.
Auditory perception
Digits-in-noise (DiN) signal-to-noise ratio (SNR) for criterion performance of 71% (SNR71%) correct responses (Smits, Kapteyn, and Houtgast Citation2004). Testing took place in a sound-treated booth. Digit-triplet stimuli were presented monaurally via TDH 39 headphones driven by a Cakewalk UA25 EX sound card, with presentation controlled by custom MATLAB (The MathWorks Inc. Citation2021) code and listener responses delivered via mouse and screen. In each trial, three consecutive digits (excluding the digits with two syllables, zero and seven) were spoken by a female British-English talker. A speech-shaped-noise masker was fixed at a level of 70 dB SPL while the level of the digit-triplet targets varied adaptively. Two digits out of three had to be entered correctly, in the correct order, for a trial to be scored as correct and a two-down one-up stepping rule applied (therefore tracking the 71% correct point on the psychometric function). The adaptive track had four initial turn-points (6 dB step size) and six threshold turn-points (2 dB step size), with a starting SNR of 6 dB. SNR71% was calculated as the average of the SNRs at the final six turn-points. The ear to be tested first was randomly selected per participant. Participants were provided with a short practice run before data collection began.
The short form of the Speech, Spatial and Qualities of Hearing scale, the SSQ12 (Noble et al. Citation2013), consists of 12 items requiring participants to indicate how easily they are able to perform or experience a range of everyday listening scenarios, using a scale of 0 to 10. Additionally, participants were asked to indicate whether their ability to perform or experience each scenario was worse, the same, or better compared to one month prior to their hospitalisation. (See the questionnaire section below for full details of the scoring of questionnaire responses.)
Tinnitus change score. A binary change score was assigned to each participant to indicate whether or not tinnitus had worsened following hospitalisation. (Tinnitus was defined as prolonged spontaneous tinnitus, i.e. tinnitus that occurs spontaneously and lasts for longer than 5 min). Participants’ tinnitus was coded as having worsened (a tinnitus change score of 1) in any instance where (a) it was not present before hospitalisation but had occurred since, (b) it was occurring more frequently currently than before hospitalisation or (c) it was now present in both ears where previously it had only been in one. In all other cases participants were assigned a tinnitus change score of 0. Information about participants’ experiences of tinnitus was collected at the beginning of test sessions, as detailed in the sections below.
Questionnaires and other self-report measures
In addition to the SSQ12, all participants also completed the following questionnaires:
(i)Fatigue Assessment Scale (FAS, Michielsen et al. Citation2004). Participants completed this with reference to their present experiences at the time of taking part in the study.
(ii)Impacts of Illness and Hospitalisation (IIH). A custom, non-standardised questionnaire to assess impacts of illness and hospitalisation on social contact, loneliness, sleep, irritability, exercise, financial anxiety and depression/anxiety and depression (see Supplementary Materials for full details).
Participants also completed each of the following questionnaires if they met criteria for having experienced relevant symptoms, as defined in the section below:
(iii)Dizziness Handicap Inventory (DHI; Jacobson and Newman Citation1990)
(iv)Hearing Handicap Inventory for Adults (HHIA; Newman et al. Citation1990)
(v)Tinnitus Handicap Inventory (THI; Newman, Jacobson, and Spitzer Citation1996)
Before testing began, all participants provided information about their health and their experiences of illness and hospitalisation. For experiences of dizziness, hearing difficulties and tinnitus, participants provided information for both their current experience and that in the period of time before getting ill and going into hospital. For tinnitus, participants were provided with a definition of tinnitus and asked whether they had ever experienced it, whether the experience was for longer than 5 min at a time, and whether it occurred spontaneously (i.e. not only due to infection or noise exposure). Participants who reported prolonged, spontaneous tinnitus were additionally asked how often it occurred (with response options of “Most or all of the time”, “A lot of the time” and “Some of the time”), if it affected one or both ears and if the tinnitus pulsed. For hearing, participants were asked if they had any difficulty with their hearing, if they found it very difficult to follow a conversation in the presence of background noise and whether the difficulty affected one or both ears. For dizziness, participants were asked whether they suffered from attacks of dizziness in which things seemed to spin around them and whether they suffered from attacks of dizziness in which they seemed to move.
Which additional questionnaires participants were subsequently presented with was dependent on the responses given to the previous sets of questions. Participants were presented with the DHI if they had experienced attacks of dizziness, with the HHIA if they reported having experienced difficulty with their hearing and with the THI if they reported having experienced prolonged spontaneous tinnitus.
Each of the SSQ12, DHI, HHIA and the THI questionnaires were modified to include an additional metric for each item, to identify recent changes in experience. Directly following each standard questionnaire item, respondents were asked to indicate whether their current experience of the phenomenon in that item was “worse”, “the same” or “better” than it was one month prior to hospitalisation. For analyses, these responses were assigned a value of 1, 0, −1, respectively, and summed to provide an overall “change score”.
Measures are listed above to correspond with their order of appearance in the hypotheses listed in . The order in which tests were completed during test sessions was typically: Tympanometry, ARTs, DPOAEs, PTA, ABRs and DiN. Participants then completed questionnaires at the end of the session.
Procedure
Test sessions were completed either in a bespoke auditory mobile research van or in a lab on site at the University of Manchester, depending on participants’ availability and preference. When testing in the van, the tester would typically drive to, park and test outside the participants’ homes. The van included a single-walled sound-treated booth, and measurements of background noise at each location never exceeded 30 dB A. Background noise measurements were taken at the start of the test session using a type 2 sound level meter located where the centre of the participant’s head would be located. During the test, the experimenter (in the non-sound-treated control booth) would subjectively monitor noise levels for any aberrations (e.g. the rare occurrence of a large vehicle driving past) and would wait for the noise to cease before recommencing testing. The on-campus lab contained a double-walled sound-treated booth. Sixty-six participants were tested in the van (40 COVID-19; 26 controls) and 31 participants were tested in the lab on campus (17 COVID-19; 14 controls). All testing was conducted by two experimenters (authors AV and IJ).
All participants completed the same procedures, regardless of experimental group or testing environment (the range of questionnaires completed varied according to participants’ experiences, as detailed above). Testing was completed in a single session, typically lasting around 2 h. Participants were compensated for their time at a rate of £10 per hour.
Pre-processing
For all analyses, data points were averaged across ears per participant. Where data were missing for one ear, data from the single ear were used in place of the average across ears for that participant. The number of participants contributing data from both ears or from only one ear for each outcome measure can be seen in . Analysis of ABR data was performed in two steps, firstly using an algorithm to automatically detect peaks and troughs, followed by visual inspection and manual correction of misidentified peaks. Where no peak was observable in the waveform, an amplitude value of 0 was assigned, and no latency value was assigned. For ART/PTA/DPOAE measurements that exceeded the limits of the equipment an appropriate floor or ceiling value was used. In the questionnaire data, for cases where participants were not required to complete a questionnaire (if a participant did not report any experience of dizziness, for example, they would not have been given the DHI to complete) they were assigned a change score of “0” in analyses to reflect the fact that hospitalisation had not had any impact on their experience of problems or symptoms. Further information about pre-processing of data can be found in the Supplementary Materials.
Table 3. Summary of the number of participants contributing data in each test and the number of participants who completed each questionnaire.
Analyses
All processing and analyses were performed in R (R Core Team Citation2022), except for the processing of ABR data and automated peak-detection, which was conducted in MATLAB (The MathWorks Inc. Citation2021). Analyses are fully reproducible using the openly available code and de-identified data in the online repository for the project, which can be found at https://osf.io/rc5fu. Confirmatory analyses were pre-registered (Guest et al. Citation2021).
Confirmatory analyses
For our continuous outcome measures, ANCOVA was performed with participant group as a between subject factor, and with age, gender and number of nights spent in hospital as covariates.
For our single outcome measure with a binary outcome, change in tinnitus (Hypothesis 10), logistic regression was performed with participant group as a between subject factor, and with age, gender and number of nights spent in hospital as covariates.
N per test
summarises the number of participants included in statistical analyses for each test, and whether they contributed data from one or both ears. With one exception, missing test data for DPOAE and ART was due to either the presence of cerumen prohibiting testing and/or inability to obtain an adequate seal. The exception was one participant who requested to stop the test during data collection for ART. For the ABR wave I amplitude data, total missing ears consisted of 22 ears not tested due to cerumen, 15 due to an equipment fault (described fully in the Supplementary Materials), three which were excluded following manual inspection of the waveform revealing excessive noise, and one from a participant who found the experience uncomfortable and requested to stop before data were collected. For the ABR wave I-to-V interval data, missing ears were the same as for the amplitude data, plus an additional one ear which was not included in the analysis due to there being no identifiable wave I peak.
Results
Summaries for the models used for each hypothesis can be found in and .
Table 4. Model summaries for Hypotheses 1 to 9.
Table 5. Model summary for Hypothesis 10, change in tinnitus.
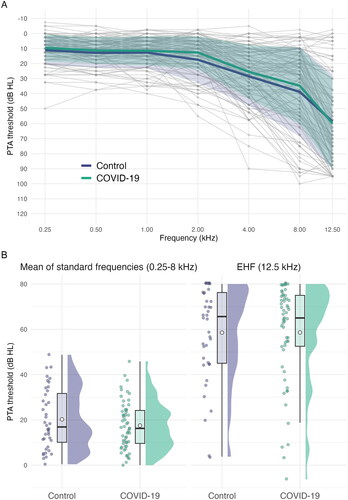
Hypotheses 1 & 2: PTA thresholds at standard frequencies (0.25 to 8 kHz) and EHF (12.5 kHz)
Pure-tone audiograms and average thresholds are shown in . A similar pattern of mild, high-frequency loss is present in both experimental groups. No statistically significant differences were found between groups at either standard or extended high frequencies. Age was significantly associated with higher thresholds at both standard (F(1, 92) = 39.66, p < 0.001; Eta2 (partial) = 0.30) and extended high frequencies (F(1, 92) =156.57, p < 0.001; Eta2 (partial) = 0.63). All other ps were > 0.05 and can be found in .
Figure 1. Panel A: Air conduction pure-tone thresholds. Grey lines and points represent individual participants. Bold, coloured lines show the means for each group at each frequency. Shaded ribbons around the bold lines show 1 SD from the mean. Panel B: Mean air conduction thresholds. Mean of standard (0.25–8 kHz) and extended high (12.5 kHz) frequencies. Jittered, coloured points show the raw data. Boxplot whiskers show 1.5 times the interquartile range. The hollow point inside boxplots shows the mean. Distribution curves show the probability density.
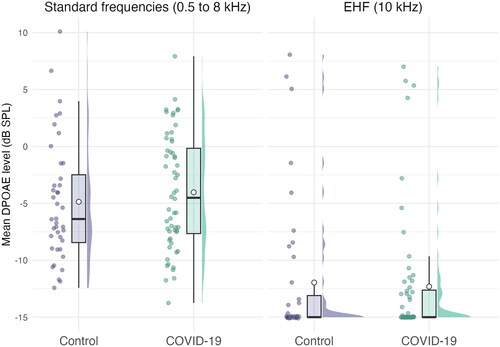
Hypotheses 3 & 4: DPOAE amplitudes at standard frequencies (0.5 to 8 kHz) and EHF (10 kHz)
Mean DPOAE amplitudes for standard and extended high frequencies are shown in . No statistically significant differences between COVID-19 participants and controls were observed for DPOAE amplitudes, at either standard or extended high frequencies. Age was significantly related to lower amplitudes at both standard (F(1, 91) = 53.63, p < 0.001; Eta2 (partial) = 0.37) and extended high frequencies (F(1, 91) = 38.54, p < 0.001; Eta2 (partial) = 0.30). All other ps were > 0.05, full details are shown in .
Figure 2. DPOAE levels: Means of standard (0.5 to 8 kHz) and extended high (10 kHz) frequencies. Jittered, coloured points show the raw data. Boxplot whiskers show 1.5 times the interquartile range. The hollow point inside boxplots shows the mean. Distribution curves show the probability density.
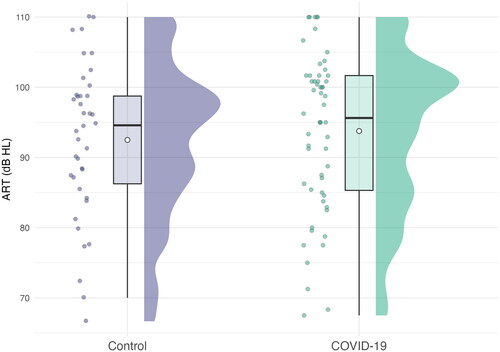
Hypothesis 5: ARTs
Mean ARTs for both experimental groups are shown in . Means and distributions of thresholds are similar across groups. No statistically significant differences were found between groups for ARTs. Greater age was associated with a significant increase in thresholds (F(1, 90) = 8.18, p = 0.005; Eta2 (partial) = 0.08). All other ps were > 0.05 and can be found in .
Figure 3. Mean ART. Jittered, coloured points show the raw data. Boxplot whiskers show 1.5 times the interquartile range. The hollow point inside boxplots shows the mean. Distribution curves show the probability density.
Hypothesis 6: ABR wave I amplitude
Peak-to-trough amplitudes for wave I and intervals for wave I to wave V peaks are shown in , as are waveforms for the grand means for each experimental group.
Figure 4. Panel A: Grand average waveforms for each group. Panel B: Wave I amplitude. Panel C: Wave I–V inter-peak interval. For panels B & C jittered, coloured points show the raw data. Boxplot whiskers show 1.5 times the interquartile range. The hollow point inside boxplots shows the mean. Distribution curves show the probability density.
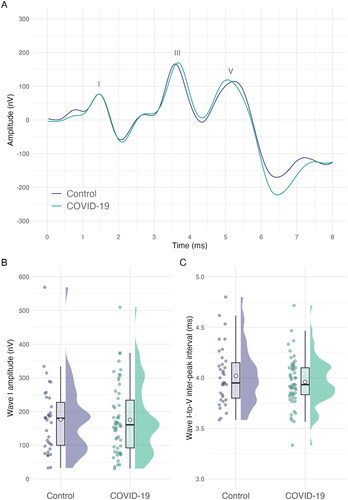
Amplitudes for wave I did not exhibit a statistically significant difference between the COVID-19 group and the control group. Wave I amplitudes were significantly larger for women than for men (F(1, 84) = 9.93, p = 0.002; Eta2 (partial) = 0.11) and significantly reduced with age (F(1, 84) = 45.03, p < 0.001, Eta2 (partial) = 0.35). All other ps were > 0.05, full details are shown in .
Hypothesis 7: ABR wave I–V inter-peak interval
The wave I–V inter-peak interval was not statistically significantly different between COVID-19 participants and controls. Age was significantly associated with a shortening of this inter-peak interval (F(1, 84) = 8.64, p = 0.004; Eta2 (partial) = 0.09). All other ps were > 0.05, full details are shown in .
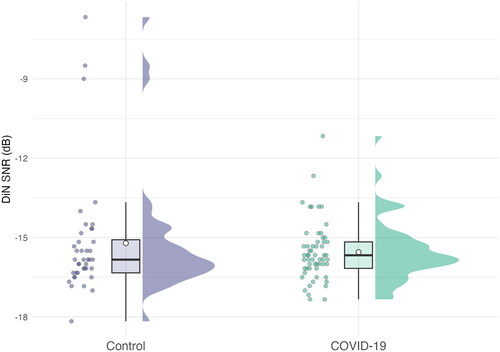
Hypothesis 8: DiN SNR71%
DiN SNR71% SNRs are shown in . No statistically significant difference in thresholds was observed between COVID-19 participants and controls. Age was significantly related to increased thresholds (F(1, 92) = 15.12, p < 0.001; Eta2 (partial) = 0.14). All other ps were > 0.05, full details are shown in .
Figure 5. SNR threshold for digits-in-noise test. Jittered, coloured points show the raw data. Boxplot whiskers show 1.5 times the interquartile range. The hollow point inside boxplots shows the mean. Distribution curves show the probability density.
Hypothesis 9: SSQ12 change score
Change scores for the SSQ12 are shown in . Distributions for both groups are concentrated around 0, indicating that the majority of participants did not report any overall change in experience (the range of the scale shows the maximum and minimum scores possible; a total score of +12 would show a participant reported worsening of experience on every item).
Figure 6. Total change scores on the SSQ12 questionnaire. Positive scores indicate a worsening of experience since hospitalisation. The range on the y-axis represents the minimum and maximum total scores possible. Jittered, coloured points show the raw data. Boxplot whiskers show 1.5 times the interquartile range. The hollow point inside boxplots shows the mean. Distribution curves show the probability density.
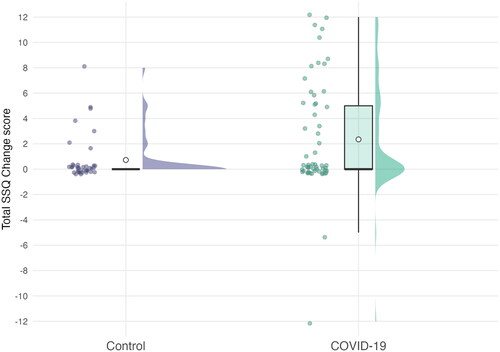
SSQ12 change scores differed between the COVID-19 and control groups. On average, COVID-19 participants reported that their hearing abilities and experiences had worsened on about two to three items (M = 2.35) out of 12, compared to only around one item (M = 0.74) out of 12 in the control group. This difference is statistically significant (F(1, 91) = 4.79, p = 0.031; Eta2 (partial) = 0.05), but would not survive adjustment for multiple comparisons when considered collectively with the other outcomes measured. All other ps were > 0.05, full details are shown in .
The SSQ12 contains nine “pragmatic” subscales which categorise the area of difficulty each item is associated with (e.g. speech in noise, multiple speech streams, etc., with some items referring to more than one subscale). Exploratory analysis of these subscales showed that the largest difference between groups was for the item associated with listening effort. For this item/subscale, approximately three in 10 participants in the COVID-19 group reported an increase in effort since hospitalisation, compared to only one in 10 participants in the control group.
Hypothesis 10: change in tinnitus
Across the sample, only four participants, all from the COVID-19 group, reported that their tinnitus had become worse since hospitalisation. Consequently, attempts to fit a logistic model to this data resulted in weak explanatory power (Tjur’s R2 = 0.07). No statistically significant effects were observed (all ps > 0.05, full details can be found in ).
Exploratory analyses
T-tests for questionnaire scores were performed to compare differences in responses between the COVID-19 group and control participant group. COVID-19 participants reported that their illness had had a greater overall impact on their lifestyle and mental state than control participants did, as assessed by the IIH questionnaire (t(94.18) = −3.58, p < 0.001; Cohen’s d = −0.74). In the HHIA, COVID-19 participants reported that their hearing problems had worsened after hospitalisation to a greater extent than control participants did (t(80.09) = −2.93, p = 0.004; Cohen’s d = −0.65). The COVID-19 group had a mean change score of 3.25 (out of a maximum of 25), compared to the control group mean of 0.82. For the remaining questionnaires (DHI, FAS, SSQ12 and the THI), comparisons of scores between COVID-19 and control groups produced p values > 0.05.
Participants provided ratings of their current general health and also for their general health as it was before being hospitalised. Ratings of pre-hospitalisation health did not significantly differ between groups. Both groups reported that their health was worse since hospitalisation than it was before, and the degree of change was significantly higher for COVID-19 participants than it was for controls (t(94.98) = 2.39, p = 0.019; Cohen’s d = 0.49), mirroring the finding in the IIH that illness and hospitalisation had had a greater impact.
To assess any potential impact of the test environment (i.e. research van or university lab), all analyses performed for the confirmatory hypotheses were repeated with the inclusion of test environment as an additional covariate. No statistically significant impact of test environment was observed for any of the test outcomes.
All data collected were included in analyses regardless of tympanometry outcomes for individual ears. The proportion of ears categorised as non-normal (e.g. negative pressure, low compliance, etc.) was the same in each group (15% of total ears). To assess any potential impact of including non-normal tympanometry outcomes, all confirmatory analyses were repeated on a subset of the data containing only ears categorised as normal during tympanometry. No statistically significant differences between participant groups were observed on any test or questionnaire outcome. This pattern of results is identical to that reported above, other than for the SSQ change score, for which a marginally significant difference between groups was observed in the main analyses above. All exploratory analyses can be found in the Supplementary Materials.
Discussion
The current study addressed a number of limitations found in existing studies of the effect of COVID-19 on hearing. Auditory measurements from COVID-19 participants were compared with those of tightly matched controls, following rigorous, pre-registered protocols and hypotheses. Bias was minimised at all stages, from advertising and recruitment of participants, through to the use of blinding where feasible in analyses of data. A comprehensive battery of auditory tests and questionnaires was undertaken, to probe the integrity of the auditory system at all levels. All outcome measures are reported and all findings are fully reproducible (de-identified data and code for analyses are publicly available, as detailed previously). We find no evidence that COVID-19 infection is associated with large-scale, long-term changes in auditory function.
This key finding is consistent with a recent comparison of hearing thresholds using PTA. Taitelbaum-Swead et al. (Citation2022) controlled for age and duration of time between before-and-after tests and reported no significant impact of COVID-19 on hearing thresholds in PTA. While some studies have found differences in auditory function (hearing thresholds or otoacoustic emissions) associated with COVID-19, these have had multiple limitations such as bias in group selection (Dorobisz et al. Citation2023; Mustafa Citation2020), absence of control group (Kokten et al. Citation2022) and incomplete reporting of methods or results (Daikhes et al. Citation2020; Gedik et al. Citation2021), which make it difficult to draw firm conclusions from the data.
In the current work, no statistically significant differences were observed between groups across any of the confirmatory analyses of auditory tests. A statistically significant difference (for the raw p value, 0.031, uncorrected for multiple comparisons) was found for the self-reported change score associated with the SSQ12. That is, COVID-19 participants tended to report greater declines in perceived hearing ability than control participants following hospitalisation, as measured by how many of the listening experience items on the questionnaire they reported had got worse since hospitalisation. In terms of the statistical significance of the difference between groups, this was a moderately sized effect (partial eta squared of 0.05). In absolute terms, a mean change score of 2.35 in the COVID-19 group and 0.73 in the control group is equivalent to participants reporting worsening, on average, on around 2 SSQ12 items out of 12 in the COVID-19 group and around 1 item out of 12 in the control group. Exploratory analysis of the pragmatic subscales in the SSQ12 showed the largest difference between COVID-19 and control groups to be in the category of “listening effort”.
While the mean difference between groups is small for SSQ12 change scores, the discrepancy between lab-based and self-report measures is an intriguing one. Findings elsewhere suggest that self-report of post-COVID symptoms and experience is a complex issue, in which disentangling the influence of psychosocial factors and recall bias is a substantial challenge (Saunders et al. Citation2022, Citation2023). Nonetheless, an experience of increased listening effort would tie in with a model of post-COVID auditory symptoms relating to wider post-viral effects, such as fatigue and cognitive impairment (National Institute for Health and Care Excellence Citation2020), rather than a specific pathology of the auditory system. The mean FAS score for both groups met that scale’s criterion for the presence of fatigue (threshold for the presence of fatigue is a total score of ≥ 22; the mean COVID-19 group score was 25.11, and the mean control score was 22.11). Ten of the COVID-19 group (18%) and 2 of the control group (5%) met the criterion for extreme fatigue (a total score of ≥ 35). In a similar pattern to the SSQ12 change scores, exploratory analysis of the HHIA change scores also revealed the COVID-19 group reported that their hearing problems had worsened to a greater degree than controls did, further indicating a greater perceived hearing deficit post-hospitalisation compared to the control group.
Deviations from protocol
One deviation from the registered protocol is noted. The sample recruited for the study was smaller than the registered target size (n = 96 per group), meaning our analyses are not as highly powered as originally planned. This point is discussed further in the limitations section below.
Limitations and future research
One potential limitation of the study is that the recruitment target of 96 people per group was not achieved. By the latter stages of the study, COVID-19 infection in the UK was so widespread that recruiting control participants who had never had the virus became a substantial challenge. Achieving the target sample would have increased statistical power, allowing for a greater degree of confidence in the outcomes of analyses and more accurate estimates of the size of significant effects. However, despite this limitation, distributions of data for each outcome show no obvious trends towards differences between groups, other than for self-reported SSQ12 and HHIA change scores. There is no indication in the data collected that larger group sizes would have led to statistically or clinically significant differences between groups on any other outcome measures.
The study aimed to achieve minimal bias between the two groups by ensuring that each had similar durations of recent hospitalisation, matching for age and gender and by imposing few other restrictions on inclusion. This resulted in unbiased but highly heterogeneous groups. Efforts were made to minimise bias in recruitment of the sample. Suitable candidates for the COVID-19 group were identified from lists of patients who had been admitted to COVID-19 and intensive care unit (ICU) wards. To obtain as close a match as possible for the control group, suitable candidates were identified primarily from lists of patients with non-COVID-19 respiratory illnesses and ICU admissions. Despite efforts to match characteristics across groups, differences in the experiences of the two groups remain a potential source of bias. Whether or not the participant had spent time in ICU was not systematically recorded, for example, and so any potential effects of this experience could not be confidently assessed (though no clear difference in ICU admission was apparent during collection of health and background information prior to test sessions). Similarly, further factors such as noise exposure, medical history and medications could also impact auditory function. While these factors were not routinely recorded in the current study, we have no reason to expect systematic differences between groups.
With increased prevalence of COVID-19 there is increased opportunity for studies to adopt within-participant designs. Direct assessment of individuals’ hearing before and after COVID-19 infection would be a more sensitive measure than the between-groups design used in the current work.
Information about specific COVID-19 variants was not available, and information about vaccine status was not asked. However, examination of participants’ hospitalisation dates shows that all of the COVID-19 group had already been hospitalised prior to the emergence of the Omicron (B.1.1.529) variant in the UK. Even the most recent participant to be hospitalised was admitted several weeks before the first reported case of the Omicron (B.1.1.529) variant in the UK. It also seems likely that a majority of the COVID-19 group were not vaccinated at the time of infection. Twenty-five percent of the group were hospitalised before the date of the first person to be vaccinated in the UK, and a further 25% were hospitalised within three weeks of this date, during which time only the very elderly and vulnerable were eligible to receive a vaccine.
Conclusions
The global prevalence of COVID-19, and the importance of hearing for human functioning, means it is crucial to understand whether and how the virus might affect hearing. The existing literature for the effects of COVID-19 paints a mixed and inconsistent picture, likely due to significant limitations in the methodological approaches used, the populations studied and substantial risk of bias. The current work is a rigorous examination of the potential auditory impacts of COVID-19, in which bias was minimised at all stages. The range of outcomes measured is the most comprehensive to date. All hypotheses, as well as testing and analysis procedures, were pre-registered, and data and analyses are accessible and reproducible.
Results do not support the hypothesis that COVID-19 infection has a significant long-term impact on the auditory system. This is important and welcome public health information. Self-report measures suggest it is not uncommon for patients to perceive changes in their hearing following COVID-19 infection, nor for them to attribute changes to the illness. Knowledge that self-perceived listening difficulties may have a basis beyond discernible physical changes in the auditory system can help health care professionals to provide appropriate counselling and management plans to support patients experiencing these difficulties.
Authors’ contributions
The original study idea was conceived by authors KJM, CJP and HG. All authors contributed to further development of the protocols, procedures and pre-registration. Authors ASV and IRJ completed data collection. Author IRJ performed the data analysis. Authors IRJ and ASV prepared the manuscript. Author IRJ prepared the materials for open sharing of data and analyses. All authors provided critical intellectual feedback to successive versions of the manuscript. All authors read and approved the final version of the manuscript. Joint first authorship is shared between ASV and IRJ.
Acknowledgements
We thank the participants in the study for generously volunteering their time to help with this work. We also thank the Cross Speciality Research Nursing team at the Manchester NHS Foundation Trust for their assistance with recruitment for the study.
Disclosure statement
No potential conflict of interest was reported by the author(s).
Data availability statement
Supplementary analyses, materials, code for analysis and de-identified data are available in the online repository for the project, which can be found at https://osf.io/rc5fu/, DOI: 10.17605/OSF.IO/RC5FU.
Additional information
Funding
References
- AlJasser, A., W. Alkeridy, K. J. Munro, and C. J. Plack. 2022. “Is COVID-19 Associated with Self-reported Audio-vestibular Symptoms?” International Journal of Audiology 61 (10):832–840. doi:10.1080/14992027.2021.1957161.
- Almufarrij, I., and K. J. Munro. 2021. “One Year on: An Updated Systematic Review of SARS-CoV-2, COVID-19 and Audio-vestibular Symptoms.” In International Journal of Audiology 60 (12):935–945. doi:10.1080/14992027.2021.1896793.
- Beukes, E., A. J. Ulep, T. Eubank, and V. Manchaiah. 2021. “The Impact of Covid-19 and the Pandemic on Tinnitus: A Systematic Review.” Journal of Clinical Medicine 10 (13):2763. doi:10.3390/jcm10132763.
- British Society of Audiology. 2018. Pure-tone Air-conduction and Bone-conduction Threshold Audiometry with and Without Masking. Online. Available at https://www.thebsa.org.uk/resources/pure-tone-air-bone-conduction-threshold-audiometry-without-masking/
- Cohen, B. E., A. Durstenfeld, and P. C. Roehm. 2014. “Viral Causes of Hearing Loss: A Review for Hearing Health Professionals.” Trends in Hearing 18:233121651454136. doi:10.1177/2331216514541361.
- Daikhes, N. A., O. V. Karneeva, A. S. Machalov, A. O. Kuznetcov, Y. M. Sapozhnikov, A. V. Balakina, L. N. Khulugurova, and V. L. Karpov. 2020. “Audiological Profile of Patients with SARS-Co-V-2 PCR-positive Cases.” Vestnik Otorinolaringologii 85 (5):6–11. doi:10.17116/otorino2020850516.
- Dorobisz, K., K. Pazdro-Zastawny, P. Misiak, A. Kruk-Krzemień, and T. Zatoński. 2023. “Sensorineural Hearing Loss in Patients with Long-findings Sensorineural Hearing Loss in Patients with Long-COVID-19: Objective and Behavioral Audiometric Findings.” Infection and Drug Resistance 16:1931–1939. doi:10.2147/IDR.S398126.
- Dror, A. A., N. Kassis-Karayanni, A. Oved, A. Daoud, N. Eisenbach, M. Mizrachi, D. Rayan, et al. 2021. “Auditory Performance in Recovered SARS-COV-2 Patients.” Otology & Neurotology 42 (5):666–670. doi:10.1097/MAO.0000000000003037.
- Gedik, O., H. Hüsam, M. Başöz, N. Tas, and F. Aksoy. 2021. “The Effect of Coronavirus Disease 2019 on the Hearing System.” The Journal of Laryngology & Otology 135 (9):810–814. doi:10.1017/S0022215121001961.
- Guest, H., I. Jackson, K. J. Munro, C. J. Plack, and A. S. Visram. 2021. Persistent Auditory Consequences of COVID-19: A Manchester Research Study (PACCMan). doi:10.17605/OSF.IO/2DSYW. Online (via OSF). Available at https://osf.io/2dsyw
- Ioannidis, J. P. A., E. Bendavid, M. Salholz-Hillel, K. W. Boyack, and J. Baas. 2022. “Massive Covidization of Research Citations and the Citation Elite.” Proceedings of the National Academy of Sciences 119 (28):e2204074119. doi:10.1073/pnas.2204074119.
- Jacobson, G. P., and C. W. Newman. 1990. “The Development of the Dizziness Handicap Inventory.” Archives of Otolaryngology-Head & Neck Surgery 116 (4):424–427. doi:10.1001/archotol.1990.01870040046011.
- Jafari, Z., B. E. Kolb, and M. H. Mohajerani. 2022. “Hearing Loss, Tinnitus, and Dizziness in COVID-19: A Systematic Review and Meta-analysis.” Canadian Journal of Neurological Sciences 49 (2):184–195. doi:10.1017/cjn.2021.63.
- Jeong, M., K. E. Ocwieja, D. Han, P. A. Wackym, Y. Zhang, A. Brown, C. Moncada, et al. 2021. “Direct SARS-CoV-2 Infection of the Human Inner Ear May Underlie COVID-19-associated Audiovestibular Dysfunction.” Communications Medicine 1 (1):44. doi:10.1038/s43856-021-00044-w.
- Kapp, P., L. Esmail, L. Ghosn, P. Ravaud, and I. Boutron. 2022. “Transparency and Reporting Characteristics of COVID-19 Randomized Controlled Trials.” BMC Medicine 20 (1):363. doi:10.1186/s12916-022-02567-y.
- Kokten, N., S. Celik, A. Mutlu, E. Pektas, S. Icten, and M. T. Kalcioglu. 2022. “Does COVID-19 Have an Impact on Hearing?” Acta Oto-Laryngologica 142 (1):48–51. doi:10.1080/00016489.2021.2020897.
- Lough, M., I. Almufarrij, H. Whiston, and K. J. Munro. 2022. “Revised Meta-analysis and Pooled Estimate of Audio-vestibular Symptoms Associated with COVID-19.” In International Journal of Audiology 61Issue (8):705–709. doi:10.1080/14992027.2021.1962552.
- The MathWorks Inc. 2021. MATLAB version: 9.11.0.1837725 (R2021b) Update 2. Natick, Massachusetts: The MathWorks Inc. https://www.mathworks.com
- Meng, X., J. Wang, J. Sun, and K. Zhu. 2022. “COVID-19 and Sudden Sensorineural Hearing Loss: A Systematic Review.” Frontiers in Neurology 13:883749. doi:10.3389/fneur.2022.883749.
- Michielsen, H. J., J. De Vries, G. L. Van Heck, F. J. R. Van de Vijver, and K. Sijtsma. 2004. “Examination of the Dimensionality of Fatigue: The Construction of the Fatigue.” Assessment Scale (FAS). European Journal of Psychological Assessment 20 (1):39–48. doi:10.1027/1015-5759.20.1.39.
- Mustafa, M. W. M. 2020. “Audiological Profile of Asymptomatic Covid-19 PCR-positive Cases.” American Journal of Otolaryngology 41 (3):102483. doi:10.1016/j.amjoto.2020.102483.
- National Institute for Health and Care Excellence. 2020. COVID-19 Rapid Guideline: Managing the Long-term Effects of COVID-19. NICE Guidelines. Online. Available at https://www.nice.org.uk/guidance/ng188
- Newman, C. W., G. P. Jacobson, and J. B. Spitzer. 1996. “Development of the Tinnitus Handicap Inventory.” Archives of Otolaryngology-Head & Neck Surgery 122 (2):143–148. doi:10.1001/archotol.1996.01890140029007.
- Newman, C. W., B. E. Weinstein, G. P. Jacobson, and G. A. Hug. 1990. “The Hearing Handicap Inventory for Adults: Psychometric Adequacy and Audiometric Correlates.” Ear and Hearing 11 (6):430–433. doi:10.1097/00003446-199012000-00004.
- Noble, W., N. S. Jensen, G. Naylor, N. Bhullar, and M. A. Akeroyd. 2013. “A Short Form of the Speech, Spatial and Qualities of Hearing Scale Suitable for Clinical Use: The SSQ12.” International Journal of Audiology 52 (6):409–412. doi:10.3109/14992027.2013.781278.
- R Core Team. 2022. R: A Language and Environment for Statistical Computing. R Foundation for Statistical Computing, Vienna, Austria. https://www.R-project.org/
- Saunders, G. H., E. Beukes, K. Uus, C. J. Armitage, J. Kelly, and K. J. Munro. 2022. “Shedding Light on SARS-CoV-2, COVID-19, COVID-19 Vaccination, and Auditory Symptoms: Causality or Spurious Conjunction?” Frontiers in Public Health 10:837513. doi:10.3389/fpubh.2022.837513.
- Saunders, G. H., E. W. Beukes, K. Uus, C. J. Armitage, and K. J. Munro. 2023. “Reporting of Auditory Symptoms over Time: (In)Consistencies, Expectations and the Nocebo Effect.” International Journal of Audiology 1–8. doi:10.1080/14992027.2022.2163429.
- Smits, C., T. S. Kapteyn, and T. Houtgast. 2004. “Development and Validation of an Automatic Speech-in-Noise Screening Test by Telephone.” International Journal of Audiology 43 (1):15–28. doi:10.1080/14992020400050004.
- Taitelbaum-Swead, R., A. Pinhas, S. C. Tsemah, H. Wechsler, and S. Chordekar. 2022. “Is COVID-19 to Blame for Sensorineural Hearing Deterioration? A Pre/Post COVID-19 Hearing Evaluation Study.” The Laryngoscope. doi:10.1002/lary.30400.
- WHO (World Health Organization). 2022. WHO Coronavirus (COVID-19) Dashboard. World Health Organization. online. https://covid19.who.int/.