
Abstract
Objective
Automated pure-tone audiometry is frequently used in teleaudiology and hearing screening. Given the high prevalence of age-related hearing loss, older adults are an important target population. This study aimed to investigate the accuracy of automated audiometry in older adults, and to examine the influence of test frequency, age, sex, hearing and cognitive status.
Design and study sample
In a population-based study, two age-homogeneous samples of 70-year-olds (n = 238) and 85-year-olds (n = 114) were tested with automated audiometry in an office using circum-aural headphones and, around 4 weeks later, with manual audiometry conducted to clinical standards. The differences were analysed for individual frequencies (range: 0.25–8 kHz) and pure-tone averages.
Results
The mean difference varied across test frequencies and age groups, the overall figure being −0.7 dB (SD = 8.8, p < 0.001), and 68% to 94% of automated thresholds corresponded within ±10 dB of manual thresholds. The poorest accuracy was found at 8 kHz. Age, sex, hearing and cognitive status were not associated with the accuracy (ordinal regression analysis).
Conclusions
Automated audiometry seems to produce accurate assessments of hearing sensitivity in the majority of older adults, but with larger error margins than in younger populations, and is not affected by relevant patient factors associated with old age.
Introduction
Pure-tone audiometry is the gold standard for measuring hearing sensitivity and for identifying the presence and degree of hearing loss. It is conventionally carried out manually by an audiologist–or other skilled operator–using standardised methodology, but automated protocols have existed for several decades and are increasing in popularity, especially in the light of the recent Covid-19 pandemic and the growing field of teleaudiology (Eikelboom et al. Citation2022). Automated pure-tone audiometry (AA) has the advantage of being more cost-effective and is therefore frequently used in hearing loss screening programmes as well as in population-based studies. Manually conducted pure-tone audiometry (MA) on the other hand, is generally viewed as being more reliable–owing to the possibility of the operator to adapt the method in response to the individual needs of the patient. This is especially important when it comes to more difficult-to-test populations, such as older individuals. However, the operator can also be a source of bias in MA (Margolis et al. Citation2016), through inconsistent application of the method. Clinical expectations or time constraints, e.g. may cause audiologists to deviate from protocols, thus influencing the test results. Human-error factors can be avoided with computerised automated procedures. Another important advantage of AA is that the test can be either self-administered, or administered by a general nurse, etc., hence not being dependent on the availability of audiological expertise–a scarcity in many parts of the world.
The first self-recording audiometer was introduced by Békésy (1947), with which hearing thresholds were determined using a continuous tone sweeping across the test frequencies and varying in intensity depending on the patient’s response to the stimulus (known as the “method of adjustment”). Some decades later, Sparks (Citation1972) introduced a computerised automated audiometer that incorporated a test protocol more similar to the one used in conventional manual pure-tone audiometry, where the stimuli are presented in a series of ascending or descending steps (“method of limits”). Nowadays, several different automated audiometers exist and have been validated in numerous settings and populations (Brennan-Jones et al. Citation2018; Skjönsberg et al. Citation2019; Swanepoel et al. Citation2010). Cumulative evidence from a systematic literature review (Mahomed et al. Citation2013) concluded that AA, whether using the method of adjustment or limits, has been demonstrated to have adequate validity, in terms of agreement with conventional pure-tone audiometry, as well as good test-retest reproducibility. The authors concluded that most studies have used small samples and that there is a lack of data for specific patient groups, such as the elderly.
Older adults are a major target for automated pure-tone audiometry, with age-related hearing loss being among the most prevalent disabling health conditions in the future (Chadha, Kamenov, and Cieza Citation2021). The prevalence of bilateral hearing loss is around 25% at 70 years of age and rises to 85% at the age of 85 years (Göthberg et al. Citation2021; Hoff et al. Citation2018). AA is frequently being used to assess hearing ability in this age group, e.g. in geriatric population-based studies, but few studies have reported on the validity of using an automated method in older populations specifically. As pure-tone audiometry is a psychoacoustic test method, its reliability and accuracy may be negatively affected by various patient factors, such as reduced alertness, impaired cognitive function and physical disability (Gelfand Citation2017), all of which are particularly prevalent in older adults.
The primary aim of the present study was to study the accuracy of automated pure-tone audiometry within the framework of the Gothenburg H70 Birth Cohort Study, in two age groups representing “younger” and “older” old adults (70 vs 85 years), selected from the general population. A secondary aim was to examine whether method-related factors (test frequency) and/or relevant patient-related factors (age, gender, hearing loss and cognitive status) influence the accuracy. Only air conduction thresholds were considered in this study and manual pure-tone audiometry was treated as the gold standard.
Methods
Participants
A total of 352 adults (n = 238 aged 70 years, n = 114 aged 85 years, 53% women) were included in the present study. The data were derived from two recent age-homogeneous birth cohorts within “The Gothenburg H70 Birth Cohort Study”, consisting of 70-year-olds born in 1944 and 85-year-olds born in 1930. Participants were investigated with automated pure-tone audiometry (AA) as part of the main investigation, and with conventional manual pure-tone audiometry (MA) in an extended audiological study performed on subsamples, during the years 2014–2016. A detailed account of the test protocols, the specific methods and the representativeness for these birth cohorts are available in separate publications (Rydberg Sterner et al. Citation2019; Wetterberg et al. Citation2022).
In brief, residents of Gothenburg that were aged 70 years in 2014, or aged 85 years in 2015, born on pre-specified dates, were identified through the Swedish Population Register and invited to participate in the investigation by letter and telephone. The 70-year-old participants were all new to the study (70 years being the baseline), whereas the 85-year-old cohort mostly consisted of participants who had been enrolled in the H70 study previously, now due for longitudinal follow-up. The response rates were 72% and 64% for the 70- and 85-year-old cohorts, respectively.
From each of these birth cohorts, a subset of participants also took part in an extended audiological investigation, on average around 4 weeks later. Seventy-year-old participants were “systematically” recruited to the extended study based on their date of birth, and out of 305 invited people, 251 participated. For further details, see the reference Hoff et al. (Citation2020). The 85-year-old participants were recruited “consecutively” to the extended study to ensure a large enough sample size. Out of 151 invited, 125 participated (Göthberg et al. Citation2023). Reasons for non-participation in both age groups included: “poor health”; “too good hearing”; “time constraints” or “tired of being tested”.
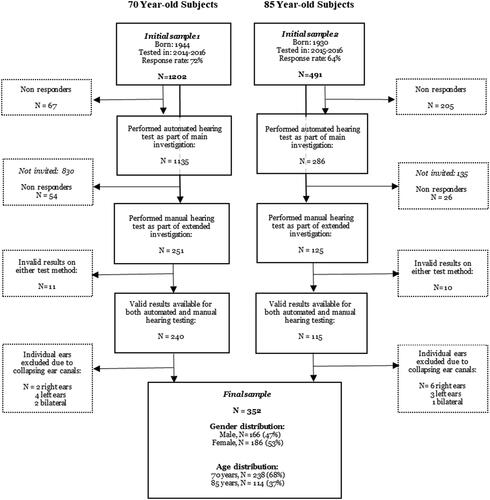
For the purpose of the present study, we selected all participants with valid results from both AA and MA. Moreover, individual ears that had significant air–bone gaps due to collapsing ear canals when tested with MA were excluded (i.e. isolated air–bone gaps in the high frequencies not consistent with middle ear pathology, the full definition is available in Hoff et al. Citation2020). The rationale for doing so was to ensure that the results from MA–being the reference test–were free from known biases. A schematic overview of the selection procedure is shown in .
Figure 1. Schematic overview of the selection procedure.
Test procedure
Automated pure-tone audiometry
Computerised AA was administered by trained research nurses in a quiet office in a research clinic. Ambient noise levels were measured and were found to comply with relevant standards (ISO Citation2010). However, a proportion of 85-year-old participants were tested in their homes because they were free to choose home visits. Regardless of where the test was conducted, the same equipment and test procedure was used. Ears were checked with a handheld otoscope prior to testing. The nurses made a note if obscuring wax was present, but it was not removed. Air conduction pure-tone thresholds (PTTs) were obtained with an Entomed SA 202IV audiometer in combination with sound-dampening Sennheiser HDA200 circum-aural transducers. Participants were seated facing away from the audiometer and were verbally instructed to press a response button each time they heard a tone, no matter how faint. Determination of the PTTs was made according to the “method of limits” principle, with a bracketing technique of descending and ascending stimulus tones, similar to the widely used Hughson Westlake method (Carhart and Jerger Citation1959). The test always started with a 40 dB HL tone at 1 kHz in the right ear, followed by 2, 3, 4, 6 and 8 kHz. Thereafter, 1 kHz was repeated (in the first tested ear only), followed by 0.5 and 0.25 kHz. Only air conduction thresholds were recorded. The lower limit of the audiometer was set to 0 dB HL and the upper to 90 dB HL.
Manual pure-tone audiometry
Manually conducted pure-tone audiometry was conducted by qualified audiologists in soundproofed test booths as part of an audiological examination, which also included speech tests, tympanometry, otoacoustic emissions measurements and auditory-evoked brainstem response testing. Otoscopy and a medical interview preceded the testing, and occluding wax was removed if present. PTTs were determined according to standardised test methodology (ISO Citation2010), with an Interacoustics Equinox AC440 audiometer. Air conduction PTTs were recorded with Telephonics TDH-39 headphones at eight test frequencies in the range of 0.25 kHz to 8 kHz and bone conduction thresholds with a B71 transducer at five test frequencies, 0.5 kHz to 4 kHz. The test always started in the better ear, as reported by the subject, with a clearly audible tone at 1 kHz. The test frequency order was the same as described for the automated method. Contralateral masking was used as and when required, using a plateau method. The test range was between −10 dB HL and 110 dB HL.
Other study variables
Data regarding global cognitive function was collected from the main investigation. As part of a clinical cognitive examination, cognitive function was rated in accordance with a Swedish-language version of the Mini Mental State Examination (MMSE) (Folstein, Folstein, and McHugh Citation1975). The examination was carried out by either a trained research nurse or a psychiatric nurse, and participants were instructed to use any hearing aids or spectacles during the assessment. Demographic variables, such as years of completed education and self-rated health, were also collected within the main investigation.
Data analyses
The accuracy of AA was investigated by assessing its agreement with MA, being the gold-standard method. The difference between the methods was calculated for each recorded PTT and was defined as “automated–manual”, where a positive value implies that the automated method underestimates the hearing threshold and conversely that a negative value overestimates the hearing threshold. In addition, we calculated the absolute differences between the methods, i.e. |“automated–manual”|, in accordance with the method described by Margolis et al. (Citation2010).
Pure-tone thresholds that could not be determined at the maximum test level (unreached thresholds) were coded as missing data and were excluded from the statistical analyses. The number of observations therefore vary across test frequencies and age groups. No statistically significant differences in accuracy were found between left/right ears (using Chi-squared tests based on the ordinal scale described further down, p > 0.05). For this reason, the graphs and tables of the present study show the average of left and right ears.
We used two approaches to statistically evaluate the accuracy of AA. First, a Bland–Altman analysis was made based on the four-frequency pure-tone averages of 0.5, 1, 2 and 4 kHz (PTA4). According to Bland and Altman (Citation2010), the agreement between two quantitative measures of the same variable can be examined by plotting the paired mean of the differences against the average of the two measures, known as a “Bland–Altman plot”. Theoretically, if the differences between two measures only arise from random measurement error, the mean difference would be zero and the distribution of differences would be normal. Applying this to experimental data, assuming it is approximately normally distributed, the mean difference can be interpreted as the “bias” of the new method and the ± 1.96 s.ds. are considered the “limits of agreement”, within which 95% of the differences would fall. If these limits are clinically acceptable, the two methods can be used interchangeably.
Histograms of the differences were produced to check that the assumption of normal distribution was fulfilled. We then calculated the mean differences and tested if they differed from zero with a one-sample t-test (Bland and Altman Citation2010), both for individual frequencies and for PTA4s. For the PTA4, we also examined whether the mean difference was constant along measurement levels, i.e. whether the bias was linearly related to the participants’ hearing levels, by fitting a regression line to the Bland–Altman plot and testing its statistical significance. The limits of agreement were calculated and were considered clinically acceptable if falling within ± 7.5 dB. On the basis of the short-term test–retest variability of individually measured pure-tone thresholds, a difference of >10 dB is required to indicate a significant shift. This figure is smaller if the shift occurs on several adjacent frequencies (Dobie Citation1983), which is why the limit of 7.5 dB was chosen as clinically acceptable for the PTA4 in the present study.
We also assessed the accuracy of AA by classifying the differences on an ordinal scale with five-scale steps, indicating varying levels of accuracy from perfect to poor, where 1 = no difference; 2 = difference within ± 5 dB; 3 = difference within ± 10 dB; 4 = difference within ± 15 dB and 5= difference > 15 dB. Furthermore, an ordinal regression analysis was conducted to test the influence of various factors on the accuracy of AA, using the ordinal scale described above as the outcome variable (for the PTA4 only). As explanatory variables, we considered age and gender (categorical data) and degree of hearing loss and cognitive status (PTA4 and Mini-mental State Examination score, both as continuous variables).
Statistical analyses were conducted using IBM SPSS for Windows version 25.0 and a local software, GIDSS (Geriatric Department’s Interactive Database and Statistical System). Statistical tests were considered significant if the p value was ≤ 0.05.
Ethics
The project was approved by the Regional Ethics Review Board in Gothenburg (reg.no. 869-13, and 976-13). All participants gave written informed consent and had the opportunity to discuss their test results with qualified clinicians.
Results
Sample characteristics
The final sample consisted of 352 adults (47% men, 53% women), of which 238 (68%) were aged 70 years and 114 (32%) were aged 85 years. Demographic and health characteristics of the sample are available in Supplementary Table 1. The educational level was high among participants, with half of 70-year-olds and a quarter of 85-year-olds having completed a University degree or equivalent. The MMSE scores were higher in the 70-year-olds than in the 85-year-olds. Among the older subjects (85 years), 15% scored ≤ 26 (possibly indicating cognitive impairment), compared to 6% among the younger (70 years) subjects. There were few significant differences between selected participants and the birth cohorts that they were derived from. However, the educational level was higher (p = 0.019 in 70-year-olds; p = 0.027 in 85-year-olds) and males were overrepresented in the older age group only (p < 0.001), as were participants with good self-rated health (p = 0.037) and high MMSE-scores, i.e. better cognitive health (Supplementary Table 1).
The distribution of PTTs in the sample, according to degree of hearing loss, is presented in Supplementary Figure 1. In 70-year-old subjects, just over half of PTTs were within normal limits (0–20 dB HL), and around 40% were of mild (21–40 dB HL) or moderate (41–70 dB HL) degree of hearing loss. Severe (71–89 dB HL) and profound (≥90 dB HL) degree affected only 5% of thresholds. The most common category in 85-year-old subjects was moderate degree (38%), followed by normal (21%), mild (18%), severe (12%) and profound (11%). Hearing losses were predominantly of sensory neural type, and less than 5% had conductive hearing loss.
Overall accuracy of automated pure-tone audiometry
The complete data material, including both 70- and 85-year-old subjects, consisted of 689 ears (344 right ears, 345 left ears) × 8 test frequencies, thus a total of 5512 differences. Of these, 5279 (96%) were valid. The remainder of the data (4%) was invalid due to PTTs being unreached at the maximum presentation level for one or both test methods. The overall mean difference between AA and MA was −0.7 dB (SD = 8.8 dB; p < 0.001), a figure including all test frequencies of men and women of both age groups. A histogram over the mean differences (Supplementary Figure 2) shows a normally distributed curve, illustrating that thresholds obtained with AA were better approximately as often as poorer, compared to MA. However, the pattern varied for individual test frequencies, as described further ahead. The differences ranged from −70 dB up to 70 dB, with <1% of automated PTTs deviating by ≥35 dB. The overall mean differences split by test frequency and age group are available in . The mean absolute difference between AA and MA was 6.1 (SD = 6.6) and 5.5 (SD = 6.6) dB for the younger (70 years) and older (85 years) age group, respectively.
Table 1. Mean differences between automated and manual pure-tone audiometry by age group and test frequency, averaged between left and right ears.
Accuracy of automated pure-tone averages
Valid differences between PTA4s were available for 96% of 70-year-old and 86% of 85-year-old subjects, and ranged between −28.75 and 25.25 dB. The mean differences were similar in younger and older subjects: −1.6 dB (SD = 5.2, p < 0.001) in 70-year-olds and −1 dB (SD = 4.7, p = 0.005) in 85-year-olds. The mean absolute difference of the PTA4 was 5.4 dB in the younger (70 years) and 5.2 dB in the older (85 years) subjects.
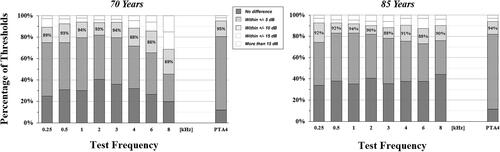
The equivalent information is graphically represented in the form of Bland–Altman plots in mean difference was negatively associated with the PTA4 in the 70-year-old subjects (β = −0.16, p = 0.001), indicating that the accuracy of AA may vary depending on the degree of hearing loss. No such association was found in the 85-year-old subjects (β = −0.07, p = 0.360). In 70-year-old subjects, the upper limit of agreement was 8.6 dB and the lower limit was −11.7 dB. For 85-year-olds, the equivalent figures were 8.2 and −10.2 dB. These values exceed the pre-specified clinically acceptable limits. Furthermore, shows that around 80% of PTA4s corresponded within ± 5 dB, around 95% within ± 10 dB, around 98% within ± 15 dB and thus that 2% to 3% deviated by more than 15 dB. The distribution was very similar among 70-year-old and 85-year-old subjects.
Figure 2. Bland–Altman plots of the difference in pure-tone averages of 0.5, 1, 2 and 4 kHz (PTA4s) obtained with manual and automated pure-tone audiometry. The mean difference (continuous black line) is near zero for both age groups. The dashed lines show the upper and lower limits of agreement, i.e. the mean difference ± 1.96 SD, within which 95% of differences are expected to fall.
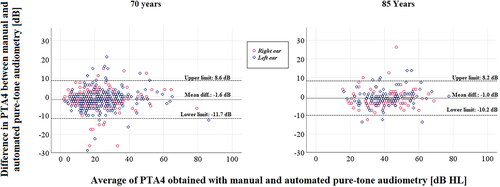
Figure 3. Distribution of threshold correspondence within 0, 5, 10, 15 and >15 dB by test frequency and age. The percentages displayed on the bars in the chart specify what proportion of values were within ± 10 dB difference, which is considered clinically accepted.
Accuracy by test frequency
Mean differences as well as mean absolute differences along with associated standard deviations, are presented by test frequency in . The proportion of missing data due to unreached PTTs was high in the highest frequencies of 85-year-olds, peaking at 52% at 8 kHz. For 70-year-olds, the mean difference was statistically equal to zero (p > 0.05) at 2, 3 and 4 kHz. The magnitude of the mean differences were lowest in the mid frequencies and higher in the low and high frequencies, range: −3.4 to 6.2 dB. For the 85-year-old participants the mean difference was equal to zero at 0.25, 0.5, 2 and 4 kHz, smaller than zero at 1 and 6 kHz and larger than zero at 3 and 8 kHz. Among significant mean differences, there was a slight trend of negative values, indicating that AA on average yielded lower thresholds. The mean absolute difference ranged from 4.8 dB to 10.1 dB in the 70-year-olds and from 4.8 dB to 6.5 dB in the 85-year-olds.
shows that, for 70-year-old subjects between 45% and 82% of the automated PTTs corresponded within ± 5 dB of the manual PTTs. Moreover, 69–94% of automated PTTs corresponded within ± 10 dB and 85–98% within ± 15 dB of manual PTTs. The lower percentages, thus poorer accuracy, were found mainly at 8 kHz and to some extent at 6 kHz. In 85-year-olds, the correspondence was within ± 5 dB for 73–83%, within ± 10 dB for 88–93% and within ± 15 dB for 94% to 97%, with a more consistent level of accuracy across test frequencies.
Factors influencing the accuracy
The slightly triangular pattern of the Bland–Altman plot () in 70-year-old subjects indicates that there was larger variability, thus poorer accuracy of AA, in participants with lower PTA4s (better hearing). In 85-year-olds the variability of differences was more constant across the span of hearing threshold levels. However, in the ordinal regression analysis with the accuracy of AA classified on an ordinal scale, no significant association was found with the PTA4 (95%CI of OR= 0.9–1.1). Furthermore, none of the other explanatory variables: age, gender and MMSE-score, were associated with the accuracy of AA in the bivariate or multivariate analyses. Odds ratios for each of these variables are reported in .
Table 2. Results of a multiple ordinal regression analysis with the accuracy of automated audiometry as the dependent variable.
Discussion
Main findings
In the present study, we attempted to address whether computerised AA is an accurate method, in terms of its agreement with MA, when measuring hearing sensitivity in older adults–a patient group who could indeed benefit from easier access to hearing assessments. The overall results demonstrate that AA, administered by nurses in a non-soundproofed office environment using sound-dampening transducers, yielded results that were within normal error margins of conventional pure-tone audiometry, for the majority. Roughly 90% of all PTTs that were measured with AA in this study corresponded within ± 10 dB of the equivalent PTTs determined with MA, and the mean differences were reasonably close to zero at most test frequencies. Furthermore, we investigated the impact of relevant patient-related factors, such as age, gender, degree of hearing loss and cognitive function, on the accuracy, something that–to our knowledge–has not been done in previous studies on AA. The fact that these factors did not affect the results in any consistent fashion suggests that AA has the potential to be useful in a variety of settings. These results constitute a valuable addition to the current evidence based on the topic of automation in hearing testing by providing population-based (rather than experimental) data and by providing an important perspective on issues pertaining to automated hearing testing in older adults specifically.
Agreement between methods
Although the mean differences between AA and MA were statistically significant at several test frequencies, something that is more likely to occur with large sample sizes, the deviations in dB from zero were reasonably small. The directions of the significant mean differences were mostly negative, indicating that AA yielded better PTTs (lower dB levels). Somewhat surprisingly, the opposite was true at 8 kHz in both age groups (). We expected that the supra-aural headphones used for MA would lead to generally poorer high frequency PTTs than the circum-aural headphones used for AA, due to a higher rate of collapsing ear canals seen in older adults. Admittedly, some ears with significant air–bone gaps caused by collapsing ear canals were excluded from the analyses (see ), but misleadingly poor high frequency hearing could still be present in the sample, since bone conduction thresholds cannot be measured at 6–8 kHz.
The standard deviations of the differences () in our study somewhat exceeded normal test–retest limits for pure-tone audiometry, which are reported to be in the range from 2 dB to 8 dB (Dobie Citation1983; Lemkens et al. Citation2002; Schmuziger, Probst, and Smurzynski Citation2004) for MA, and similar for AA (Eikelboom et al. Citation2013; Swanepoel et al. Citation2010). The test–retest reliability, however, may vary depending on which transducers are used, and whether background noise is present or not, etc. In addition, higher variability has been demonstrated in older adults (Landry and Green Citation1999).
Larger standard deviations–thus poorer accuracy of AA–were observed in the highest frequencies (4–8 kHz) in the 70-year-old subjects. Curiously, the same finding was not observed in the 85-year-old subjects, who in fact exhibited less variability in the high frequencies. This may be due to the high rate of severe hearing thresholds among 85-year-olds, producing a ceiling effect for both methods, and thus less variation. In addition, the number of observations based on which the standard deviations are calculated is much smaller in the 85-year-olds as a consequence of unreached thresholds. Regardless, we advise caution when interpreting automated hearing thresholds at 8 kHz in particular.
It is encouraging that AA seemed to produce accurate hearing measurements for most subjects in this study. Nevertheless, it is worth stressing that a proportion of participants had results that deviated by a substantial amount (>15 dB), approximately 2–3% and even more at the highest frequencies (). This is similar to what has been reported in other studies, e.g. Storey et al. (Citation2014). It is also reflected in the relatively wide limits of agreement seen in the Bland–Altman analysis (), which indicates that the PTA4 obtained with AA could be wrong by 9–12 dB. This may be acceptable in a hearing loss screening context, but less likely in diagnostic settings. To put it in perspective, Dobie (Citation1983) reported that a 10 dB or higher shift in a pure-tone average would be clinically significant. The equivalent figure when it comes to single frequency measurements, i.e. the range covering 1.96 standard deviations, was 12–23 dB in the present study (derived from ).
Effects of gender, age, hearing loss and cognitive status
Gender did not affect the accuracy of AA, which was expected. It was perhaps more unexpected to us that the accuracy also was not affected by age. The hearing was significantly poorer and twice as many had possible cognitive impairment (MMSE scores ≤26) among the older subjects, which we thought would affect the accuracy. In fact, in some respects the accuracy was found to be slightly better among 85-year-olds when looking at the various figures and tables, however, the effect of age on the accuracy was not significant in the regression analysis (). The participant’s level of hearing (PTA4) was not associated with the accuracy of AA either, but judging from the Bland–Altman plot () it appears as though the variability decreases with increasing PTA4, in the 70-year-old subjects only. It is particularly evident that the variation is the highest in ears with a PTA4 around 20 dB HL. This may indicate that it could be unreliable to detect mild hearing impairment using AA.
Finally, the MMSE score of the participant, serving as a marker of cognitive status, was not associated with the accuracy of AA in the present study. However, there were few participants with low scores, and a different cognitive measure (with less of a ceiling effect) could possibly be used to study the effect on the accuracy of AA. A recent study (Heinrich, Ferguson, and Mattys Citation2020) showed that PTTs measured under cognitive load were elevated in older adults. Of note, we could have performed the analysis of the association between MMSE and the accuracy of AA in alternative ways. We chose to perform an ordinal regression analysis with the accuracy expressed on a five-step scale, from perfect to poor. However, in ad hoc analyses we found that if instead expressing the accuracy as a binary variable, comparing those with thresholds correspondence within 10 dB versus >10 dB, there was in fact a significant association with the MMSE score. This may suggest that cognitive function does play some role after all. It would also have been interesting to perform the analysis with the MMSE score expressed as a binary variable (normal/impaired cognition).
Comparison with other studies
The results of the present study may not be directly comparable to other similar studies, due to differences in methodology, instrumentation, etc. used in various studies. In the meta-analysis regarding the validity of AA (Mahomed et al. Citation2013), the overall difference between methods was estimated at 0.3 dB (SD = 5.5), based on three studies using the method of limits. The corresponding figure for our study, −0.7 dB (SD = 8.8), point to a somewhat poorer accuracy. In addition, mean absolute differences were somewhat higher in this study (6.1 ± 6.6 and 5.5 ± 6.6 dB) compared to, for instance, the study by Margolis et al. (Citation2010) concerning the accuracy of the AMTAS audiometer, or by Swanepoel et al. (Citation2010) on the KUDUwave equipment.
The fact that we found a higher variability of differences between AA and MA in the present study than what has been reported previously, may be due to various reasons. First, it may be attributable to the age of the subjects in our study. As mentioned, previous reports regarding the accuracy of AA have mostly included younger subjects. It is certainly plausible that older adults exhibit greater variability, due to both physiological and behavioural changes that occur in old age, such as physical discomfort during testing, fatigue, cognitive aspects, the presence of tinnitus and any other factors affecting the adherence to the test procedure (Landry and Green Citation1999). Second, there are also a number of methodological factors that may have contributed to the finding. For instance, the time that passed between the first and the second visit was rather long (one month on average). It seems logical to assume that the difference would be smaller if both tests had been carried out on the same day. Another factor is the test environment, which was soundproofed in the case of MA, as opposed to AA, in the present study. Ambient noise can impact on the reliability of pure-tone audiometry (Storey et al. Citation2014), but is less of a problem when using sound-dampening headphones, as done in our study.
Yet another aspect to consider is that our sample includes subjects with ear asymmetry where contralateral masking would have been required for accurate determination of the PTTs. Masking was only used in MA, so some of the PTTs from AA may in fact seem better than they truly are as a result of cross-hearing to the non-test ear. Brännström and Lantz (Citation2010) recommended, specifically for HDA200 circum-aural headphones, that masking be used when air conduction thresholds in left and right ears differ by >40 dB. A review of our data revealed that this criterion applies to 1.8% of the measured thresholds in 70-year-old subjects and 1.2% in the 85-year-old subjects (not in any table). We therefore do not believe it to have significantly influenced the results of the present study. The choice of not excluding subjects with ear asymmetries was made to ensure–as far as possible–that our sample reflected the general population.
Strengths and limitations
A major strength of the present study is undoubtedly the large sample size. Previous studies have mostly been smaller. Our study design has both advantages and disadvantages. An experimental design would likely have been more accurate in pinpointing the differences caused by using an automated method, because it would have allowed us to control for a number of factors. On the other hand, we believe that our results are more clinically oriented and relevant to real-life situations as a result of the population-based study design. For example, the test environment where AA was conducted corresponds to the settings in which it would be likely to take place in reality, such as in care homes or in hearing screening contexts. Similarly, the participants of our study are more representative of the target group for AA, e.g. older adults consulting primary care to have their hearing tested. It is worth noting, however, that the participants of the present study were more educated and, in the case of 85-year-olds, more physically and cognitively healthy (Supplementary Table 1) than the birth cohorts that they were selected from. It is thus possible that the accuracy of AA would be poorer, had the sample been less biased towards healthy individuals.
One limitation of this study is that manual pure-tone audiometry was treated as the gold standard (for reasons outlined in the introduction section of this paper), and that any deviations from it were interpreted as inaccuracies in the automated test method. In reality, it has not been demonstrated that manual pure-tone audiometry is more accurate, and there is in fact no easy way to know which method is the most accurate. For further reading on this issue including a presentation of a method to assess the accuracy of automated audiometry using quality indicators, see Margolis et al. (Citation2007).
Furthermore, the results of the present study may be limited to the specific audiometer and test protocol used. In addition, we only assessed air conduction PTTs. Bone conduction testing is a vital element of audiological diagnostics, and automated versions have been validated (Swanepoel de and Biagio, Citation2011). However, bone conduction testing is more complex to perform in a reliable way, due to difficulties in placing the vibrator on the bone and higher susceptibility to errors caused by background noise. These issues may perhaps be even more difficult when testing older adults. Interestingly, Convery et al. (Citation2014) demonstrated that conductive hearing impairment may be identified through air conduction tests alone, something that may be further developed and utilised when screening for hearing loss in older adults.
Clinical implications
AA is a cost-effective means of testing hearing that, if made available in primary care units or other settings relevant to older adults, has the potential to improve the accessibility to hearing health care. Automated hearing tests give physicians, nurses and other healthcare professionals a reasonably accurate assessment of their patient’s hearing status, which can inform their management and onward referral of the patient. Furthermore, national hearing screening programmes for older adults have been proposed in several countries, including in Sweden. In this context, knowledge about the accuracy of AA is essential. Importantly, as the accuracy of AA in geriatric populations may be marginally reduced–particularly in the higher frequencies–as demonstrated in the present study, caution should be exercised by clinicians when interpreting the results of AA in this age group.
Hearing loss restricts every-day communication, and may lead to negative effects in multiple domains, including mental, physical and cognitive health. Hearing aids are cost-effective and promote the wellbeing of persons with hearing impairment, in terms of better functioning, improved cognitive function and reduced risk for falls. Yet, the hearing aid uptake among older adults is still rather low (Chien and Lin. Citation2012). Although the reasons for this are multiple, it is certain that older individuals face barriers to hearing aid adoption related to the availability and accessibility of Audiology services and that AA may play a role in improving this.
Conclusions
On the basis of the findings of the present study, we conclude that automated pure-tone audiometry is an accurate method for assessing hearing sensitivity in older adults, with larger error margins than in younger populations, and with lower accuracy in the highest frequencies (especially 8 kHz). Moreover, the accuracy does not seem to be affected by gender, age (“younger” vs “older” old), hearing loss or cognitive ability. Future studies should examine the test–retest repeatability of automated audiometry in older adults, and aim at identifying factors that may improve the accuracy of test results.
Supplemental Material
Download PNG Image (111.1 KB)
Supplemental Material
Download PNG Image (40.3 KB)
Supplemental Material
Download MS Word (15.2 KB)Acknowledgements
The authors thank Inger Wikström for administrative support and Valter Sundh for statistical support. We also thank the research personnel involved in the data collection as well as the participants of the study.
Disclosure statement
No potential conflict of interest was reported by the author(s)
Additional information
Funding
References
- Bland, J. M., and D. G. Altman. 2010. “Statistical Methods for Assessing Agreement Between Two Methods of Clinical Measurement.” International Journal of Nursing Studies 47 (8):931–936. doi: 10.1016/j.ijnurstu.2009.10.001.
- Brännström, K. J., and J. Lantz. 2010. “Interaural Attenuation for Sennheiser HDA 200 Circumaural Earphones.” International Journal of Audiology 49 (6):467–471. doi: 10.3109/14992021003663111.
- Brennan-Jones, C., R. Eikelboom, R. Bennett, K. Tao, and D. Swanepoel. 2018. “Asynchronous Interpretation of Manual and Automated Audiometry: Agreement and Reliability.” Journal of Telemedicine and Telecare 24 (1):37–43. doi: 10.1177/1357633X16669899.
- Carhart, R., and J. Jerger. 1959. “Preferred Method for Clinical Determination of Pure-tone Thresholds.” Journal of Speech and Hearing Disorders 24 (4):330–345. doi: 10.1044/jshd.2404.330.
- Chadha, S., K. Kamenov, and A. Cieza. 2021. “The World Report on Hearing, 2021.” Bulletin of the World Health Organization 99 (4):242–242A. doi: 10.2471/BLT.21.285643.
- Chien, W., and F. R. Lin. 2012. “Prevalence of Hearing Aid Use Among Older Adults in the United States.” Archives of Internal Medicine 172 (3):292–293. doi: 10.1001/archinternmed.2011.1408.
- Convery, E., G. Keidser, M. Seeto, K. Freeston, D. Zhou, and H. Dillon. 2014. “Identification of Conductive Hearing Loss Using Air Conduction Tests Alone: Reliability and Validity of an Automatic Test Battery.” Ear and Hearing 35 (1):e1–e8. doi: 10.1097/AUD.0b013e31829e058f.
- Dobie, R. A. 1983. “Reliability and Validity of Industrial Audiometry: Implications for Hearing Conservation Program Design.” The Laryngoscope 93 (7):906–927. doi: 10.1288/00005537-198307000-00014.
- Eikelboom, R. H., R. J. Bennett, V. Manchaiah, B. Parmar, E. Beukes, S. L. Rajasingam, and D. W. Swanepoel. 2022. “International Survey of Audiologists During the COVID-19 Pandemic: Use of and Attitudes to Telehealth.” International Journal of Audiology 61 (4):283–292. doi: 10.1080/14992027.2021.1957160.
- Eikelboom, R. H., D W. Swanepoel, S. Motakef, and G. S. Upson. 2013. “Clinical Validation of the AMTAS Automated Audiometer.” International Journal of Audiology 52 (5):342–349. doi: 10.3109/14992027.2013.769065.
- Folstein, M., S. Folstein, and P. McHugh. 1975. “Mini-mental State (MMSE).” Journal of Psychiatric Research 12 (3):189–198. doi: 10.1016/0022-3956(75)90026-6.
- Gelfand, S. A. 2017. Hearing: An Introduction to Psychological and Physiological Acoustics. Boca Raton: CRC Press.
- Göthberg, H., U. Rosenhall, T. Tengstrand, L. Rydén, H. Wetterberg, I. Skoog, and A. Sadeghi. 2021. “Prevalence of Hearing Loss and Need for Aural Rehabilitation in 85-Year-Olds: A Birth Cohort Comparison, Almost Three Decades Apart.” International Journal of Audiology 60 (7):539–548. doi: 10.1080/14992027.2020.1734878.
- Göthberg, H., I. Skoog, T. Tengstrand, L. Magnusson, M. Hoff, U. Rosenhall, and A. Sadeghi. 2023. “Pathophysiological and Clinical Aspects of Hearing Loss Among 85-year-olds.” American Journal of Audiology 32 (2):440–452. doi: 10.1044/2023_AJA-22-00214.
- Heinrich, A., M. A. Ferguson, and S. L. Mattys. 2020. “Effects of Cognitive Load on Pure-Tone Audiometry Thresholds in Younger and Older Adults.” Ear and Hearing 41 (4):907–917. doi: 10.1097/AUD.0000000000000812.
- Hoff, M., T. Tengstrand, A. Sadeghi, I. Skoog, and U. Rosenhall. 2018. “Improved Hearing in Swedish 70-year olds–A Cohort Comparison Over More Than Four Decades (1971–2014).” Age and Ageing 47 (3):437–444. doi: 10.1093/ageing/afy002.
- Hoff, M., T. Tengstrand, A. Sadeghi, I. Skoog, and U. Rosenhall. 2020. “Auditory Function and Prevalence of Specific Ear and Hearing Related Pathologies in the General Population at Age 70.” International Journal of Audiology 59 (9):682–693. doi: 10.1080/14992027.2020.1731766.
- ISO 2010. Acoustics-Audiometric test methods-Part 1:Pure-tone air and bone consuction audiometry (ISO 8253-1:2010) AENOR.
- Landry, J. A., and W. B. Green. 1999. “Pure-Tone Audiometric Threshold Test-Retest Variability in Young and Elderly Adults Variabilite test-retest du seuil audiometrique tonal chez les jeunes adultes et les aines.” Journal of Speech-Language Pathology and Audiology 23 (2): 74-80.
- Lemkens, N., K. Vermeire, J. P. Brokx, E. Fransen, G. Van Camp, and P. H. Van De Heyning. 2002. “Interpretation of Pure-tone Thresholds in Sensorineural Hearing Loss (SNHL): A Review of Measurement Variability and Age-Specific References.” Acta Oto-Rhino-Laryngologica Belgica 56 (4):341–352.
- Mahomed, F., D W. Swanepoel, R. H. Eikelboom, and M. Soer. 2013. “Validity of Automated Threshold Audiometry: A Systematic Review and Meta-Analysis.” Ear and Hearing 34 (6):745–752. doi: 10.1097/01.aud.0000436255.53747.a4.
- Margolis, R. H., B. R. Glasberg, S. Creeke, and B. C. J. Moore. 2010. “AMTAS®: Automated Method for Testing Auditory Sensitivity: Validation Studies.” International Journal of Audiology 49 (3):185–194. doi: 10.3109/14992020903092608.
- Margolis, R. H., G. L. Saly, C. Le, and J. Laurence. 2007. “Qualind: A method for Assessing the Accuracy of Automated Tests.” Journal of the American Academy of Audiology 18 (1):78–89. doi: 10.3766/jaaa.18.1.7.
- Margolis, R. H., R. H. Wilson, G. R. Popelka, R. H. Eikelboom, D. W. Swanepoel, and G. L. Saly. 2016. “Distribution Characteristics of Air-Bone Gaps–Evidence of Bias in Manual Audiometry.” Ear and Hearing 37 (2):177–188. doi: 10.1097/AUD.0000000000000246.
- Rydberg Sterner, T., F. Ahlner, K. Blennow, S. Dahlin-Ivanoff, H. Falk, L. Havstam Johansson, M. Hoff, M. Holm, H. Hörder, T. Jacobsson, et al. 2019. “The Gothenburg H70 Birth Cohort Study 2014-16: Design, Methods and Study Population.” European Journal of Epidemiology 34 (2):191–209. doi: 10.1007/s10654-018-0459-8.
- Schmuziger, N., R. Probst, and J. Smurzynski. 2004. “Test-Retest Reliability of Pure-Tone Thresholds from 0.5 to 16 kHz Using Sennheiser HDA 200 and Etymotic Research ER-2 Earphones.” Ear and Hearing 25 (2):127–132. doi: 10.1097/01.aud.0000120361.87401.c8.
- Skjönsberg, Å., C. Heggen, M. Jamil, P. Muhr, and U. Rosenhall. 2019. “Sensitivity and Specificity of Automated Audiometry in Subjects with Normal Hearing Or Hearing Impairment.” Noise & Health 21 (98):1–6. doi: 10.4103/1463-1741.278701.
- Sparks, D. 1972. “Feasibility of Computerized Audiometry.” Journal of Auditory Research 12:62–66.
- Storey, K. K., K. Muñoz, L. Nelson, J. Larsen, and K. White. 2014. “Ambient Noise Impact on Accuracy of Automated Hearing Assessment.” International Journal of Audiology 53 (10):730–736. doi: 10.3109/14992027.2014.920110.
- Swanepoel de, W., and L. Biagio. 2011. “Validity of Diagnostic Computer-Based Air and Forehead Bone Conduction Audiometry.” Journal of Occupational and Environmental Hygiene 8 (4):210–214. doi: 10.1080/15459624.2011.559417.
- Swanepoel, D. W., S. Mngemane, S. Molemong, H. Mkwanazi, and S. Tutshini. 2010. “Hearing Assessment—Reliability, Accuracy, and Efficiency of Automated Audiometry.” Telemedicine Journal and e-Health : The Official Journal of the American Telemedicine Association 16 (5):557–563. doi: 10.1089/tmj.2009.0143.
- Wetterberg, H., L. Rydén, F. Ahlner, H. Falk Erhag, P. Gudmundsson, X. Guo, E. Joas, et al. 2022. “Representativeness in Population-Based Studies of Older Adults: Five Waves of Cross-Sectional Examinations in the Gothenburg H70 Birth Cohort Study.” BMJ Open 12 (12):e068165. doi: 10.1136/bmjopen-2022-068165.