
 ?Mathematical formulae have been encoded as MathML and are displayed in this HTML version using MathJax in order to improve their display. Uncheck the box to turn MathJax off. This feature requires Javascript. Click on a formula to zoom.
Abstract
Objective
To introduce the urban outdoor version of the Situated Phoneme (SiP) test and investigate its test-retest reliability.
Design
Phonemic discrimination scores in matched-spectrum real-world (MSRW) maskers from an urban outdoor environment were measured using a three-alternative forced choice test paradigm at different phoneme-to-noise ratios (PNR). Each measurement was repeated twice. Test-retest scores for the full 84-trial SiP-test, as well as for four types of contrasting phonemes, were analysed and compared to critical difference scores based on binomial confidence intervals.
Study sample
Seventy-two adult native speakers of Swedish (26–83 years) with symmetric hearing threshold levels ranging from normal hearing to severe sensorineural hearing loss.
Results
Test-retest scores did not differ significantly for the whole test, or for the subtests analysed. A lower amount of test-retest score difference than expected exceeded the bounds of the corresponding critical difference intervals.
Conclusions
The urban outdoor SiP-test has high test-retest reliability. This information can help audiologists to interpret test scores attained with the urban outdoor SiP-test.
Introduction
In the Swedish language, there are currently five standard speech audiometry tests available for clinical use. These are the phonemically balanced (PB) 50-word lists (remixed in 1966 from Lidén and Fant Citation1954), the PB-50 lists mixed with static speech-weighted noise (Magnusson Citation1995), as well as with fluctuating speech-weighted noise (Grunditz and Magnusson Citation2013), the matrix sentences of Hagerman (Citation1982), and a Swedish version of the HINT sentences (Hällgren, Larsby, and Arlinger Citation2006). Recently, Witte, Ekeroot, and Köbler (Citation2021) started the development of the Situated Phoneme (SiP) test, which is a phonemic discrimination test for adult people with hearing loss, intended for evaluating the benefit of hearing rehabilitation interventions such as hearing aid fitting.
The SiP-test materials of Witte, Ekeroot, and Köbler (Citation2021) consist of groups of three or four real Swedish words that differ from each other on one single phoneme, such as the words < sitt, sytt, sött>, [sɪtː, sʏtː, sø̞tː] (English: sit, sewn, sweet). Thus, these groups make up phonemically minimal triplets and quadruplets, referred to as test-word groups. The phonemes that differ within each test-word group are referred to as the contrasting phonemes or test phonemes of that group, and are acoustically similar. Altogether, the complete set of contrasting phonemes in the SiP-test include most phonemes in the Swedish language.
Besides being acoustically similar, the member words within each test-word group are similar on a number of lexical properties – based on word metrics from Witte and Köbler (Citation2019) – generally thought to influence the ease and speed of word recognition. These include the facilitative effects of word frequency (Brysbaert et al. Citation2016; Winkler, Carroll, and Holube Citation2020) and phonotactic probability (Vitevitch and Luce Citation1998, Citation2016), and the inhibitory effect of phonological neighbourhood density (Ziegler, Muneaux, and Grainger Citation2003). In addition, all words in the SiP-test have high orthographic transparency (Witte, Ekeroot, and Köbler Citation2021).
The composition of the SiP-test materials is intended and suitable for use in multiple-alternative forced choice tasks of phonemic discrimination, and can therefore be used to determine whether someone can make the necessary phonemic discriminations needed to distinguish between similar words with different meanings (Witte, Ekeroot, and Köbler Citation2021).
People with hearing loss live in environments containing many different types of noise (Wagener, Hansen, and Ludvigsen Citation2008), at a variation of levels (Smeds, Wolters, and Rung Citation2015). Typically, however, speech audiometry tests use static (Hällgren, Larsby, and Arlinger Citation2006) or fluctuating (Grunditz and Magnusson Citation2013) speech weighted maskers. Even though test reliability may be high when using such noises, there is a cost in terms of the generalisability of test results to common everyday situations. In order to create a version of the SiP-test which is situated in an urban outdoor sound environment, the current study proposes an alternative masking method that uses common everyday sounds that are spectrally matched to each specific set of contrasting phonemes that should be masked. We refer to this class of maskers as matched-spectrum real-world (MSRW) maskers. The MSRW masking method aims to be highly reliable, ecologically valid, and to reduce the differences in masking susceptibility that exist between different types of speech sounds (Miller and Nicely Citation1955), whereby phonemic level floor and ceiling effects could be avoided.
In order to make correct interpretations of attained speech audiometry scores, knowledge of the expected level of test score variability is of fundamental importance. While random fluctuations in speech audiometric tests are in principle predictable (Hagerman Citation1976), several other possible sources of variability exist (Dillon Citation1982). Evaluations of test-retest reliability of every new speech audiometry test are therefore needed.
The aims of this study were to introduce the urban outdoor version of the SiP-test and to investigate its test-retest reliability.
Materials and methods
Participants
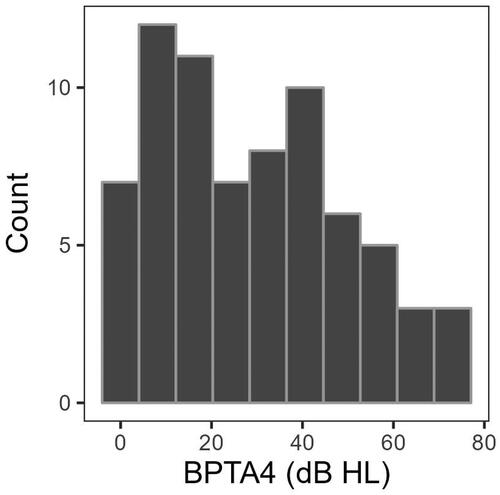
Seventy-two adult native speakers of Swedish (48 female and 24 male, mean age of 62 years (SD = 16.2, range 26–83) participated in the current study. The hearing threshold levels of the participants ranged from normal hearing to severe hearing loss. However, all participants had symmetric pure-tone thresholds, defined as a maximum difference of 10 dB between left- and right-side air-conducted pure-tone-threshold averages at 500, 1000, 2000 and 4000 Hz (PTA4). No participant had a conductive hearing loss component exceeding 10 dB measured as the difference between air-conducted and bone-conducted PTA4 values, or moderate to severe tinnitus as measured by the Tinnitus Handicap Inventory (Müller et al. Citation2016). In addition, no participant had diagnosed dyslexia or severe visual impairment. The distribution of better-ear air conducted PTA4 (BPTA4) among the participants is presented in as a histogram. Participants were recruited via information on social media, on the website of the University Hospital in Örebro, in the audiological clinic in Örebro, and via a list of people having registered their interest in participating in research at the Audiological Research Centre, Örebro. Signed informed consent was obtained from all participants. Otoscopy and pure tone audiometry were performed by a registered audiologist prior to the SiP-test measurements. Participants received no payment. This study was approved by the Regional Ethics Review Board in Uppsala, Sweden (No. 2018/475).
Figure 1. Distribution of Better-Ear Air-Conducted Pure-Tone-Threshold Averages for the Frequencies 500, 1000, 2000 & 4000 Hz (BPTA4) among the 72 Participants in the Current Study.
SiP-test materials
In the current study, the linguistic stimuli created by Witte, Ekeroot, and Köbler (Citation2021) for the Swedish SiP-test were used with some alterations. The original material consists of 28 groups of minimal phonemic triplets and quadruplets (i.e. words that contrast on only one phoneme), each recorded five times by two talkers, one male and one female. In the current study, the original SiP-test material was modified in the following ways. Firstly, in order to equalise the effect of chance between all parts of the test, one word was removed from all four-member test-word groups in Witte, Ekeroot, and Köbler (Citation2021). Thus, the urban outdoor SiP-test only contains minimal phonemic triplets, as detailed in Supplement 1.
Secondly, to allow linguistic stimuli in the SiP-test to reflect the sound-level variation that naturally exists between different words, the test-word recordings from Witte, Ekeroot, and Köbler (Citation2021) were modified in the following way. First, the sound levels of all test-word recordings were reset to their initial recording level. All test-word recordings were then bandpass filtered using a linear-phase finite impulse response (FIR) filter with a passband from 81-13585 Hz.Footnote1 The main reason for removing these low and high-frequency components from the material was to avoid the extra computational load of performing frequency-weighted sound level calculations when mixing the test trial sounds in real-time in the SiP-test software. When instead the material itself has been passband filtered in advance, unweighted measurements can be used. The sound levels of all five sound recordings by the same test word and SiP-test voice were then set to the mean sound level of those recordings when the recordings with the lowest and the highest sound levels were excluded. In this way, the sound levels of all recordings of the same test word and SiP-test voice were equalised, while at the same time the natural sound level variations between different words in the language were retained. This type of normalisation was referred to as variation-preserving (VP) sound-level normalisation.
Finally, an equal amount of gain was applied to all recordings by the same SiP-test voice so that their test-word sections, when concatenated, had a long-time average level of −31.66 dB FS, corresponding to 68.34 dB SPL when a dB FS to dB SPL calibration of 100 dB is used. The average speech level of 68.34 dB SPL was chosen to reflect a raised vocal effort level (ANSI-S3.5 Citation1997). The VP-normalized SiP-test sound files have been made available online at https://osf.io/q4rb3 under the Creative Commons Attribution-NonCommercial 4.0 International (CC BY-NC 4.0) licence (https://creativecommons.org/licenses/by-nc/4.0/).
Urban outdoor maskers
The MSRW maskers of the urban outdoor SiP-test were intended to be both appropriate in a common real-world auditory setting and spectrally matched to the contrasting speech segments in the test. To generate such maskers, a large set of recordings of sound events in an urban outdoor environment were processed through an automatic algorithm that selected – and slightly modified – the sound events with the best spectral matching and widest sound category distribution. To reduce variation in masking efficiency from temporal fluctuations, only sound events with a relatively stable temporal envelope were included. Five different maskers were created for each of the 28 test-word groups and each of the two voices in the SiP-test, thus in total 280 masker sounds were created. The algorithm developed to create the MSRW masker is detailed in Supplement 3 along with analyses of the spectral properties of the resulting masker sounds (See Figures S3 and S4). All masker sounds have been made available online at https://osf.io/q4rb3, also under the CC BY-NC 4.0 licence.
Procedure
Each participant took the full, 84-trial, SiP-test twice at one single difficulty level, using either the female or the male SiP-test voice. The first of these sessions were referred to as the baseline tests, and the second as the repeated tests.
The task in each test trial was to listen to one monosyllabic Swedish word in background noise, and then identify the word among a set of written response alternatives that appeared on a touch screen. The response alternatives were always the three members of the test-word group to which the aurally presented test word belonged. The touch screen was placed right in front of the participant, and the response alternatives were positioned in two rows on the touch screen, with two alternatives displayed on the top row and the third centred on the bottom row. In order to cue the participant as to when the test words were presented, a yellow circle appeared briefly at the centre of the touch screen at the precise moment of the test-word presentation. The response alternatives appeared 500 milliseconds after the end of the auditory test-word presentation and remained on the screen during a response period of 4 seconds. Participants were instructed to respond as quickly and as accurately as possible and to guess if in doubt. If the participant had not given a response within the response period, the response alternatives flashed briefly in red and disappeared. In such cases, the software noted that a missing response had occurred and then automatically selected a random response alternative and proceeded to the next trial.
The soundscape setup
Data collection took place in the soundscape laboratory at the Audiological Research Centre in Örebro, Sweden. Test words were presented from a loudspeaker positioned right in front of the participant. In addition to the test words, their corresponding urban outdoor masker sounds were presented from two separate loudspeakers at azimuths of ± 30 degrees. The elevation of all three loudspeakers was approximately in level with the head of the participants, and the distance to each loudspeaker was 1.45 metres as depicted in Supplement 1, Figure S2. The room reverberation time in the listener position was 0.090 s.Footnote2 The presentation of the masker sounds was synchronised to the test words so that their respective temporal midpoints coincided. The maskers were linearly faded during periods of approximately one second before and after each test wordFootnote3. To create a more vivid scenario, the maskers presented in the side speakers were always different recordings from the set of five masking noises available for each SiP-test voice and test-word group. In between trials, random sections of a relatively steady urban outdoor background sound were played from the side-speakers at a sound level of 60 dB SPL. This sound was a mix of traffic, playground sounds and the sound of the wind blowing in trees that was created using sounds from the urban sounds database of Gloaguen et al. (Citation2017) and has been made available at https://osf.io/q4rb3 under the CC BY-NC 4.0 licence. The reason to use these background sounds was to create a sense of being auditorily immersed in the situation. Also, in between the test trials, random segments of the international speech testing signal (ISTS) of Holube et al. (Citation2010) were played at the same average sound level as the test-word recordings. In supplement 5, sound files that demonstrate the auditory scene at two different difficulty levels (PNR of −2 dB and +6 dB) have been supplied.Footnote4
Prior to testing, all loudspeaker channels were calibrated separately using pink noise as a sound source and a condenser microphone placed at several positions at and around the intended position for the participants’ heads, in accordance with Champlin and Letowski (Citation2014).
The phoneme-to-noise ratio (PNR)
In order to adjust the difficulty level of the SiP-test trials, the sound-level ratio between the test words and the urban outdoor masker sounds was adjusted according to a phoneme-to-noise ratio (PNR) procedure. PNR was defined as the difference between the contrasting-phonemes level and the masker level
Strictly,
was defined as the voice specific average root-mean-squared (RMS) sound pressure level of a concatenation of the greatest level, and 50 ms long, section of the test-phoneme segment (which was zero-padded if shorter than 50 ms) of each test-word recording within the test-word group to which the test word belonged. In essence, this described the maximum level of the contrasted test phonemes, using an integration time of 50 ms.
was defined as the RMS sound pressure level of the presented masker sounds. Thus, PNR was defined according to EquationEquation 1
(1)
(1) .
(1)
(1)
Defining the SNR in this way – with maskers that were spectrally matched to their corresponding contrasting phonemes – was done with the intention to reduce the differences of masking susceptibility between different phoneme types, so that these could be tested at the same PNR without the pronounced floor and/or ceiling effects otherwise expected.
Presentation levels
In order to attain a desired PNR, was first fixed to the
that the particular test-word group would have with a reference level
defined as the average RMS sound pressure level of all test-word recordings by the selected SiP-test voice, of 68.34 dB SPL, corresponding to the raised vocal effort level defined in ANSI-S3.5 (Citation1997). The whole test-word was then amplified by the PNR attained by EquationEquation (1)
(1)
(1) . However, if the average RMS level of the presented test-word
would have to be adjusted beyond 82.3 dB SPL (representing shouted speech level in ANSI-S3.5 Citation1997) to reach the desired PNR,
was fixed at 82.3 dB SPL, and then instead
was decreased until the desired PNR was attained.
Difficulty levels, presentation orders and randomization
Each participant in the current study took the SiP-test at one of three difficulty levels aiming at scores of approximately 60%, 80% or 90%. These test-difficulty levels, defined in PNR, were estimated individually for each participant based on a shorter adaptive test presenting a selection of the SiP-test stimuli at different difficulty levels, and then fitting the test scores to the sigmoid function in EquationEquation (2)(2)
(2)
(2)
(2)
where
is the estimated mean score at the difficulty level
represents the slope of the function, which was fixed at
as determined in pilot experiments, and
represents the intercept, which was fitted to the best representation of the data. The function given by EquationEquation (2)
(2)
(2) has an upper asymptote of 1 and a lower asymptote at ⅓. The latter, in order to account for an average effect of guessing from three response alternatives (Knoblauch and Maloney Citation2012). To avoid very similar difficulty levels from being estimated for the same single participant, the easiest level was always estimated first, the PNR of the mid-difficulty level then had to be at least 3 dB lower, and finally the most difficult level had to be at least 4 dB below the PNR of the mid-level. The highest PNR allowed for the easiest condition was limited to +15 dB. The final difficulty levels used in the baseline and repeated test sessions, as well as the selection of the female or the male SiP-test voice, were counterbalanced between participants within groups of participants with (a) normal hearing, (b) mild, (c) moderate and (d) severe hearing loss, defined according to the World Health Organization’s (1991) grades of hearing impairment system. Not reported here, participants also took one SiP-test sessions at the two remaining difficulty levels. The order of SiP-test sessions, including these non-reported sessions, were counterbalanced within the same participant groups as above. This meant that participants took either no, one or two SiP-test sessions prior to the current study baseline session.
Within each test session, the order of test words was randomised, and for each trial, the recording representing the test word was randomised from the five recordings available for each test word and SiP-test voice. Likewise, the masker sounds presented in each trial were randomly selected from the five maskers available for each test-word group and voice. In addition, the order in which the response alternatives were placed on the touch screen was randomised anew for each consecutive trial.
Test-retest reliability
The test-retest reliability of the SiP-test was investigated by comparing scores from the baseline and repeated test sessions for the different participants as well as for the different test-word groups. Firstly, the grand total test-retest difference score was calculated across all 72 participants and 28 test-word groups by comparing the total number of correct trials throughout all baseline tests with the corresponding number of correct trials in all retests. Secondly, test-retest differences were calculated, both as uncorrected percentage scores and as rationalised arcsine units (RAU) (Studebaker Citation1985) for the whole SiP-test, and for the four sub-tests formed by dividing short and long vowels and consonants, henceforth referred to as phoneme types. The statistical significance of these differences was tested using repeated measures ANOVA with the anova_test function in the rstatix R-package (Kassambara Citation2022), or when the assumptions of normality was not fulfilled, instead with the Friedman test using the friedman_test function in the same R-package. In these analyses, the RAU-corrected scores were used as dependent variable, and test session as within subject factor. The Holm method was used to adjust the attained p-values when testing the score differences for the four phoneme types, using the p.adjust function of the stats R-package (R Core Team Citation2021). Thirdly, each test-retest score difference was tested against the boundaries of the estimated critical score differences using the technique of normal approximation of the binomial (Cf. Carney and Schlauch Citation2007) based directly on the confidence interval of the binomial difference distribution attained in Equation (3)
(3)
(3)
where Δ represents the observed test-retest score difference and zα/2 is the (two tailed) critical value for the confidence level of 95%,
and
as well as, and
and
equals the lengths (i.e. number of trials) and the average success probability (estimated as the observed proportion correct trials) in the baseline and repeated tests, respectively, and
equals
.
In order to determine the amount of test-retest variability present in the test scores stemming from sources of variability other than random chance, the proportions of test-retest sessions with a score difference that fell outside the boundaries of the estimated critical score differences were calculated. In the case that there should be notable learning effects, effects from fatigue, or from other sources of variation other than random fluctuations between the baseline tests and the retests, more than five percent of the test-retest score differences should fall outside their corresponding critical intervals.
Results
Missing responses
Of the total 12,096 SiP-test trials presented in the current study, missing responses occurred in 264 test trials (2.2%). Of all missing responses, 83% occurred for contrasting vowels, and 53% occurred at or below PNRs of −3 dB. Three groups < sitt, sytt, sött>, <satt, sätt, sött > or < rått, rott, rött>, contrasting phonemically short vowels, together accounted for 31% of the missing responses. The average proportion of missing responses per participant was 2.2% (sd = 5.3). However, two participants – for which the average rate of missing responses were around 30% – alone accounted for 54% of the missing responses, and 39 participants had no missing responses. The number of missing responses was not correlated with the hearing level (BPTA4) of the participants (Pearson’s correlation r = 0.061, p = 0.61). In the remaining analyses, missing responses have been replaced by the auto generated computer-randomised responses to ensure that the lower asymptote of the SiP-test scores stays at the chance level of 33%.
Participant scores
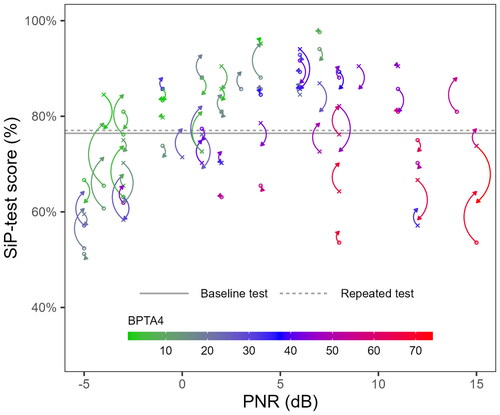
The grand total number of correct trials counted across all baseline and repeated tests was 4623 (76.4%) and 4659 (77.0%), respectively. The same average score, presented by the horizontal lines in , resulted from averaging the (uncorrected) session test scores (sd for the baseline scores = 11.9, and for the repeated scores, sd = 11.1). The corresponding mean RAU-transformed test-retest difference score was 0.5 RAUs. The repeated measures ANOVA indicated that this difference was not statistically significant (p = 0.45). also presents the mean scores of the baseline and repeated sessions for each participant. The baseline test scores are indicated by crosses for participants that were tested with the female SiP-test voice and circles when the male voice was used. For each point, an arrow indicates the score of the repeated test for the corresponding participant. Colours indicate participants’ hearing levels in BPTA4. The abscissa indicate the PNR at which each participant was tested. As expected, the data presented in indicate that the SiP-test scores tended to improve with increasing PNR and better BPTA4. As PNR was never increased beyond +15 dB (as determined in the adaptive pretest), the participants with the highest PBTA4 were all tested at the same set of PNRs (+15, +12, +8 dB) resulting in the generally quite low SiP-test scores seen for these participants in the lower right quadrant of .
Figure 2. Average scores in the baseline and repeated sessions for each participant. Crosses indicate baseline scores from female SiP-test voice sessions and circles indicate male voice baseline session scores. Arrows indicate scores from the corresponding repeated tests. Colours indicate participants’ hearing levels in BPTA4. The abscissa indicates the PNR at which the tests were presented. Horizontal lines indicate the average session scores across all participants in the baseline (solid line) and the repeated (dashed line) tests.
Sub-test scores
presents the mean score of the baseline tests and the corresponding repeated tests separately for each phoneme type. For no phoneme type, these test-retest score differences were statistically significant (short vowels: p = 0.81, long vowels: p = 1, short consonants: p = 0.94, long consonants: p = 0.19).
Figure 3. Average scores in the baseline and repeated sessions for the different test-word groups and phoneme types. Crosses indicate baseline scores from female SiP-test voice sessions and circles indicate male voice baseline session scores. Arrows indicate scores from the corresponding repeated tests. Horizontal lines indicate the mean scores in the baseline tests (solid lines) and the corresponding repeated tests (dashed lines) for each phoneme type.
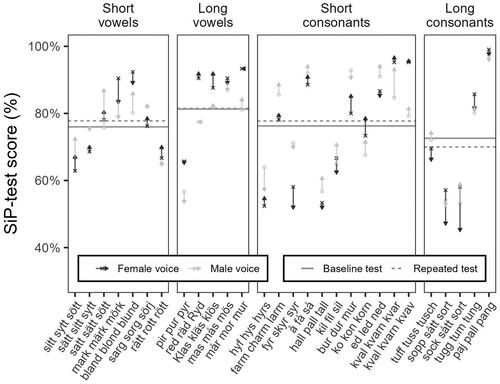
also presents the mean scores across all participants for the different test-word groups. Like in , crosses indicate baseline test scores attained using the female SiP-test voice and circles indicate male voice baseline test scores. Arrows indicate corresponding repeated tests scores.
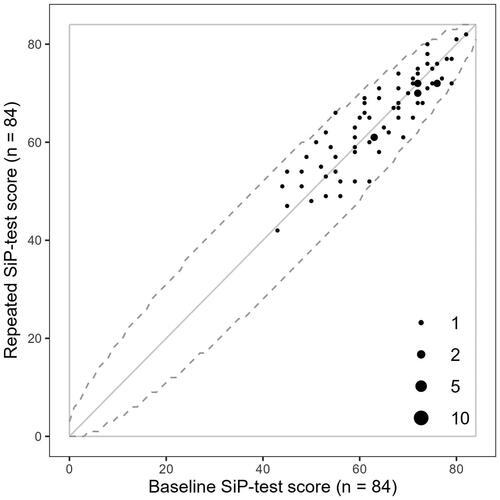
presents the scores from the baseline tests plotted against the scores from the retests along with the bounds of the corresponding binomial critical-difference intervals. These bounds are indicated by the dotted lines, at or, between which, data points represent score differences that are not statistically significant. As all points fall within the bounds of the critical difference intervals, none of the 72 observed test-retest difference scores was large enough to be considered statistically significant.
Figure 4. Scatter plot of the 72 pairs of baseline, against repeated, SiP-test scores in the current study. Dotted lines indicate the critical-difference interval for a confidence level of 95%.
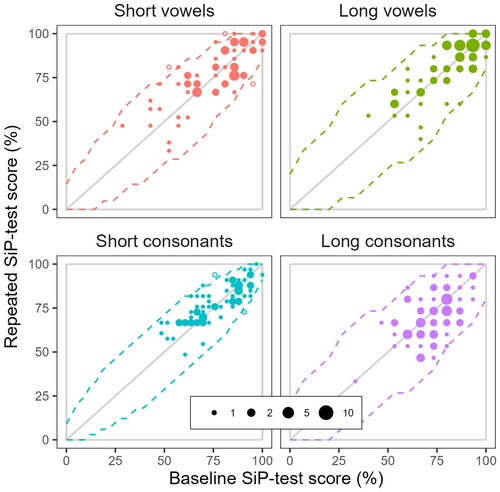
The same kind of data is presented in for the four phoneme type sub-tests. For long vowels and long consonants, none of the 72 observed test-retest difference scores fall outside the boundaries of the 95% critical difference intervals. For short vowels, however, 3 of 72 (i.e. 4.2%), and for short consonants, 2 of 72 (i.e. 2.8%) fall outside their corresponding boundaries.
Figure 5. Scatter plots of the 72 pairs of baseline, against repeated, SiP-test scores in the current study, separately for four different phoneme types. Dotted lines indicate the corresponding critical-difference intervals for a confidence level of 95%.
Discussion
The current study introduced the urban outdoor version of the SiP-test and investigated its test reliability by comparing test-retest scores for different participants and test-word groups in the SiP-test, as well as the corresponding expected bounds of their critical difference intervals, for the SiP-test as a whole as well as for four different phoneme types.
Test-retest reliability
and plotted the bounds of the non-significant score differences based on the binomial difference distribution. Using a confidence level of 95%, approximately 5% of the paired test-retest sessions, i.e. three or four session pairs, would be expected to fall outside the bounds of the critical difference intervals. That the proportion of test-retest differences that fell outside their corresponding critical difference boundaries was lower than 5% indicates that the variation between the baseline and repeated SiP-test sessions did not exceed that which could be expected solely from random fluctuations.
The statistical validity of this analysis depends on there being essentially no general improvement seen between the test and the retest, as such improvement would have increased the expected number of points falling outside the bounds of the critical interval. The small non-significant average test-retest score differences presented in and indicate that there was no such tendency. In consequence, this indicates that the test-retest reliability of the full-length SiP-test should be considered very high.
In the current study, a shorter adaptive test was used to establish appropriate difficulty levels to use in the subsequent tests. In addition, some participants also took one or two full-length SiP-test sessions at different difficulty levels prior to the test sessions reported in the current study. As some level of procedural learning will likely have occurred during these test sessions, the design of this study does not allow for proper analysis of learning effects. However, the minute overall improvements seen between the baseline and the repeated tests is a reasonably strong indication that learning effects in the SiP-test are small. Separate studies with repeated administrations of the SiP-test are needed to investigate this matter further.
Missing responses
In the current study, there was a small proportion (2.2%) of test trials with missing responses. A majority of these occurred for contrasting vowels at difficult PNRs. As the PNR level procedure assigns higher masking levels for vowels, due to their generally higher sound levels, it is likely that these missing responses occurred when participants could not hear the test word. With the two participants who had missing response rates at around 30%, test instructions were likely insufficient.
Modifications of the original SiP-test materials
In order to equalise chance performance between all test-word groups in the urban outdoor version of the SiP-test, one word was removed from each four-member test-word group in the original SiP-test materials of Witte, Ekeroot, and Köbler (Citation2021). With one exception, the test word removed was the word containing the zero-phoneme [∅], i.e. the absence of a contrasting phoneme. The exception was the word [ɧoː] <sjå> as it received many incorrect responses in the validation experiment of Witte, Ekeroot, and Köbler (Citation2021). Effectively, this means that only three zero-phonemes are left in the SiP-test material. This modification limits the possibility to use this material to test for the absence of a speech sound to only three of the original SiP test-word groups.
The bandpass filtering of all SiP-test recordings removed very low and very high frequency contents. This modification mostly affected the masker sounds leading to some loss of sense of realism. However, since especially the low frequency cut-off differs extensively between different loudspeakers, removing these very low frequencies from the materials should have the benefit of maintaining the high test-retest reliability of the SiP-test seen in this study largely independent of the particular loudspeaker systems used.
The MSRW masking method
The MSRW masking method proposed in the current study used masker sounds from an urban outdoor environment and adjusted their sound levels according to the PNR procedure. As a large proportion of the Swedish population is urbanised, the type of sounds included among the maskers created in this study would be commonly occurring in the everyday situation of most people in Sweden today. It should be noted, however, that the results of a speech (or speech sound) discrimination test with maskers representing an urban outdoor environment do not necessarily generalise to other common environments. Future studies could therefore apply the methods developed in the current study in order to create maskers that would situate the SiP-test in other common environments, such as homes, offices, kindergartens or various industrial environments.
Besides improving the ecological validity of speech audiometry maskers, another intention with the MSRW masking method was to reduce the differences in masking susceptibility between different phoneme types when presented at the same average PNR. Being able to present as many phonemes as possible close to the phoneme discrimination threshold should be beneficial to test efficiency as long as it helps to avoid floor and ceiling effects. The spectrally matched maskers used in the current study all have a relatively stationary temporal envelope. However, since the shape of temporal envelopes vary between phonemes, complete homogenisation of their different degrees of masking susceptibility with such noises will likely not be possible. Nonetheless, the relatively small differences seen between the average scores for the different phoneme types in is an indication that the MSRW masking method was at least partly successful. The full extent to which the MSRW masking method developed in the current study can be used to homogenise the difficulty levels between contrasting phonemes would merit further investigation in future studies.
In conclusion, the current study introduced the urban outdoor version of the SiP-test and investigated its test-retest reliability. The level of test-retest reliability was found to be high both for the urban outdoor SiP-test as a whole and for its various subtests.
Data accessibility statement
The raw data of the current study will be made available upon reasonable request to the Audiological Research Centre at Region Örebro County in Sweden (e-mail: [email protected]).
Supplemental Material
Download WAV Audio (17.9 MB)Supplemental Material
Download WAV Audio (17.9 MB)Supplemental Material
Download WAV Audio (562.5 KB)Supplemental Material
Download WAV Audio (31.3 KB)Supplemental Material
Download MS Word (1.4 MB)Supplemental Material
Download MS Word (172.9 KB)Acknowledgements
The authors are grateful to research audiologists Christina Bergqvist, Mathilda Johansson, and Karina Magnusson at the Audiological Research Centre in Örebro for administering the listening experiment in the current study.
Disclosure statement
No potential conflict of interest was reported by the authors.
Additional information
Funding
Notes
1 The frequency-specific gain of this filter is presented in Supplement 1, Figure S1 and its kernel has been made available as a sound file in Supplement 2.
2 The reverberation time was derived from the front loudspeaker impulse response (IR) at the listener position using the T30 method (ISO 3382 Citation2008). The IR, available in Supplement 4, was captured with the swept-sine method using the Impulse Response Measurer app in MATLAB (v2021b) and the reverberation time calculated using the software REW (v5.20.13).
3 All masker sound files had a total duration of three seconds. For test words longer than one second, the fading periods were shortened to fit within this duration.
4 These sound files should be listened to in headphones and contain simulations of example SiP-test trials created using binaural head-related transfer functions (HRTF) of a Head and Torso Simulator (Brüel & Kjær) recorded in the test room where the data collection took place. The HRTFs used are available at https://osf.io/89n34/.
References
- ANSI-S3.5. 1997. American National Standard Methods for Calculation of the Speech Intelligibility Index. New York: American National Standards Institute.
- Brysbaert, M., M. Stevens, P. Mandera, and E. Keuleers. 2016. “The Impact of Word Prevalence on Lexical Decision Times: Evidence from the Dutch Lexicon Project 2.” Journal of Experimental Psychology. Human Perception and Performance 42 (3): 441–458. https://doi.org/10.1037/xhp0000159
- Carney, E., and R. S. Schlauch. 2007. “Critical Difference Table for Word Recognition Testing Derived Using Computer Simulation.” Journal of Speech, Language, and Hearing Research: JSLHR 50 (5): 1203–1209. https://doi.org/10.1044/1092-4388(2007/084)
- Champlin, C. A., and T. Letowski. 2014. “Audiometric Calibration: Air Conduction.” Seminars in Hearing 35 (04): 312–328. https://doi.org/10.1055/s-0034-1390161
- Dillon, H. 1982. “A Quantitative Examination of the Sources of Speech Discrimination Test Score Variability.” Ear and Hearing 3 (2): 51–58. https://doi.org/10.1097/00003446-198203000-00001
- Gloaguen, J.-R., A. Can, M. Lagrange, and J.-F. Petiot. 2017. “Creation of a Corpus of Realistic Urban Sound Scenes with Controlled Acoustic Properties.” Proceedings of Meetings on Acoustics 30 (1): 055009. https://doi.org/10.1121/2.0000664
- Grunditz, M., and L. Magnusson. 2013. “Validation of a Speech-in-Noise Test Used for Verification of Hearing Aid Fitting.” Hearing, Balance and Communication 11 (2): 64–71. https://doi.org/10.3109/21695717.2013.782135
- Hagerman, B. 1976. “Reliability in the Determination of Speech Discrimination.” Scandinavian Audiology 5 (4): 219–228. https://doi.org/10.3109/01050397609044991
- Hagerman, B. 1982. “Sentences for Testing Speech Intelligibility in Noise.” Scandinavian Audiology 11 (2): 79–87. https://doi.org/10.3109/01050398209076203
- Holube, I., S. Fredelake, M. Vlaming, and B. Kollmeier. 2010. “Development and Analysis of an International Speech Test Signal (ISTS).” International Journal of Audiology 49 (12): 891–903. https://doi.org/10.3109/14992027.2010.506889
- Hällgren, M., B. Larsby, and S. Arlinger. 2006. “A Swedish Version of the Hearing in Noise Test (HINT) for Measurement of Speech Recognition.” International Journal of Audiology 45 (4): 227–237. https://doi.org/10.1080/14992020500429583
- ISO 3382. 2008. Acoustics – Measurement of Room Acoustic Parameters – Part 2: Reverberation Time in Ordinary Rooms. Geneva: International Organization for Standardization.
- Kassambara, A. 2022. rstatix: Pipe-Friendly Framework for Basic Statistical Tests. https://CRAN.R-project.org/package=rstatix
- Knoblauch, K., and L. T. Maloney. 2012. Modeling Psychophysical Data in R. New York: Springer.
- Lidén, G., and G. Fant. 1954. “Swedish Word Material for Speech Audiometry and Articulation Tests.” Acta Oto-Laryngologica. Supplementum 116: 189–204. https://doi.org/10.3109/00016485409130295
- Magnusson, L. 1995. “Reliable Clinical Determination of Speech Recognition Scores Using Swedish PB Words in Speech-Weighted Noise.” Scandinavian Audiology 24 (4): 217–223. https://doi.org/10.3109/01050399509047539
- Miller, G. A., and P. A. Nicely. 1955. “An Analysis of Perceptual Confusions Among Some English Consonants.” The Journal of the Acoustical Society of America 27 (2): 338–352. https://doi.org/10.1121/1.1907526
- Müller, K., N. K. Edvall, E. Idrizbegovic, R. Huhn, R. Cima, V. Persson, C. Leineweber, H. Westerlund, B. Langguth, W. Schlee, et al. 2016. “Validation of Online Versions of Tinnitus Questionnaires Translated into Swedish.” Frontiers in Aging Neuroscience 8: 272. https://doi.org/10.3389/fnagi.2016.00272
- R Core Team. 2021. R: A Language and Environment for Statistical Computing. Vienna, Austria: R Foundation for Statistical Computing. https://www.R-project.org/.
- Smeds, K., F. Wolters, and M. Rung. 2015. “Estimation of Signal-to-Noise Ratios in Realistic Sound Scenarios.” Journal of the American Academy of Audiology 26 (2): 183–196. https://doi.org/10.3766/jaaa.26.2.7
- Studebaker, G. A. 1985. “A ‘Rationalized’ Arcsine Transform.” Journal of Speech and Hearing Research 28 (3): 455–462. https://doi.org/10.1044/jshr.2803.455
- Vitevitch, M. S., and P. A. Luce. 1998. “When Words Compete: Levels of Processing in Perception of Spoken Words.” Psychological Science 9 (4): 325–329. https://doi.org/10.1111/1467-9280.00064
- Vitevitch, M. S., and P. A. Luce. 2016. “Phonological Neighborhood Effects in Spoken Word Perception and Production.” Annual Review of Linguistics 2 (1): 75–94. https://doi.org/10.1146/annurev-linguistics-030514-124832
- Wagener, K. C., M. Hansen, and C. Ludvigsen. 2008. “Recording and Classification of the Acoustic Environment of Hearing Aid Users.” Journal of the American Academy of Audiology 19 (4): 348–370. https://doi.org/10.3766/jaaa.19.4.7
- Winkler, A., R. Carroll, and I. Holube. 2020. “Impact of Lexical Parameters and Audibility on the Recognition of the Freiburg Monosyllabic Speech Test.” Ear and Hearing 41 (1): 136–142. https://doi.org/10.1097/AUD.0000000000000737
- Witte, E., and S. Köbler. 2019. “Linguistic Materials and Metrics for the Creation of Well-Controlled Swedish Speech Perception Tests.” Journal of Speech, Language, and Hearing Research: JSLHR 62 (7): 2280–2294. https://doi.org/10.1044/2019_JSLHR-S-18-0454
- Witte, E., J. Ekeroot, and S. Köbler. 2021. “The Development of Linguistic Stimuli for the Swedish Situated Phoneme Test.” Nordic Journal of Linguistics: 1–38. https://doi.org/10.1017/S0332586521000275
- World Health Organization. 1991. Report of the Informal Working Group on Prevention of Deafness and Hearing Impairment Programme Planning, 18–21. Geneva: WHO. https://apps.who.int/iris/handle/10665/58839
- Ziegler, J. C., M. Muneaux, and J. Grainger. 2003. “Neighborhood Effects in Auditory Word Recognition: Phonological Competition and Orthographic Facilitation.” Journal of Memory and Language 48 (4): 779–793. https://doi.org/10.1016/S0749-596X(03)00006-8