
Abstract
Objective
The objective is to evaluate the electroacoustic performance of the B250 transducer and to compare it with the two most widely used audiometric transducers B71 and B81.
Design
The electroacoustic performance was evaluated in terms of sensitivity level, distortion, maximum hearing level and electrical impedance.
Study sample
Six B250 prototype transducers were evaluated and compared with published data of B71 and B81 together with complementary measurements of maximum hearing level at 125 Hz and phase of electrical impedance. Differences in reference equivalent threshold vibratory force levels were estimated by comparing hearing threshold measurements of 60 healthy ears using B81 and B250.
Results
B250 has approximately 27 dB higher sensitivity levels than both B71 and B81 at 250 Hz and can generate higher maximum hearing level at low frequencies: 11.8 to 35.8 dB (125–1000 Hz) higher than B71, and 1.4 to 18.6 dB (125–750 Hz) higher than B81. The maximum average difference in reference threshold force levels was 13.5 ± 8.7 dB higher for B250 at 250 Hz compared to B81.
Conclusions
B250 can produce higher output force with less distortion than B71 and B81, especially at 125 and 250 Hz, which could possibly improve low frequency investigations of the audio-vestibular system.
Introduction
The bone conduction (BC) transducer B250 was first described by Håkansson et al. (Citation2018) with the potential to simplify and improve vestibular evoked myogenic potential (VEMP) investigations by being able to evoke both ocular (oVEMP) and cervical (cVEMP) responses from the mastoid position. The design has since then been further improved with even higher output force at 250 Hz, and in a clinical study on 30 healthy participants conducted by Fredén Jansson et al. (Citation2021), B250 on the mastoid was found to replicate forehead stimulated VEMP responses obtained with the conventional Minishaker B&K 4810 (Brüel & Kjær Sound & Vibration Measurement A/S, Denmark). This simplifies the measurement as the B250 transducer is small enough to be steadily held in place using a P-3333 (Radioear Corporation, Eden Pairie, MN, USA) steel-spring headband compared to the Minishaker that must be handheld by the operator. Conventional audiometric transducers, such as Radioear B71 and B81 (Interacoustics A/S, Assens, Denmark) are also easy to use, but audio-vestibular applications usually require more output power than those devices can deliver.
Since the first publication by Håkansson et al. (Citation2018), there has been an increasing interest from research clinics to use the B250 in their studies. In a publication by Plontke et al. (Citation2021), B250 was used to measure VEMP for verification of preserved cochlear function after partial or subtotal cochlear removal due to intracochlear schwannoma as a complement to standardised testing. Post-operative VEMP using air conducted (AC) stimulation was not an option for those patients as their incus was removed during surgery. In contrast, BC stimulated VEMP using B250 gave normal responses in most of the patients, meaning a preserved function of vestibular receptors.
Abnormally intense VEMP responses have long been considered a marker of superior semicircular canal dehiscence syndrome (SCDS) together with enhanced BC hearing sensitivity at low frequencies and hypersensitivity to internal body sounds - autophony (Gopen et al. Citation2010, Verrecchia et al. Citation2016). A conventional screening test for SCDS is the Weber test from the ankle using a 256 Hz tuning fork to verify body sound hypersensitivity (Watson, Halmagyi, and Colebatch Citation2000). For a more quantified test, it was proposed by Brantberg et al. (Citation2017) to perform a psychoacoustic hearing test in response to BC stimulated vibrations applied at the malleolus using the Minishaker. In Citation2023, Verrecchia et al. introduced a clinical method, called ankle audiometry (AA) where the Minishaker is replaced by the B250 transducer to measure the psychoacoustic threshold from a 250 Hz vibration at the ankle. This procedure allows for high stimulation force with reduced operator dependency and a constant attachment force at the stimulation site, which both simplifies the test and improves its accuracy. More specifically, using a 250 Hz pure tone signal at an intensity of 120 dBRMSFL, it could be possible to diagnose SCDS with a sensitivity of 90% and a specificity of 80%.
The interest for using B250 in more clinical studies including audiometry is increasing and it is therefore a need for a comprehensive electroacoustic evaluation of the device to determine an average sensitivity level, distortion levels, maximum hearing level and electrical impedance. Two widely used transducers for BC audiometry are the conventional Radioear B71 and the relatively new Radioear B81. The B250 was originally developed for improving VEMP measurements, but no previous studies have been focused on audiometry. A hypothesis is that higher output levels with low distortion will be possible to generate using B250 at low frequencies, compared to both B71 and B81.
Before the B81 was introduced to the market, 250 Hz was rarely included in BC audiometry threshold testing as the B71 was limited by high distortion at low frequencies. In Fredén Jansson et al. (Citation2015), the B81 transducer was found appropriate for routine diagnostics at 250 Hz where it could generate hearing levels (HL) up to 52.6 dB or 22 dB higher signal level than the B71. The aim of this study is to investigate if the B250 can be used for audiometry by evaluating the electroacoustic performance of a small series of the latest B250 prototype and to compare it with the corresponding data from the two most widely used audiometric transducers B71 and B81 presented in Fredén Jansson et al. (Citation2015).
Materials and method
This section contains a technical description of the B250 transducer as well as calibration details, measurement setup and statistical analysis for the electroacoustic evaluation.
The transducer
The present design of the B250 transducer is a more clinically adapted version of the one described by Håkansson et al. (Citation2018). Its motor unit is based on the balanced electromagnetic separation transducer (BEST) principle (Håkansson Citation2003) with a dominant resonance peak at 250 Hz. The B250 can be used with a steel-spring headband P-3333 for mastoid stimulation similar to B71 and B81.
In this study, six B250 prototype transducers were evaluated based on measurements of sensitivity level, total harmonic distortion (THD), maximum hearing level and electrical impedance. For comparison with B71 and B81, already published data from six samples of each device in addition to new measurements of maximum hearing level at 125 Hz (not made before) using seven samples of each device were analysed. The B250 has a weight of 80 grams and its surface area facing the skin is slightly concave with an area of 7.1 cm2. The corresponding weight and flat surface of B71/B81 is approximately 20 grams and 1.75 cm2, respectively (Fredén Jansson et al. Citation2015). Also, the B250 steel spring attachments protrudes more than B71/B81, which results in a higher static force of approximately 10 N using the P-3333 headband and a superiorly higher stimulation position on the mastoid. The higher static force of B250 is needed to keep the transducer in place when driven at its maximum levels.
The design of the B250 was initially made for vestibular testing requiring high output capability at lower frequencies (therefore it uses a bigger internal mass to lower the resonance frequency) and a bigger and lightly concave attachment area for a more stable attachment to the mastoid. It is also designed to have direct attachment of the transducer motor unit to the driving side of the casing thus eliminating the casing resonance at 4 kHz that causes some reliability issues in the traditional designs (B71/B81) where the transducer is attached to the back side of the casing.
Calibration
The artificial mastoid B&K4930 was calibrated using the pad correction curve from Fredén Jansson et al. (Citation2021) to convert its output voltage to the dynamic force “Fin” applied to the rubber pad, see the curve in and the set-up in . The calibration values are very similar between B250 and B81/B71 at low frequencies, but above 1 kHz there is a force sensitivity level difference caused by the larger and concave contact surface area of B250, see . Even though B250 requires a static force of 10 N during the measurement, all transducers were calibrated with the standard static force of 5.4 N to comply with B&K4930 calibration specifications. To account for the larger and concave surface with a contact area of 7.1 cm2, an aluminium adaptor with the same shape was attached to the impedance head B&K8001 to determine the pad sensitivity for B250, The pad sensitivity when using B71/B81 was determined using the impedance head B&K8000 which has a contact area of 1.75 cm2.
Figure 1. Pad correction curves for B250 (solid line) and B71/B81 (dashed line) when calibrating the transducers using the artificial mastoid B&K4930.
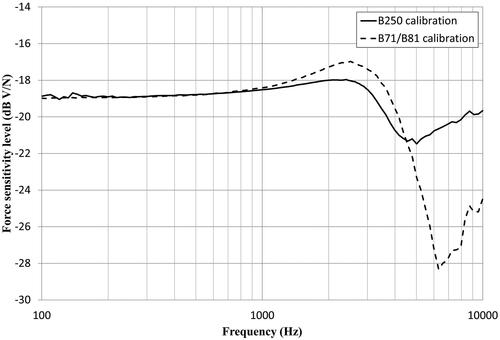
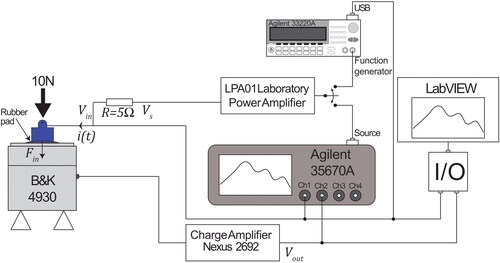
Figure 2. Setup for electroacoustic measurement of B250. The transducer was applied with a static force of 10 N to the rubber pad of the artificial mastoid B&K 4930. The output voltage “Vout” was collected and monitored using LabVIEW and the signal analyser Agilent 35670 A. Further, “Vout” was converted to the transducer force “Fin” using the sensitivities of both the pad and charge amplifier Nexus 2692. The LPA01 power amplifier was required to deliver sufficient electrical input power to the transducer. A series resistor “R” of 5 Ohms was used to measure the current “i(t)” driving the transducer.
The present calibration of the B250 using the artificial mastoid B&K 4930 should just be regarded as a first rough estimation of the mechanical output and not compliant with International Standards ISO 389 and IEC 60318-6. As the B250 has a larger and non-flat contact surface with an application force of 10 N in the clinical setting, the artificial mastoid acts just as a mechanical coupler and further investigation is needed to determine the equivalence with the human mastoid and the real stimuli force level.
Measurement setup
The measurement setup for electroacoustic measurements of B250 on the artificial mastoid B&K4930 is shown in . To avoid the dynamic vibration force from exceeding the static force, the B250 transducers were attached with 10 N (corresponding to a dynamic force of 140 dB re. 1 µN). The input voltage “Vin” was applied either by the function generator Agilent 33220 A (Agilent Technologies Inc., CA, USA) via USB using LabVIEW (National Instruments Corporation, TX, USA) or by the built in source of the Agilent 35670 A signal analyser. An LPA01 Laboratory Power Amplifier (Newtons4th Ltd., UK) was used to deliver sufficient electrical input power to the transducers. During the electrical impedance measurement, the input current “i(t)” was measured via a 5 Ω resistor as a function of “Vin” and “Vs.” The output voltage from the artificial mastoid was measured as “Vout” after a Nexus charge conditioning amplifier 2692 (Brüel & Kjær Sound & Vibration Measurement A/S, Denmark) to compensate for cable capacitances. The Nexus charge amplifier had a flat voltage gain of 0 dB within the measured frequency range.
Sensitivity level of B250
To obtain the sensitivity level of B250, the vibratory force level of B250 was measured on the artificial mastoid using a swept sine from 100 to 10 000 Hz with relatively low RMS input voltage Vin of 100 mV to avoid risking the dynamic peak force to exceed the static force of 10 N. The dynamic output force of B250, which is equal to the mastoid input force Fin, was measured by applying the frequency-dependent force sensitivity level (pad correction) of the artificial mastoid (see ) (including the charge amplifier) to the measured level of the output voltage Vout. Related to the input voltage Vin, the sensitivity level of the B250 is finally presented in units of decibel relative to 1 µ Newton per volt (dB re 1 µN/V).
Total harmonic distortion
Total harmonic distortion (THD) in resonant BC transducers is limiting the low frequency performance rather than maximum allowed operation voltage. At high frequencies where harmonic distortion is typically lower, the maximum output is instead limited by the operation voltage. As B250 comprises a BEST transducer and has a different frequency response than B71 and B81, it is expected to generate low, but different distortion levels for the same input voltage. The THD of B250 was measured from 100 to 5000 Hz at a fixed input voltage of 1 VRMS and calculated according to the IEC 60268-3 standard and after pad correction using the sensitivity levels in . Up to five harmonics were included and those above 10 Hz were excluded as they are outside the valid frequency range of the artificial mastoid. In addition, maximum hearing level was measured at a fixed THD level rather than the THD at a fixed force level.
Maximum hearing level
According to IEC 60645-1 (Citation2017), the maximum hearing level is determined at the level where the fundamental frequency is distorted with a THD of 6%. Distortion normally decreases for higher frequencies and at some point, the maximum hearing level will instead be limited by the maximum allowed operation voltage which in this study was set to 6 VRMS. This input voltage was never exceeded to avoid risks of overheating or mechanical damage of the transducer from long term use. The maximum hearing levels of type-1 audiometers are specified in IEC 60645-1 (Citation2017) between 250 and 8000 Hz, but to investigate the possibility of using even lower frequencies with B250, maximum hearing levels were measured for the audiometric frequencies from 125 to 8000 Hz.
Reference equivalent threshold vibratory force levels
Conversion of force levels into decibel hearing levels require reference equivalent threshold force levels (RETVFLs) for each transducer type. The REVTFLs for B71 are specified in ISO 389-33 (Citation2016) and are applied also to B81 as those transducers are very similar and having identical contact surface and static attachment force. Regarding B250, the RETVFL values are expected to be different as the transducer inside the casing is mounted differently and the casing is both larger and has a slightly concave contact surface. Also, when using a P-3333 steel spring headband, the static attachment force will increase from typically 5.4 N to 10 N because the B250 transducer protrudes more than B71 and B81. Furthermore, the protrusion results in a superiorly higher stimulation position on the mastoid as the effective length of the headband becomes shorter and this could possibly have an effect on the RETVFL values as well.
To obtain RETVFL values for B250, data of pure tone hearing thresholds from 30 normal hearing subjects (15 male and 15 female, 20–37 yrs) using both B250 and B81 were analysed and compared. Each participant was tested on both ears, which resulted in a total of 60 tested ears. The differences in RETVFL values between B250 and B81 were calculated as the average individual difference in BC hearing thresholds obtained with both transducers calibrated in terms of force level. As the AC40 audiometer from Interacoustics A/S (Assens, Denmark) used in this test could only measure down to 250 Hz, the RETVFL values for B250 was not determined at 125 Hz. Therefore, the value used for B81 at 125 Hz was used also for B250 to convert force into hearing levels even though it may be a rather rough assumption in practice. This clinical part of the study was approved by the Regional ethical review board in Gothenburg (537-18) and performed in accordance with the declaration of Helsinki. All participants signed a written informed consent. Normal hearing criterion for inclusion was based on air conduction AC hearing thresholds better than 20 dB HL and no experience of hearing-related problems.
The threshold measurements were performed in a sound insulated booth of 16 m3 with the Radioear B81 transducer and TDA39 headphones calibrated using reference values specified in ISO 389 standards. The Hughson Westlake procedure was followed to determine the thresholds and each audiometric frequency was tested in the order from 1 kHz up to 8 kHz following 750 Hz down to 250 Hz. Narrowband noise was applied as masking of the contralateral ear when needed.
Statistics
All data have been analysed by means and standard deviations. The statistical analysis was based on a paired two-tailed t-test using a probability value of p < 0.05 for rejecting the null hypothesis to decide upon a statistically significant difference when comparing the electroacoustic performance. Regarding the RETVFL investigations, there are two dependent groups as data from both transducer types were obtained from measurements on the same subjects. This is compensated for by a Bonferroni corrected p value of 0.0125 based on a total of 4 comparisons (2 ears and 2 transducer types).
Results
The electroacoustic performance of six B250 transducers is presented in this section in relation to the performance data of six B71 and six B81 transducers published in Fredén Jansson et al. (Citation2015). For comparison purposes, complementary measurements of maximum hearing level at 125 Hz have been included for seven B71 and B81 as it was not included the published data. Numerical values at the audiometric frequencies between 125 to 8000 Hz are summarised in .
Table 1. Comparison of sensitivity level, total harmonic distortion, maximum hearing level, and RETVFL values for B250, B71 and B81 for audiometric frequencies between 125 and 8000 Hz.
Sensitivity level of B250
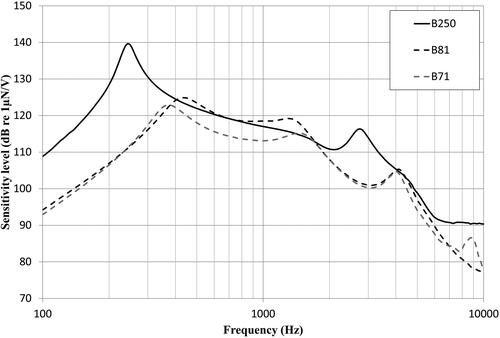
The average sensitivity level of B250 in relation to B71 and B81 measured on the artificial mastoid B&K4930 for a swept sine from 100 to 10 000 Hz is plotted in . Two distinct resonance peaks are observed at approximately 243.7 ± 6.3 Hz and 2744 ± 43 Hz with levels of 140.1 ± 0.3 dB and 116.4 ± 0.6 dB re. 1 µN/V, respectively.
Figure 3. Average sensitivity level for B250 (solid black), measured at 0.1 VRMS between 100 and 10 000 Hz, given in dB re 1 µN/V and plotted together with the corresponding values for B71 and B81 (dashed lines) from Fredén Jansson et al. (Citation2015).
Total harmonic distortion
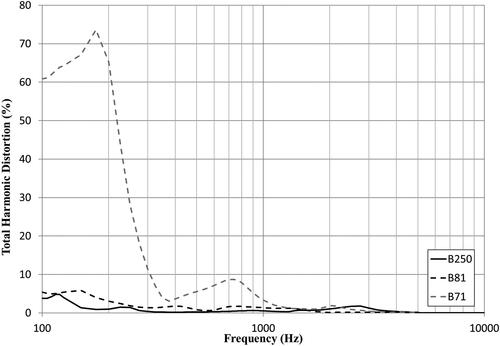
The THD of B250 when measured for an input voltage of 1 VRMS is shown in in relation to the THD of B71 and B81, respectively. A maximum THD of 4.8 ± 3.3% was observed for B250 at 120 Hz and for all frequencies below 1500 Hz it was either similar to or lower than the THD of B81. For audiometric frequencies, B250 was found to generate statistically significant lower THD values than B71 at and below 2000 Hz, and lower than B81 at 500, 750 and 1000 Hz.
Figure 4. Average total harmonic distortion at 1 VRMS of B250 (solid line) plotted together with the corresponding values for B71 and B81 (dashed lines) from Fredén Jansson et al. (Citation2015).
Maximum hearing level
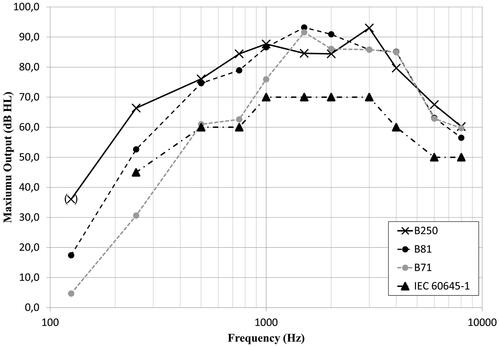
The maximum hearing level of B250 was in average 36 to 93 dB HL in the frequency range from 125 to 8000 Hz, with the lowest level at 125 Hz and the highest at 3000 Hz, see . At 125 and 250 Hz, the maximum hearing level was limited by the THD of 6%, and at higher frequencies, it was mainly limited by 6 VRMS except at 3000 Hz where it was limited by the THD. For frequencies at and below 750 Hz, the maximum hearing level for B250 was found to be statistically significant (p < 0.05) higher than both B71 and B81, with the largest improvement over B81 of 18.6 dB at 125 Hz. Furthermore, the standard audiometer requirements specified in IEC 60645-1 (Citation2017) regarding maximum required bone vibrator output are fulfilled using the B250 with good margin at all frequencies.
Figure 5. Average maximum hearing level of B250 (solid line) plotted together with the corresponding values for B71 and B81 (dashed lines). The B71 and B81 values at 125 Hz are measured in this study using seven devices of each type and values for the remaining frequencies were measured by Fredén Jansson et al. (Citation2015). (X) at 125 Hz indicates that the same RETVFL has been used for all three devices as it was not obtained for B250.
Electrical impedance
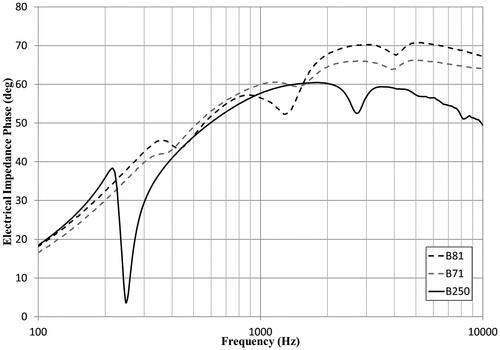
The input DC resistance, measured with a multimeter, was on average 3.32 ± 0.02 Ω for all six B250 transducers. For alternating signals, the impedance magnitude measured with the signal analyser Agilent 35670 A increased with frequency up to a maximum of 122.7 ± 19.8 Ω shown in . Minor peaks are observed at the corresponding resonance frequencies for all devices and are more prominent in the phase of the electrical impedance shown in . Both the magnitude and phase curves follow the characteristic shape of an inductive load, but the B250 show a higher magnitude and lower phase for increased frequency as compared to B71 and B81.
Figure 6. Average electrical impedance of B250 (solid line) plotted together with the corresponding values for B71 and B81 (dashed lines) from Fredén Jansson et al. (Citation2015).
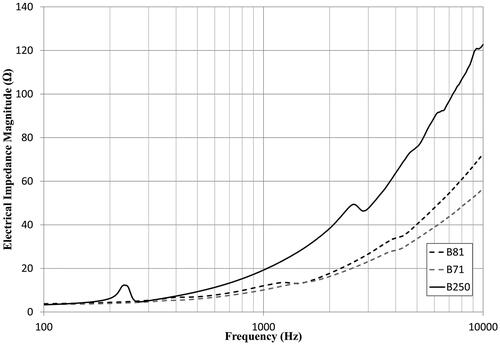
Figure 7. Average phase of the electrical impedance of B250 (solid line) plotted together with the corresponding values for B71 and B81 (dashed lines) together with non-published data from the transducers used in Fredén Jansson et al. (Citation2015).
Reference equivalent threshold force levels
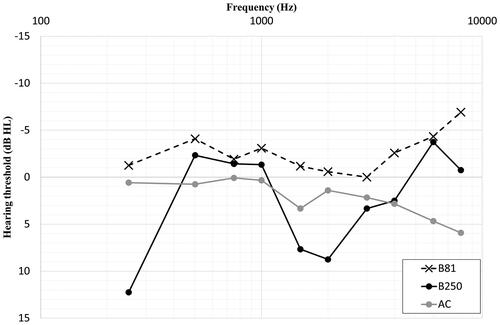
The average pure tone BC hearing thresholds measured with B250 and B81 in a total of 60 ears (30 subjects) are shown in . Numerical values together with statistical results are shown in . The RETVFL values for B250 were then estimated as the relative difference between the hearing thresholds of both devices. The largest difference is found at 250 Hz where the B250 has 13.5 ± 8.7 dB higher RETVFL values than B81.
Figure 8. Average bone conduction hearing thresholds of 60 healthy ears using B81 and B250 for the determination of reference equivalent threshold force levels for the B250.
Discussion
The B250 transducer is designed to be most powerful at 250 Hz where it on average was found to be 27 dB stronger than B71 and B81, respectively. In terms of hearing levels, limited by either 6% THD or an input voltage of 6 VRMS, calculated using the RETVFL values determined in this study, the corresponding improvement was 35.8 and 13.8 dB, respectively. The difference in sensitivity level is clearly noticed in where it is also obvious that the B250 have two resonance peaks as compared to the three found in B71 and B81. In B71/B81, the third peak at 4 kHz is caused by a resonance in the casing due to the internal mounting of the motor unit to increase the output at high frequencies. This peak is known to cause some uncertainty in ordinary hearing threshold testing probably related to radiation of airborne sound from the casing. Therefore, the ear canal is sometimes occluded during the BC audiometry with B71 and B81 to avoid any risk for radiated sound to cause false bone thresholds at high frequencies (Lightfoot and Hughes Citation1993; Margolis et al. Citation2013). In B250, the motor unit is mounted to the side of the casing facing the skin, which is opposite to the mounting side in B71 and B81. The mounting method will affect the sound transmission path via the casing to the skull and possibly contribute to the difference of 5.1 ± 6.2 dB seen in RETVFL levels and hearing thresholds in .
In , it can be seen that the THD for B250 is either similar to or lower than the THD for B81 at frequencies below 1500 Hz when driven at an input voltage of 1 VRMS even though the output force is higher below 750 Hz according to the sensitivity level shown in . Most importantly, this difference correlates to the statistically significant improvement of increased maximum hearing levels for B250 at 125 Hz (+18.6 dB), 250 Hz (+13.8 dB), 500 Hz (+1.4 dB) and 750 Hz (+5.5 dB). Moreover, this will further increase the margin to the IEC 60645-1 (Citation2017) standard audiometer requirements at those frequencies. Regarding standard values at 125 Hz, there are no previously developed audiometer requirements for bone vibrators, as this low frequency has rarely been used before. For definite standard RETVFL values at 125 Hz, further BC threshold testing should be included instead of using the B71 data. However, this method of determining the RETVFL values is only an estimation based on the relative difference in BC threshold between transducer types. To determine absolute RETVFL values for B250, it would be recommended to follow the ISO 389-9 standard guidelines where applicable.
The method of using the B71 standardised RETVFL value at 125 Hz also for B250, resulted in an estimated maximum vibration of 36.0 ± 3.3 dB HL before reaching a THD of 6%, see . Even though this is a relatively rough estimation, it is an indication that B250 may possibly allow for routine hearing diagnostics at 125 Hz in the future. The corresponding hearing levels from complementary measurements of seven B71 and B81 transducers were 4.7 ± 1.2 dB HL and 17.4 ± 3.3 dB HL, respectively. In a study by Fredén Jansson et al. (Citation2017), the maximum hearing level of one B71 and one B81 transducer were measured to 5.9 and 14.8 dB HL, respectively, which is within the findings of this study.
For frequencies above 250 Hz, the maximum hearing levels for B250 could possibly be increased further before reaching a THD of 6% by allowing a higher maximum operation voltage. It should be mentioned that the maximum input voltage should be applied only temporary (< 5 seconds) to avoid internal heating of the motor unit from continuous tones that can cause permanent damage.
The electrical impedance of all transducer types was found statistically significant different at the audiometric frequencies, even though the average values were considered similar for the application. This means that B250 can be driven by the same voltage source and is compatible with the same equipment used for audiometric and vestibular investigations without the need for an external power amplifier. In comparison with B71 and B81, the electrical impedance magnitude of B250 was similar at low frequencies and increased up to a maximum difference of 66.0 ± 20.1 and 50.1 ± 19.2 Ω at 10 kHz, respectively. This difference is assumed to be caused by eddy current in the counteracting mass of Wolfram, acting as a resistive load inside the B250 transducer, which also correlates to the decrease in phase seen at the higher frequencies in .
Even though high hearing levels can be generated with low distortion, at some level, the patients will start to feel the transducer vibrating on the skin as the force exceeds their threshold of vibrotactile sensation (Nober Citation1964). Overlapping of audiometric and vibrotactile thresholds are more likely to occur at low frequencies (Brinkmann and Richter Citation1983), but patients can easily discriminate between those two sensations (Clemente et al. Citation2017). In the study by Fredén Jansson et al. (Citation2017), the vibrotactile thresholds were measured in 16 bilaterally deaf patients who could not respond to sound, which resulted in an average vibrotactile threshold of 17 ± 7 dB HL at 125 Hz and 40 ± 11 dB HL at 250 Hz using the B81. This means that the high hearing levels in general and including those possible to obtain with B250, should be used with care to avoid interfering with the vibrotactile sensation, especially at 125 and 250 Hz.
It is clear that the present prototype B250 transducer design used in this study has some important advantages over today’s available audiometric transducers Radioear B71/B81, but it is still not available as a CE marked product. We are working together with an industrial partner to make the B250 generally available for applications in both vestibular and hearing testing applications.
Conclusions
The prototypes of the B250 used in this study was shown to be electrically comparable with B71/B81 in terms of electrical impedance and thus possible to directly connect to standard audiometers.
The pad correction needed for calibration of the transducer on an artificial mastoid had a maximum deviation of only 2 dB at high frequencies and was in general flatter than for B71/B81, meaning that a fixed calibration factor may be sufficient.
In frequency response measurements, it was found that the B250 had a higher output force level than the B71/B81 at low frequencies, and most importantly, it can generate higher hearing levels with less distortion at and below 750 Hz. Finally, the B250 has no casing resonance at 4 kHz which may be advantageous in hearing threshold measurements at that frequency.
Disclosure statement
The co-author Bo Håkansson holds patents regarding the transducer principle of B250 and report non-financial support from Ortofon A/S and non-financial support from Interacoustics, during the conduct of the study. The authors report no other conflicts of interest in this work.
Additional information
Funding
References
- Brantberg, K., L. Verrecchia, and M. Westin. 2017. “Enhanced Auditory Sensitivity to Body Vibrations in Superior Canal Dehiscence Syndrome.” Audiology & Neuro-Otology 21 (6):365–371. https://doi.org/10.1159/000450936.
- Brinkmann, K., and U. Richter. 1983. “Determination of the Normal Threshold of Hearing by Bone Conduction using Different Types of Bone Conduction Vibrators.” Journal of Audiology & Otology 22:62–85, 114–122. [ Mismatch
- Clemente, F., B. Håkansson, C. Cipriani, J. Wessberg, K. Kulbacka-Ortiz, R. Brånemark, K.-J. Fredén Jansson, and M. Ortiz-Catalan. 2017. “Touch and hearing mediate osseoperception.” Scientific Reports 7 (1):45363. https://doi.org/10.1038/srep45363.
- Fredén Jansson, K. J., B. Håkansson, L. Johannsen, and T. Tengstrand. 2015. “The Electro-Acoustic Performance of the New Bone vibrator Radioear B81.” International Journal of Audiology 54 (5):334–340. https://doi.org/10.3109/14992027.2014.980521.
- Fredén Jansson, K. J., B. Håkansson, S. Reinfeldt, L. Fröhlich, and T. Rahne. 2017. “Vibrotactile Thresholds on the Mastoid and Forehead Position of Deaf Patients Using Radioear B71 and B81.” Ear & Hearing 38 (6):714–723. https://doi.org/10.1097/AUD.0000000000000456.
- Fredén Jansson, K. J., B. Håkansson, S. Reinfeldt, A. C. Persson, and M. Eeg-Olofsson. 2021. “Bone Conduction Stimulated VEMP Using the B250 Transducer.” Medical Devices (Auckland, N.Z.) 14:225–237. https://doi.org/10.2147/MDER.S317072.
- Gopen, Q., G. Zhou, D. Poe, M. Kenna, and D. Jones. 2010. “Posterior Semicircular Canal Dehiscence: First Reported Case Series.” Otology & Neurotology: Official Publication of the American Otological Society, American Neurotology Society [and] European Academy of Otology and Neurotology 31 (2):339–344. https://doi.org/10.1097/MAO.0b013e3181be65a4.
- Håkansson, B. 2003. “The Balanced Electromagnetic Separation Transducer: A New Bone Conduction Transducer.” The Journal of the Acoustical Society of America 113 (2):818–825. https://doi.org/10.1121/1.1536633.
- Håkansson, B., K. J. Fredén Jansson, T. Tengstrand, L. Johannsen, M. Eeg-Olofsson, C. Rigato, E. Dahlström, and S. Renfeldt. 2018. “VEMP using a New Low Frequency Bone Conduction Transducer.” Medical Device < s: Evidence and Research 11:301–312. https://doi.org/10.2147/MDER.S171369.
- IEC 60645-1. 2017. Electroacoustics –Audiometric Equipment – Part 1: Equipment for Pure-Tone Audiometry. Geneva: IEC.
- ISO 389-3. 2016. Acoustics – Reference Zero for the Calibration of Audiometric Equipment – Part 3: Reference Equivalent Threshold Force Levels for Pure Tones and Bone Vibrators. Geneva: ISO.
- Lightfoot, G. R., and J. B. Hughes. 1993. “Bone Conduction Errors at High Frequencies: Implications for Clinical and Medico-Legal Practice.” The Journal of Laryngology & Otology 107 (4):305–308. https://doi.org/10.1017/S0022215100122881.
- Margolis, R. H., R. H. Eikelboom, C. Johnson, S. M. Ginter, D. W. Swanepoel, and B. C. Moore. 2013. “False Air-Bone Gaps at 4 kHz in Listeners with Normal Hearing and Sensorineural Hearing Loss.” International Journal of Audiology 52 (8):526–532. https://doi.org/10.3109/14992027.2013.792437.
- Nober, E. H. 1964. “Pseudoauditory Bone-Conduction Thresholds.” The Journal of Speech and Hearing Disorders 29 (4):469–476. https://doi.org/10.1044/jshd.2904.469.
- Plontke, S. K., T. Rahne, I. S. Curthoys, B. Håkansson, and L. Fröhlich. 2021. “A Case Series Shows Independent Vestibular Labyrinthine Function after Major Surgical Trauma to the Human Cochlea.” Communications Medicine 1 (1):1–7. https://doi.org/10.1038/s43856-021-00036-w.
- Verrecchia, L., K.J. Fredén Jansson, M., Westin, A., Velikoselskii, S, Reinfeldt, and Håkansson, B. 2023. “Ankle Audiometry: A Clinical Test for the Enhanced Hearing Sensitivity for Body Sounds in Superior Canal Dehiscence Syndrome.” Audiology and Neurotology 28(3): 219–229. https://doi.org/10.1159/000528407.
- Verrecchia, L., M. Westin, M. Duan, and K. Brantberg. 2016. “Ocular Vestibular Evoked Myogenic Potentials to Vertex Low Frequency Vibration as a Diagnostic Test for Superior Canal Dehiscence.” Clinical Neurophysiology 127 (4):2134–2139. https://doi.org/10.1016/j.clinph.2016.01.001.
- Watson, S. R., G. M. Halmagyi, and J. G. Colebatch. 2000. “Vestibular Hypersensitivity to Sound (Tullio Phenomenon): Structural and Functional Assessment.” Neurology 54 (3):722–722. https://doi.org/10.1212/WNL.54.3.722.