
Abstract
Objective
To investigate the benefit of remote-microphone (RM) systems for adults with sensory hearing loss.
Design
Speech recognition in quiet and in background noise was assessed. Participants with hearing loss underwent testing in two device conditions: hearing aids (HAs) alone and HAs with a RM. Normal hearing participants completed testing in the unaided condition. Predictive speech intelligibility modelling using the Hearing-Aid Speech Perception Index (HASPI) was also performed on recordings of HA processed test material.
Study Sample
Twenty adults with sensory hearing loss and 10 adults with normal hearing participated.
Results
Speech recognition for participants with hearing loss improved significantly when using the RM compared to HAs alone fit to Phonak’s proprietary prescription. Largest benefits were observed in the most challenging conditions. At the lowest signal-to-noise ratio, participants with hearing loss using a RM outperformed normal hearing listeners. Predicted intelligibility scores produced by HASPI were strongly correlated to behavioural results.
Conclusions
Adults using HAs who have significant difficulties understanding speech in noise will experience considerable benefits with the addition of a RM. Improvements in speech recognition were observed for all participants using RM systems, including those with relatively mild hearing loss. HASPI modelling reliably predicted the speech perception difficulties experienced.
Introduction
Understanding speech in noisy listening environments remains one of the greatest challenges for individuals with sensory hearing loss using hearing aids (HAs) (Kochkin Citation2000; Picou Citation2020). Difficulties persist even when audibility is accounted for using hearing loss specific amplification (Moore Citation2007; Woods et al. Citation2013). Moreover, despite continued advancements in noise reduction algorithms and directional microphones, HAs remain limited in their capacity to improve speech discrimination in adverse listening environments (Plyler, Tardy, and Hedrick Citation2019; Ricketts and Picou Citation2013). This is particularly evident in situations where the HA user is listening to a target signal over a large distance (> ∼2 metres), with many competing noise sources and/or in environments with high levels of reverberation (Ricketts Citation2000; Ricketts and Hornsby Citation2003).
In environments where HAs provide limited assistance, wireless remote microphone (RM) systems can be used to improve the signal-to-noise ratio (SNR) (Boothroyd Citation2004; Rodemerk and Galster Citation2015). Wireless RMs are relatively small microphones which can be worn by a HA user’s communication partner. They provide direct audio transmission to HAs, reducing the negative impact of distance on speech perception, which is particularly beneficial in noisy or reverberant listening environments. Historically, RM systems used frequency modulation to transmit the audio signal, however, more recently these systems are implementing digital transmission protocols, including low energy Bluetooth or proprietary digital streaming technology (Ricketts, Bentler, and Mueller Citation2017).
Wireless RM systems offered by different manufacturers also vary in terms of the microphone arrangement, with most utilising a dual microphone array to produce a ‘directional beam’. When the RM is worn by a communication partner this can further improve the SNR delivered to the listener by limiting the amount of background noise being transmitted. More recently developed devices (e.g. Phonak Roger Select/Table Mic II), however, use several microphone arrays which generate ‘multiple beams’ to improve signal specificity. This multibeam technology works by using a built-in accelerometer in conjunction with multiple microphones to determine the microphone beam arrays with the highest SNR. Only the auditory signal from two beams with the optimal SNR is then transmitted to the listener (Gigandet, Fulton, and Smith Citation2018; Thibodeau Citation2020).
The advantages of using RM systems have been documented in both school-aged children and adults with hearing impairment. Significant improvements in classroom speech recognition, listening effort, and motivation for children with sensory hearing loss or auditory processing disorders have been reported (Schafer, Kirby, and Miller Citation2020; Zanin and Rance Citation2016). Likewise, RM systems in conjunction with HAs in the hearing-impaired adult population have been shown to significantly improve speech recognition, reducing negative aspects of distance, noise, and reverberation (Boothroyd Citation2004; Rodemerk and Galster Citation2015). A recent study by Thibodeau (Citation2020) investigated the benefits of current RM technologies (e.g. Phonak Roger Pen and Roger Select) when used in a simulated group dining experience. For this experiment, the RM systems were placed in the centre of the table to simulate how this technology might be used to pick up multiple speakers. In this setting, findings showed the most significant improvements in speech perception ability were afforded to the HA and cochlear implant users when using the RM system with multibeam technology. Speech recognition results of listeners with hearing loss using RM systems have also been shown to surpass those obtained by individuals with normal hearing in adverse listening environments (Thibodeau Citation2014). Overall, however, high quality evidence in this area is lacking and continued technological advancements require ongoing research to determine whether further improvements are afforded to the listener (Maidment et al. Citation2018).
While behavioural assessments of speech perception ability remain the gold standard for determining the efficacy of hearing device features, there has been growing interest in algorithms that make use of auditory filter models to produce metrics relating to various aspects of auditory perception, including speech intelligibility and quality (Van Kuyk, Kleijn, and Hendriks Citation2018). Compared to behavioural assessments, such algorithms can be quickly implemented, are cost-effective, reliable, and can be easily automated (Falk et al. Citation2013). Additionally, they can provide a way to expand our understanding of the functioning of the auditory system and how it is altered in individuals with hearing impairment. Overall, these algorithms work either by comparing a modified or degraded speech signal to a clean reference version (intrusive), or by directly evaluating the signal of interest (non-intrusive). While non-intrusive algorithms may be more widely applicable because they do not require a reference signal, they are typically less accurate in predicting speech intelligibility compared to intrusive algorithms (Falk et al. Citation2015; Andersen et al. Citation2017).
The Hearing-Aid Speech Perception Index (HASPI) developed by Kates and Arehart (Citation2014, Citation2021) is an intrusive algorithm that uses a sophisticated auditory model to provide predictions relating to the intelligibility of a recorded speech signal. HASPI is one of the few predictive algorithms that attempts to replicate the effects of sensory hearing loss based on an input audiogram (Kates Citation2013; Van Kuyk, Kleijn, and Hendriks Citation2018). In particular, the HASPI auditory model simulates several of the physiological changes attributable to outer and inner hair cell loss depending on the extent of the hearing loss (Kates Citation2013). Attributes that are modelled include loss of audibility, loss of non-linear compression, broadening of cochlear filters, and a greatly simplified version of the inner hair cell synapse, which incorporates a further attenuation stage and adaptation of the inner hair cell firing-rate (Kates Citation2013; Kates and Arehart Citation2014; Kates and Arehart Citation2021). Additionally, HASPI has been shown to outperform other intrusive algorithms on a range of speech materials not used in the training of the auditory model, making it an ideal candidate for use with different speech perception assessments (Van Kuyk, Kleijn, and Hendriks Citation2018). As such, HASPI has been used to evaluate differences in RM system technology (Salehi, Parsa, and Folkeard Citation2018), differences in premium and basic HAs (Kates et al. Citation2018), and to assess different HA processing algorithms (Lai and Zheng Citation2019; Rasetshwane et al. Citation2019).
The purpose of this study was to evaluate the speech recognition ability of adults with hearing loss in background noise in 2 conditions: HAs alone and HAs in conjunction with a wireless adaptive digital RM that has multibeam technology (HAs + RM condition). Additionally, results from the participants with hearing loss were compared to unaided normal hearing listeners and to speech intelligibility predictions produced by HASPI version 2.
Materials & methods
Ethics approval
All research methods and data collection were conducted in accordance with the ethical standards defined in the 1964 Declaration of Helsinki. Ethics approval was obtained through the Human Research Ethics Committee of the Royal Victorian Eye & Ear Hospital (Approval #13/1106H/18). All participants provided written and informed consent and were eligible to withdraw from the study at any time.
Part I: speech recognition assessments
Participants
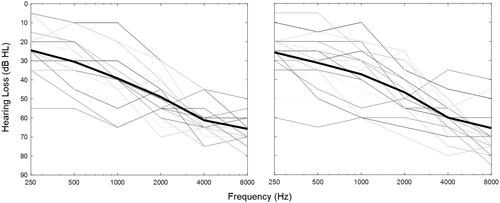
Twenty individuals (ten female) with bilateral sensory hearing loss ranging from mild to severe degree participated in the study (Mean age = 72.9 ± 5.8 years). In addition, ten normal-hearing (NH) control participants (Mean age = 24.5 ± 4.8 years) were evaluated. Participants were considered to have normal hearing if their pure-tone audiometry thresholds were ≤ 20 dB HL. Demographic details of the participants with hearing impairment are shown in Supplementary Table S1 (http://tandfonline.com/doi/suppl.) and their hearing thresholds are shown in . Participants with hearing loss were recruited through the University of Melbourne Audiology Clinic. Control participants were recruited by word of mouth through friends and colleagues of the authors (JZ and GR).
Figure 1. Hearing thresholds of the left and right ear are shown in the left and right panels respectively for the hearing-impaired participants. Average hearing thresholds are represented by the bold black line.
Hearing technology
For this experiment, participants with hearing loss were fitted binaurally with Phonak Audéo P90-312 receiver-in-the-canal style hearing aids at least two weeks prior to data collection. This was to ensure that the HAs were compatible with the RM used in this study. The HAs were setup to be used in their automatic operating system (AutoSense OS), which analyses the listening environment and adjusts features such as automatic noise reduction and adaptive multichannel beamforming technology accordingly. The HAs were fitted to each participant’s hearing loss using the Phonak Adaptive Digital 2.0 fitting prescription. To allow participants to acclimatise to these aids, they were advised to wear them in place of their own aids for the 2-weeks prior to testing. Furthermore, participants were encouraged to communicate any issues if the performance of the provided HAs didn’t match the aids they normally wear. It’s important to note, however, that while the functionality of the participants’ typical hearing aids was evaluated using real ear measurements, utilising the Interacoustics Affinity 2.0 equipment and adjusted to adhere to NAL-NL2 targets, the study aids were not subjected to real ear measurements as part of the verification process. Adjustments were instead made to the HA settings remotely based on the participant’s subjective experience. Hearing aid acoustic coupling was limited to standardised dome earpieces, selected based on the audiological expertise of an experienced clinical audiologist (see Supplementary Table S1 for details). Remote microphone testing was conducted using a Phonak Roger Select iN, paired directly to each participant’s HAs. The RM was used in default mode for the entirety of the testing. Default mode adapts the gain of the transmitted signal according to the intensity of the speaker’s voice and background noise to improve the SNR.
Equipment and test setup
The room and equipment setup were based on that used in Thibodeau (Citation2014). Speech recognition testing was carried out in a large, carpeted room (6.0 × 4.5 metres). Four loudspeakers (Infinity SM65), powered by two Rotel A10 amplifiers, were placed in the corners of the room and were used to deliver the noise stimuli. A single loudspeaker (Behringer MS16), placed at the front of the room, provided the speech stimulus. For testing in the HA + RM condition, the Phonak Roger Select iN was suspended 25 cms below the ‘speech’ loudspeaker to simulate the position around a wearer’s neck in a ‘real-world’ setting. During the testing, the participants sat on a chair positioned 3.5 metres from the centre loudspeaker. The speech and noise stimuli were presented via two Hewlett Packard Probook laptops through the onboard soundcard (Realtek(R) Audio) using Windows Media Player.
Stimuli
Open-set speech recognition testing was carried out using City University of New York (CUNY)-like sentences, which are based on the CUNY sentence lists (Boothroyd et al. Citation1988) but are spoken by an Australian-accented speaker and are not cued by a contextual topic. Each CUNY-like sentence list is made up of 12 sentences containing 102 words in total. Sentences were presented at a fixed signal intensity, calibrated to be ∼63 dBA at the position of the participant and sentence lists were randomised for each participant. Each word correctly repeated by the participants received a score. Once all the testing was completed, a percentage correct score was calculated. Four talker babble was used as competing background noise and calibrated at the position of the participant’s head. CUNY-like sentences were presented in quiet (no noise presented in a quiet room with a noise floor <40 dBA [+23 dB SNR]) and at six different noise levels for each test condition: 55- (+8 dB SNR), 60- (+3 dB SNR), 65- (−2 dB SNR), 70- (−7 dB SNR), 75- (−12 dB SNR), and 80 dBA (−17 dB SNR). While the authors acknowledge real world SNRs are reportedly much higher than the lowest SNR assessed in this study (Smeds, Wolters, and Rung Citation2015; Wu et al. Citation2018), it remains feasible that some HA users may be subjected to such conditions during day-to-day activities.
Procedure
All participants with hearing loss completed speech recognition testing in the HA only and HA + RM condition for all the noise levels. All normal hearing control participants completed testing for the unaided condition at each noise level. To ensure the participants understood the task, a practice list of 6 CUNY-like sentences was administered in quiet at the beginning of the test session. Thereafter, a full list of CUNY-like sentences was presented at each noise level. For each participant, the noise level, condition, and CUNY-like sentence lists were randomised throughout the assessment. Additionally, participants with hearing loss were blinded to the test condition, meaning that the RM system was positioned at the speaker for all test conditions and participants were not explicitly made aware of whether the RM was in-use. An experienced audiologist scored each participant on the total number of words correctly repeated on each of the CUNY-like sentence lists.
Part II: predictive modelling using the hearing-aid speech perception index (HASPI) version 2
Recording of hearing-aid processed speech recognition test material
CUNY-Like sentence list 1 was used for the HASPI v2 analysis and was recorded using each participant’s HA settings per ear for all test conditions. Recordings were performed using a KEMAR manikin, situated in the same position and test environment as the participant. The KEMAR was fitted with average adult pinna replicas and a 1.26 cc G.R.A.S externally polarised ear simulator (RA0045). G.R.A.S ½-inch pre-polarised pressure microphones and 26AM preamplifiers, powered by a G.R.A.S (type 12AK) power module, were connected to the 1.26 cc couplers, and situated within the KEMAR head. Recordings were made by passing the electrical signal from the G.R.A.S preamplifiers to a Zoom H4N 4-channel audio recorder, which was setup to interface with a Hewlett Packard Probook laptop via a USB connection. Audacity 3.2.1 (https://www.audacityteam.org/), an open-source digital audio editor recording application, was used to capture the input signal. Time-alignment of the signals was performed automatically by the HASPI v2 algorithm.
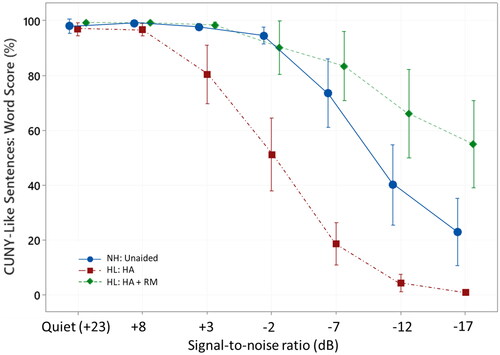
Figure 2. Mean percentage scores for behavioural speech recognition testing obtained for the normal hearing (NH) group in the unaided condition (NH: Unaided), and the hearing loss (HL) group in both the hearing aid (HL: HA) and the hearing aid + remote microphone (HL: HA + RM) condition. Error bars represent the 95% confidence interval of the word scores obtained at each of the seven SNRs.
HASPI v2 analysis
The recordings were analysed using HASPI v2, which was obtained directly from its developer (Kates, personal communication, November 25, 2022) and implemented entirely in MATLAB (R2021b, Mathworks). The analysis computed HASPI v2 values by processing both the recorded signals and reference signal through a simulation of the auditory system and comparing the simulated outputs to each other. The HASPI v2 code inputs called for the filenames and sampling rates of the recorded and reference signals, the participant hearing thresholds (at frequencies .25, .5, 1, 2, 4, 6 kHz), and reference signal level in dBSPL (e.g. 63 dBSPL for this study). The reference signal was each participant’s ear-specific recording for CUNY-like sentence list 1 with the highest SNR (i.e. the HA + RM condition in quiet). The test signals were recordings of list 1 using each participant’s hearing aid settings per ear for all test conditions. The reference and test signals were each root-mean-square normalised such that RMS = 1, and the reference signal level was set to 63 dBA, which was the presentation level of the test signal in the behavioural paradigm. HASPI v2 analysed one recording at a time, and iterated through each ear (x2), condition (x14), and participant (x20) for a total of 560. The hearing thresholds changed with each participant/ear combination. A single set of [no HA/no RM] recordings were generated for the normal hearing group, in which hearing thresholds were set to 0. For the normal hearing group, HASPI v2 iterated through each ear (x2) and condition (x7) for an additional 14 analyses, yielding a grand total of 574 individual HASPI v2 results. The final HASPI v2 score to be compared against binaural (behavioural) word scores obtained from each participant was calculated as the average HASPI v2 score between two ears for a single condition.
Statistical analysis
Statistical analyses were completed using Minitab v21.2 and custom scripts generated using MATLAB (R2021b, Mathworks). The statistical significance level was set at 0.05 unless otherwise specified.
Results
All 20 participants with hearing loss completed speech recognition testing at all SNRs and in the two device conditions: HA alone, and HA + RM. All normal hearing control participants completed testing in the unaided condition. Behavioural speech recognition results for each group and test condition are shown in . A two-way repeated measures ANOVA was implemented for the results obtained from participants with hearing loss to investigate the effects of the technology type and noise levels. Results showed significant main effects for technology type, F(1,1) = 230.20, p < 0.001, and for noise level, F(1,6) = 82.85, p < 0.001. There was also a significant interaction between noise level and technology type, F(1,6) = 19.53, p < 0.001. Furthermore, a two-way ANOVA was used to examine the differences between the hearing loss and normal hearing group at the different noise levels. Results showed a significant effect for hearing F(1,1) = 4.96, p = 0.027, and for noise level, F(1,6) = 61.88, p < 0.001. In addition to the behavioural results, predictive modelling generated intelligibility scores based on the recorded HA processed test material for all the participants in both device conditions.
Comparison of behavioural speech recognition results obtained from aided participants with hearing loss versus unaided controls
Two-sample post-hoc t-tests and Cohen’s d effect size calculation were carried out to determine the difference in speech recognition results between the normal hearing group in the unaided condition and the hearing loss group in the HA condition at each SNR. Results are shown in . For SNRs below +8 dB participants with hearing loss using HAs alone had significantly poorer speech recognition scores than unaided participants with normal hearing.
Table 1. T-tests and effect size comparing observed behavioural speech recognition results between different device conditions.
Remote microphone benefit for participants with hearing loss
Post-hoc paired t-tests revealed significant improvements in speech recognition with the use of the adaptive RM system across all SNRs below +8 dB compared to the HA only condition (p ≤ 0.001; ).
Additionally, Pearson’s correlation analyses found no significant relationship between RM benefit and the participant’s 4-frequency average hearing loss (average of 0.5-, 1-, 2- & 4 kHz) or high-frequency average hearing loss (average of 2-, 4-, 6-, & 8 kHz) of the better hearing ear (p > 0.05).
Comparison of behavioural speech recognition results for the aided hearing loss group using a remote microphone versus unaided controls
Post-hoc two-sample t-tests and Cohen’s d effect size calculation were used to compare the difference in observed behavioural speech recognition results between the normal hearing group in the unaided condition and the hearing loss group in the HA + RM condition at each SNR. Results showed that up to a SNR of −17 dB the participants with hearing loss using a RM system did not obtain significantly different speech recognition results compared to the unaided normal hearing participants. In the most challenging listening environment at a SNR of −17 dB, however, the hearing loss group outperformed the normal hearing listeners (p = 0.002) with a Cohen’s effect size of 1.21.
Comparison between observed and predicted speech recognition results
Predicted speech recognition scores produced using HASPI v2 modelling, and the observed behavioural speech scores are shown in for the hearing loss group in both the HA and HA + RM conditions. On average, and when corrected for multiple comparisons (0.05/7 = 0.007), two sample t-tests showed the HASPI v2 predicted scores were not significantly different from the behavioural scores for the HA + RM condition up to and including the SNR of −12 dB (p > 0.05). For the poorest SNR of −17 dB, however, predicted scores were significantly lower (p < 0.001). For the HA only condition, HASPI v2 predicted scores were not significantly different compared to behavioural scores at all SNRs (p > 0.05) except for +3 dB SNR (p = 0.003). Additionally, a comparison of the HASPI v2 predicted scores for the HA only and the HA + RM condition showed a significant improvement in predicted scores when listeners were using the RM at all but the highest SNRs (quiet and +8 dB) ().
Figure 3. Mean percentage scores of observed behavioural speech recognition results (square data points) and HASPI v2 predictions (round data points) obtained for the hearing loss group using hearing aids only (HL: HA) (shown on the left) and using hearing aids plus a remote microphone (HL: HA + RM) (shown on the right). Error bars represent the 95% confidence interval of the word scores obtained at each of the seven SNRs.
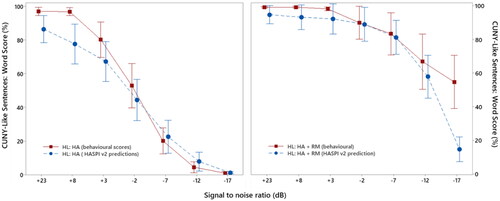
Table 2. Two sample t-tests comparing the HASPI v2 predicted scores obtained from the hearing aid (HA) only and the HA plus remote microphone (RM) condition.
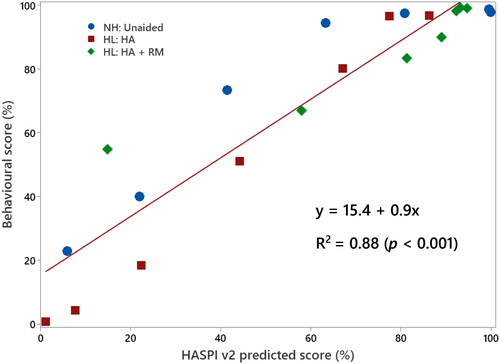
A linear regression analysis was conducted to determine the extent to which the HASPI v2 modelling could predict the behavioural scores. Results show a strong positive correlation between the two measures (β = 0.9, p < 0.001), with the HASPI predictions explaining a high degree of variance in the condition-averaged behavioural scores (R2 = 0.88). Additionally, Pearson’s correlation coefficient was used to assess the strength of the association between observed behavioural and predicted scores. The mean observed speech recognition scores were strongly correlated (r = 89, p < 0.001) with the mean predicted scores produced by HASPI v2, averaged across each condition (). The strength of the correlation was substantially higher for the mean values compared to individual speech recognition scores (r = 0.75, p < 0.001).
Figure 4. Scatterplot of observed behavioural scores (%) versus HASPI v2 predicted speech intelligibility scores (%) for condition-averaged data. Results for normal hearing participants (NH: Unaided) and hearing loss (HL) participants in both the hearing aid (HA) and hearing + remote microphone (HA + RM) condition are shown. Linear regression analysis (solid black line) showed a positive correlation between behavioural and predicted results (slope = 0.9). Pearson’s correlation coefficient, r = 0.88, p < 0.001.
Discussion
There were four main findings of this study that will be discussed in more detail. Firstly, the participants with hearing loss using HAs obtained significantly poorer speech recognition results than their normal hearing peers in the presence of background noise. Secondly, the addition of an adaptive RM system significantly improved speech recognition results for the participants with hearing loss compared to HAs alone when fit using Phonak's proprietary algorithm. Thirdly, the RM systems provided a significant advantage to participants with hearing loss, with speech recognition results being either equivalent to or better than those obtained by their normal hearing peers. Finally, HASPI predictive modelling was statistically sensitive to increasing noise levels and provided a reliable prediction of the benefits of RM technology on speech recognition.
In quiet and at low levels of background noise, speech recognition results for participants with hearing loss using HAs were similar to those of the participants with normal hearing. As the listening environment became more challenging, however, speech perception ability deteriorated more for the participants with hearing loss. These findings are consistent with previous literature, which has shown that despite returning the audibility of speech sounds, HAs are not capable of restoring normal perception, especially in the presence of competing background noise (Humes et al. Citation1999; Moore Citation1996). This remains relevant despite ongoing technological advancements, including the development of adaptive multichannel directional microphone technology, and improvements in automatic noise reduction algorithms (Cox, Johnson, and Xu Citation2014; Magnusson et al. Citation2013). The cause of this notable residual deficit can be explained by certain physiological changes that occur because of sensory hair cell damage and loss within the cochlea.
Typically, sensory hearing loss is thought of as a loss in hearing sensitivity, caused by damage/degeneration of the outer hair cells (OHCs), the ‘amplifiers’ of the cochlea. This leads to reduced auditory nerve activity in response to auditory stimuli. While this interpretation is correct, it is not the complete picture – OHC loss also causes a loss of compressive non-linearity (i.e. in a normal functioning cochlea the OHCs provide more gain for soft intensity sounds than loud sounds), and a broadening of the cochlear filters, resulting in reduced frequency selectivity (Ruggero, Rich, and Recio Citation1996; Oxenham and Bacon Citation2003). Additionally, loss of the inner hair cells, which are responsible for the neural transduction of acoustic energy within the cochlea, results in reduced excitation levels of the auditory neurons and a reduction in neural phase-locking to the waveform of the auditory stimulus (i.e. the synchronised firing of the auditory neurons to a specific phase of the stimulus) (Moore Citation2007). Phase-locking is essential for encoding the rapid fluctuations of sound pressure within the envelope of a sound, known as the temporal fine structure, of an auditory signal.
While all cochlear changes associated with sensory hearing loss impact the ability to understand speech in background noise, the most salient disruptions are those relating to frequency selectivity and phase-locking (Leek and Summers Citation1996; Lorenzi et al. Citation2006). Reduced frequency selectivity causes smearing of spectral features of an auditory stimulus, making it difficult for a listener to perceive differences in speech sounds. In the presence of background noise this is exacerbated because noise further obscures the spectral peaks (Moore Citation2007). In comparison, disruptions in phase-locking impairs the ability to use gaps or ‘dips’ in fluctuating background noise to attend to a target speech signal (Moore Citation2007). Hence, while HAs primarily aim to restore hearing sensitivity by partially replacing the function of the damaged OHCs using amplification and wide dynamic range compression, they are not capable of overcoming the distorted neural signal inherent to sensory hearing loss.
Although HAs are fundamentally limited in their ability to overcome the effects of background noise, adaptive RM systems provide a valid alternative solution to the problem by substantially increasing the SNR for the listener. In this way, RM systems directly reduce the deleterious impacts of background noise on speech perception ability for individuals with hearing impairment. In the current study, the addition of adaptive digital RM systems for adults with sensory hearing loss ranging from mild-to-severe degree, provided substantial improvements in the ability to discern speech in the presence of background noise. These findings are in agreement with previously reported results, which have shown similar benefits to speech recognition ability with older RM technology (Rodemerk and Galster Citation2015; Thibodeau Citation2014). Moreover, the measured benefit provided by the RM system in the current study occurred irrespective of the degree of hearing loss indicating that even individuals with mild sensory hearing loss can benefit from these devices. While RM technology cannot overcome the distorted neural signal present in individuals with sensory hearing loss, they can remove some of the adverse effects of noise and distance, rendering speech sounds easier to discriminate for the listener.
The study findings showed that improvements in SNR provided by the RM system to the participants with hearing loss enabled them to perceive significantly more speech than the participants with normal hearing in the most challenging listening condition. In this condition, the participants with hearing loss, on average, were able to perceive 32% more words than the normal hearing participants. This would provide a significant improvement in the ability to communicate with others in such noisy situations. Additionally, further benefits should be expected with the addition of visual cues of the talker’s face, which was not provided in the speech recognition testing (Puschmann et al. Citation2019). Given that listening in noisy environments has been shown to cause significant listening related fatigue, decrease engagement, result in withdrawal from social settings, increase physiological stress and negatively affect the quality of life for individuals with hearing loss (Holman et al. Citation2021; Jahncke and Halin Citation2012), RM systems should be considered a viable and necessary option to mitigate these negative consequences.
The HASPI v2 modelling was shown to be sensitive to both the detrimental effects of increasing noise levels on speech intelligibility and to the SNR improvements afforded by RM technology. These findings contribute to the current literature that has shown HASPI to be sensitive to differences in RM technologies (Salehi, Parsa, and Folkeard Citation2018), and different hearing aid processing algorithms (Kates and Arehart Citation2014; Kates et al. Citation2018; Lai and Zheng Citation2019; Rasetshwane et al. Citation2019). Additionally, it shows that HASPI predictions generally reflect behavioural scores, especially for condition-averaged data.
The HASPI predictions, however, were lower than the observed behavioural results and underestimated the RM benefit afforded to the listeners in the condition with the lowest SNR. There are several possible explanations for these findings, some of which may be attributable to limitations in the methodological design of the study. First, a listener can make use of contextual, phonological, and syntactic cues in a sentence to help recognise words that are inaudible or partially audible (Kathleen Pichora-Fuller, M., 2008). This is not a feature that the HASPI v2 model has been trained to incorporate and as such may explain the lower scores produced by the algorithm. Second, an aspect of the HASPI algorithm that is likely to have impacted the predicted speech scores is the complexity of the auditory model used. While the model in HASPI is reasonably sophisticated, it was designed with computational efficiency in mind and as such remains only a close approximation of auditory function (Kates Citation2013). Third, the HASPI analysis was performed by averaging over only CUNY-Like sentence list 1. Given the similarities between phonemic content and sentence structure in each of the lists, this is likely a reasonable approximation of the different lists used in each condition, however, averaging over all the lists implemented for behavioural testing may provide a more accurate analysis overall. Fourth, the recordings used for the HASPI analysis may have benefitted from corrections with real-ear-to-coupler difference values to account for the difference between the participant’s real ear response and the 1.26 cc couplers used in the KEMAR for this experiment. The real-ear-to-coupler difference values would alter the spectral qualities of the recordings, providing a more realistic approximation of the sound signal perceived by the listeners. Fifth, the speech material [e.g. hearing-in-noise test (HINT)] used to train the neural networks implemented in the HASPI algorithm may be more difficult compared to the CUNY-like sentences. Literature reporting pre- and post-operative cochlear implant speech perception results for both assessments does suggest the HINT is the more difficult assessment of the two (Cullen et al. Citation2004; Bassim et al. Citation2005). Sixth, the HASPI v2 model is based on sentences correct, and our behavioural data are reported in terms of words correct. This discrepancy might lead to differences in model predictions. Finally, the HASPI model was originally trained on data obtained from monaural headphone listening and as such may not adequately take into account effects of listening in the free-field or the benefits of binaural hearing, which can provide a significant advantage, especially when listening in noisy environments (Avan, Giraudet, and Büki Citation2015).
There were also several other limitations in this study. The normal hearing control participants were significantly younger than the participants with hearing loss. To account for age-related auditory processing differences and gain a more accurate profile of the HA and RM benefit afforded to older listeners with hearing loss the study could have benefitted from including an age-matched control group. However, even with potential age-related changes to the central auditory nervous system, which has been shown to degrade the ability to perceive speech in the presence of background noise (Kim et al. Citation2006), the elderly participants showed similar or better speech perception in noise than their younger counterparts when wearing the RM system. Additionally, the participants with hearing loss had thresholds that ranged in severity from mild-to-severe, thus limiting the generalisability of the results to individuals with greater degrees of hearing loss. Moreover, the inclusion of more severe hearing losses could have impacted the hearing loss and RM benefit correlation findings. Finally, the study would also have benefitted from the use of real ear verification measures and/or coupler measures to determine whether the HAs and RMs were providing sufficient audibility to the hearing-impaired participants.
In summary, current HA technology remains limited in its ability to overcome the loss in frequency selectivity and the ability to resolve the temporal fine structure of an auditory stimulus, that is inherent to sensory hearing loss. Without the development of new processing schemes that are capable of correcting for these physiological changes, individuals with hearing loss will continue to have difficulty understanding speech in the presence of background noise with HAs alone. In the meantime, however, RM systems continue to be an effective tool for improving access to speech signals in the presence of substantial background noise and over distance for individuals with varying degrees of hearing loss. Therefore, RM systems should be considered viable options for individuals with HAs that report significant difficulties hearing in noisy environments. Additionally, while behavioural assessments of device benefit remain the gold standard in hearing device research, the intrusive HASPI v2 algorithm shows good sensitivity to RM benefit and could be a valid alternative to time-consuming behavioural assessments. Further research is still required to investigate recording-related factors that may influence the reproducibility and accuracy of the modelling results.
Supplemental Material
Download MS Word (18 KB)Acknowledgements
We would like to thank all the participants who generously donated their time to take part in this study. Gary Rance is supported by the Graeme Clark Chair of Audiology and Speech Science. We would also like to thank Sonova who provided the devices used in the study and James Kates for providing access to the HASPI algorithm.
Disclosure statement
No potential conflict of interest was reported by the author(s).
References
- Andersen, A. H., J. M. de Haan, Z. H. Tan, and J. Jensen. 2017, March. “A non-intrusive short-time objective intelligibility measure.” In 2017 IEEE International Conference on Acoustics, Speech and Signal Processing (ICASSP) (pp. 5085–5089). IEEE. https://doi.org/10.1109/ICASSP.2017.7953125.
- Avan, P., F. Giraudet, and B. Büki. 2015. “Importance of Binaural Hearing.” Audiology & Neuro-Otology 20 (Suppl. 1):3–6. https://doi.org/10.1159/000380741.
- Bassim, M. K., E. Buss, M. S. Clark, K. A. Kolln, C. H. Pillsbury, H. C. Pillsbury, III, and C. A. Buchman. 2005. “MED‐EL Combi40+ Cochlear Implantation in Adults.” The Laryngoscope 115 (9):1568–1573. https://doi.org/10.1097/01.mlg.0000171023.72680.95.
- Boothroyd, A. 2004. “Hearing Aid Accessories for Adults: The Remote FM Microphone.” Ear and Hearing 25 (1):22–33. https://doi.org/10.1097/01.AUD.0000111260.46595.EC.
- Boothroyd, A., T. Hnath-Chisolm, L. Hanin, and L. Kishon-Rabin. 1988. “Voice Fundamental Frequency as an Auditory Supplement to the Speechreading of Sentences.” Ear and Hearing 9 (6):306–312. https://doi.org/10.1097/00003446-198812000-00006.
- Cox, R. M., J. A. Johnson, and J. Xu. 2014. “Impact of Advanced Hearing Aid Technology on Speech Understanding for Older Listeners with Mild to Moderate, Adult-Onset, Sensorineural Hearing Loss.” Gerontology 60 (6):557–568. https://doi.org/10.1159/000362547.
- Cullen, R. D., C. Higgins, E. Buss, M. Clark, H. C. Pillsbury, III, and C. A. Buchman. 2004. “Cochlear Implantation in Patients with Substantial Residual Hearing.” The Laryngoscope 114 (12):2218–2223. https://doi.org/10.1097/01.mlg.0000149462.88327.7f.
- Falk, T. H., S. Cosentino, J. Santos, D. Suelzle, and V. Parsa. 2013, May. “Non-Intrusive Objective Speech Quality and Intelligibility Prediction for Hearing Instruments in Complex Listening Environments.” In 2013 IEEE International Conference on Acoustics, Speech and Signal Processing, 7820–7824. IEEE.
- Falk, T. H., V. Parsa, J. F. Santos, K. Arehart, O. Hazrati, R. Huber, J. M. Kates, and S. Scollie. 2015. “Objective Quality and Intelligibility Prediction for Users of Assistive Listening Devices: Advantages and Limitations of Existing Tools.” IEEE Signal Processing Magazine 32 (2):114–124. https://doi.org/10.1109/MSP.2014.2358871.
- Gigandet, X., B. Fulton, and C. Smith. 2018. Roger™ MultiBeam Technology – Enhancing the group listening experience Phonak Insight.
- Holman, J. A., B. W. Hornsby, F. H. Bess, and G. Naylor. 2021. “Can Listening-Related Fatigue Influence Well-Being? Examining Associations between Hearing Loss, Fatigue, Activity Levels and Well-Being.” International Journal of Audiology 60 (sup2):47–59. https://doi.org/10.1080/14992027.2020.1853261.
- Humes, L. E., L. Christensen, T. Thomas, F. H. Bess, A. Hedley-Williams, and R. Bentler. 1999. “A Comparison of the Aided Performance and Benefit Provided by a Linear and a Two-Channel Wide Dynamic Range Compression Hearing Aid.” Journal of Speech, Language, and Hearing Research: JSLHR 42 (1):65–79. https://doi.org/10.1044/jslhr.4201.65.
- Jahncke, H., and N. Halin. 2012. “Performance, Fatigue and Stress in Open-Plan Offices: The Effects of Noise and Restoration on Hearing Impaired and Normal Hearing Individuals.” Noise & Health 14 (60):260–272. https://doi.org/10.4103/1463-1741.102966.
- Kates, J. 2013, June. “An Auditory Model for Intelligibility and Quality Predictions.” In Proceedings of Meetings on Acoustics ICA2013, Vol. 19, No. 1, 050184. Acoustical Society of America.
- Kates, J. M., and K. H. Arehart. 2014. “The Hearing-Aid Speech Perception Index (HASPI).” Speech Communication 65:75–93. https://doi.org/10.1016/j.specom.2014.06.002.
- Kates, J. M., and K. H. Arehart. 2021. “The Hearing-Aid Speech Perception Index (HASPI) Version 2.” Speech Communication 131:35–46. https://doi.org/10.1016/j.specom.2020.05.001.
- Kates, J. M., K. H. Arehart, M. C. Anderson, R. Kumar Muralimanohar, and L. O. Harvey. Jr 2018. “Using Objective Metrics to Measure Hearing Aid Performance.” Ear and Hearing 39 (6):1165–1175. https://doi.org/10.1097/AUD.0000000000000574.
- Kim, S., R. D. Frisina, F. M. Mapes, E. D. Hickman, and D. R. Frisina. 2006. “Effect of Age on Binaural Speech Intelligibility in Normal Hearing Adults.” Speech Communication 48 (6):591–597. https://doi.org/10.1016/j.specom.2005.09.004.
- Kochkin, S. 2000. “MarkeTrak V: Why My Hearing Aids are in the Drawer” The Consumers’ Perspective.” The Hearing Journal 53 (2):34–36. https://doi.org/10.1097/00025572-200002000-00004.
- Lai, Y. H., and W. Z. Zheng. 2019. “Multi-Objective Learning Based Speech Enhancement Method to Increase Speech Quality and Intelligibility for Hearing Aid Device Users.” Biomedical Signal Processing and Control 48:35–45. https://doi.org/10.1016/j.bspc.2018.09.010.
- Leek, M. R., and V. Summers. 1996. “Reduced Frequency Selectivity and the Preservation of Spectral Contrast in Noise.” The Journal of the Acoustical Society of America 100 (3):1796–1806. https://doi.org/10.1121/1.415999.
- Lorenzi, C., G. Gilbert, H. Carn, S. Garnier, and B. C. Moore. 2006. “Speech Perception Problems of the Hearing Impaired Reflect Inability to Use Temporal Fine Structure.” Proceedings of the National Academy of Sciences of the United States of America 103 (49):18866–18869. https://doi.org/10.1073/pnas.0607364103.
- Magnusson, L., A. Claesson, M. Persson, and T. Tengstrand. 2013. “Speech Recognition in Noise Using Bilateral Open-Fit Hearing Aids: The Limited Benefit of Directional Microphones and Noise Reduction.” International Journal of Audiology 52 (1):29–36. https://doi.org/10.3109/14992027.2012.707335.
- Maidment, D. W., A. B. Barker, J. Xia, and M. A. Ferguson. 2018. “A Systematic Review and Meta-Analysis Assessing the Effectiveness of Alternative Listening Devices to Conventional Hearing Aids in Adults with Hearing Loss.” International Journal of Audiology 57 (10):721–729. https://doi.org/10.1080/14992027.2018.1493546.
- Moore, B. C. 1996. “Perceptual Consequences of Cochlear Hearing Loss and Their Implications for the Design of Hearing Aids.” Ear and Hearing 17 (2):133–161. https://doi.org/10.1097/00003446-199604000-00007.
- Moore, B. C. 2007. Cochlear Hearing Loss: Physiological, Psychological and Technical Issues. John Wiley & Sons. University of Cambridge, England.
- Oxenham, A. J., and S. P. Bacon. 2003. “Cochlear Compression: Perceptual Measures and Implications for Normal and Impaired Hearing.” Ear and Hearing 24 (5):352–366. https://doi.org/10.1097/01.AUD.0000090470.73934.78.
- Picou, E. M. 2020. “MarkeTrak 10 (MT10) Survey Results Demonstrate High Satisfaction with and Benefits from Hearing Aids.” Seminars in Hearing 41 (1):21–36. https://doi.org/10.1055/s-0040-1701243.
- Plyler, P. N., B. Tardy, and M. Hedrick. 2019. “The Effects of Nonlinear Frequency Compression and Digital Noise Reduction on Word Recognition and Satisfaction Ratings in Noise in Adult Hearing Aid Users.” Journal of the American Academy of Audiology 30 (02):103–114. https://doi.org/10.3766/jaaa.17068.
- Puschmann, S., M. Daeglau, M. Stropahl, B. Mirkovic, S. Rosemann, C. M. Thiel, and S. Debener. 2019. “Hearing-Impaired Listeners Show Increased Audiovisual Benefit When Listening to Speech in Noise.” NeuroImage 196:261–268. https://doi.org/10.1016/j.neuroimage.2019.04.017.
- Rasetshwane, D. M., D. A. Raybine, J. G. Kopun, M. P. Gorga, and S. T. Neely. 2019. “Influence of Instantaneous Compression on Recognition of Speech in Noise with Temporal Dips.” Journal of the American Academy of Audiology 30 (1):16–30. https://doi.org/10.3766/jaaa.16165.
- Ricketts, T. 2000. “Impact of Noise Source Configuration on Directional Hearing Aid Benefit and Performance.” Ear and Hearing 21 (3):194–205. https://doi.org/10.1097/00003446-200006000-00002.
- Ricketts, T. A., R. Bentler, and H. G. Mueller. 2017. Essentials of Modern Hearing Aids: Selection, Fitting, and Verification. San Diego, California: Plural Publishing.
- Ricketts, T. A., and B. W. Hornsby. 2003. “Distance and Reverberation Effects on Directional Benefit.” Ear & Hearing 24 (6):472–484. https://doi.org/10.1097/01.AUD.0000100202.00312.02.
- Ricketts, T. A., and E. M. Picou. 2013. “Speech Recognition for Bilaterally Asymmetric and Symmetric Hearing Aid Microphone Modes in Simulated Classroom Environments.” Ear & Hearing 34 (5):601–609. https://doi.org/10.1097/AUD.0b013e3182886d1e.
- Rodemerk, K. S., and J. A. Galster. 2015. “The Benefit of Remote Microphones Using Four Wireless Protocols.” Journal of the American Academy of Audiology 26 (8):724–731. https://doi.org/10.3766/jaaa.15008.
- Ruggero, M. A., N. C. Rich, and A. Recio. 1996. “The Effect of Intense Acoustic Stimulation on Basilar-Membrane Vibrations.” Auditory Neuroscience 2 (4):329–345.
- Salehi, H., V. Parsa, and P. Folkeard. 2018. “Electroacoustic Assessment of Wireless Remote Microphone Systems.” Audiology Research 8 (1):204. https://doi.org/10.4081/audiores.2018.204.
- Schafer, E. C., B. Kirby, and S. Miller. 2020. “Remote Microphone Technology for Children with Hearing Loss or Auditory Processing Issues.” Seminars in Hearing 41 (4):277–290. https://doi.org/10.1055/s-0040-1718713.
- Smeds, K., F. Wolters, and M. Rung. 2015. “Estimation of Signal-to-Noise Ratios in Realistic Sound Scenarios.” Journal of the American Academy of Audiology 26 (2):183–196. https://doi.org/10.3766/jaaa.26.2.7.
- Thibodeau, L. 2014. “Comparison of Speech Recognition with Adaptive Digital and FM Remote Microphone Hearing Assistance Technology by Listeners Who Use Hearing Aids.” American Journal of Audiology 23 (2):201–210. https://doi.org/10.1044/2014_AJA-13-0065.
- Thibodeau, L. M. 2020. “Benefits in Speech Recognition in Noise with Remote Wireless Microphones in Group Settings.” Journal of the American Academy of Audiology 31 (6):404–411. https://doi.org/10.3766/jaaa.19060.
- Van Kuyk, S., W. B. Kleijn, and R. C. Hendriks. 2018. “An Evaluation of Intrusive Instrumental Intelligibility Metrics.” IEEE/ACM Transactions on Audio, Speech, and Language Processing 26 (11):2153–2166. https://doi.org/10.1109/TASLP.2018.2856374.
- Woods, W. S., S. Kalluri, S. Pentony, and N. Nooraei. 2013. “Predicting the Effect of Hearing Loss and Audibility on Amplified Speech Reception in a Multi-Talker Listening Scenario.” The Journal of the Acoustical Society of America 133 (6):4268–4278. https://doi.org/10.1121/1.4803859.
- Wu, Y.-H., E. Stangl, O. Chipara, S. S. Hasan, A. Welhaven, and J. Oleson. 2018. “Characteristics of Real-World Signal to Noise Ratios and Speech Listening Situations of Older Adults With Mild to Moderate Hearing Loss.” Ear and Hearing 39 (2):293–304. https://doi.org/10.1097/AUD.0000000000000486.
- Zanin, J., and G. Rance. 2016. “Functional Hearing in the Classroom: Assistive Listening Devices for Students with Hearing Impairment in a Mainstream School Setting.” International Journal of Audiology 55 (12):723–729. https://doi.org/10.1080/14992027.2016.1225991.