
Abstract
Objective
Explore the impact of Ida’s “My Hearing Explained” (MHE) tool on audiologists’ language and patients’ understanding/interpretation of hearing test results.
Design
Audiologists were video-recorded in two sequential conditions: 1) giving standard audiogram explanations to 13 patients and, 2) following discretionary self-training, giving explanations using the MHE tool (nine patients). Outcomes of interest were audiologists’ language complexity, use of jargon, and audiologist-patient interactivity. Semi-structured patient interviews, conducted 1-7 days after appointments, were analysed using inductive qualitative content analysis. Patient recall was verified.
Study Sample
Four audiologists from one United Kingdom audiology service, and 22 patients (mean age 63.5 yrs) participated.
Results
In comparison to standard audiogram explanations, audiologists’ language was simpler and audiologist-patient interactivity greater with the MHE tool. Interview data analysis revealed differences between explanation types within the themes of “Understanding” and “Interpretation.” 54% (standard audiogram) and 22% (MHE tool) of patients expressed a desire for takeaway information. 31% (standard audiogram) and 67% (MHE tool) of patients reported their explanation helped them relay their results to others. Four patients (one receiving the MHE tool) incorrectly recalled information, suggesting inadequate understanding in these cases.
Conclusions
The MHE tool has potential for improving the accessibility and comprehensibility of hearing test results.
Introduction
The audiogram is a graphical representation of pure-tone hearing thresholds. Whilst it offers an efficient means of visualising a patient’s hearing status, its utility for conveying test results to non-audiologists is potentially problematic (Klyn et al., Citation2021; Ramachandran et al., Citation2011) due to its logarithmic axis scales, reverse y-axis, and the array of symbols used. Even when “translated” by the audiologist, the information contained within an audiogram may be too complex to relay clearly, presenting a barrier to comprehension and potentially affecting hearing aid uptake (Klyn et al., Citation2020; Sciacca et al., Citation2017).
At its most complex, audiologists’ language during audiogram explanations has been found to be at a 9th-grade (United States, US) reading level (14-15 year olds) and contain 16 different jargon terms, although notable variation between audiologists has been observed (Sciacca et al., Citation2017). This would not be a concern if a patient’s health literacy level was aligned with that of the audiologist’s oral communication; however, the contrary has been suggested for hearing aid orientation appointments (Nair & Cienkowski, Citation2010). Moreover, 19.4% and 23.2% of the United Kingdom (UK) population has difficulty understanding health information and engaging with healthcare providers, respectively (Simpson et al., Citation2020). This situation is not limited to the UK (Australian Bureau of Statistics, Citation2018; Bo et al., Citation2014).
Two-way discourse between the audiologist and patient during audiogram explanation, which could help mitigate health literacy difficulties, has been found lacking in audiology assessment appointments (Grenness et al., Citation2015; Watermeyer et al., Citation2015). This has been attributed to audiologists’ speed of oral delivery, confusing language, lack of open-ended questions, and ignorance of patients’ attempts at interaction (Sciacca et al., Citation2017; Watermeyer et al., Citation2015). Consequently, standard audiogram explanations might not represent patient-centred care within the dimensions of “clinician-patient communication,” “patient involvement in care,” and “patient empowerment” (as described by Scholl et al., Citation2014) in that: positive behaviours to facilitate patient-centred communication are not displayed; patients are not being actively encouraged to contribute to their appointment; and opportunities for patient learning (which would enable patients to take ownership of their deafness/hearing loss) are being missed.
The limitations of using the audiogram to convey hearing test results to patients, as well as the manner of delivery, have prompted calls for the development of tools that improve patients’ understanding of their hearing, and promote person-centredFootnote1 care (Klyn et al., Citation2019; Parmar et al., Citation2022). Examples include the “Hearing Number” (effectively a four-frequency pure-tone average) (Johns Hopkins Cochlear Center for Hearing and Public Health, Citation2023), and the Ida Institute’s “My Hearing Explained” (MHE) tool (Ida Institute, Citation2019). The Hearing Number is part of a US public health campaign and aims to simplify audiometric information and encourage people to take ownership of their hearing health; its effectiveness has not yet been examined. Whereas the Hearing Number can be determined via a hearing testing app and guide the individual to make initial help-seeking decisions, the MHE tool is a single-page conversation guide and handout designed to be completed by the audiologist and patient together once the person has already taken steps to obtain a professional opinion of their hearing. Both can be retained by the patient for future reference, or for relaying their assessment information to others (Ida Institute, Citation2019; Johns Hopkins Cochlear Center for Hearing and Public Health, Citation2023). To date, there has been just one peer-reviewed publication on the MHE tool (Nell et al., Citation2022). Nell et al. (Citation2022) explored the value of the MHE tool (qualitatively) through a single open-ended question (appended to a larger questionnaire) and patient/audiologist focus groups, and (quantitatively) with a modified version of the Patient Satisfaction Questionnaire. They found no differences in satisfaction with care between the 27 patients who received standard care, and the 24 who received the MHE tool.
The present study adds to the work of Nell et al. (Citation2022) by investigating the impact of the MHE tool on the audiologists’ use of language (general complexity and use of medical jargon), and audiologist-patient interactivity, as well as patients’ understanding, interpretation and recall of hearing test results. These particular concepts were chosen as the foci of this study because, 1) language can be objectively assessed, and 2) easy-to-understand explanations will help patients make informed decisions about the appropriateness of a hearing intervention.
Objectives and study design
This exploratory study had two objectives:
To compare the language used by audiologists when explaining hearing loss and its consequences using (a) the standard audiogram, and (b) the MHE tool.
To compare patients’ understanding and interpretation of the information provided by audiologists when explaining hearing loss and its consequences using (a) the standard audiogram, and (b) the MHE tool.
These objectives were achieved using the study design shown in .
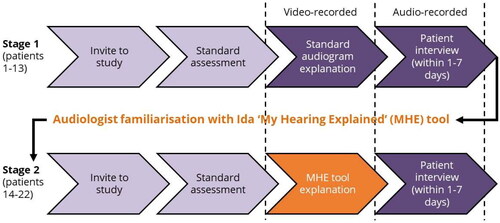
Figure 1. Outline of data collection procedure.
Materials and methods
Participants
Audiologists
Four audiologists (three female sex, one male; mean age 41 yrs, range 29-56 yrs; mean post-qualification experience 14 years, range 7-19 yrs) consented to participate in the study. All were employed by the National Health Service, worked within an audiology department in the northwest of England, and regularly performed adult initial hearing assessment appointments.
Patients
Twenty-two patients participated (12 female sex, 10 male; mean age 63.5 yrs, range 46-79 yrs; mean age left full-time education 18 yrs, range 15-24 yrs). Suitable patients were identified from clinic rosters by the clinical team, who then provided the patients with study information and an invitation to participate. Inclusion criteria were:
Aged ≥45 and ≤80 yrs;
Referred for first audiological assessment;
Language interpreter not required;
No indications of a cognitive condition, such as dementia;
Able to complete audiometric evaluation with standard level of instruction and support.
Written consent was obtained immediately prior to the patient’s clinical appointment. Twenty-three patients agreed to participate but one was later excluded because the audiologist judged a language interpreter was required.
Although all patients were referred for a first audiological assessment, it was discovered during their appointment that four had previously undergone a hearing test with another hearing care provider. Furthermore, one of these individuals said they had been issued a hearing aid 12 years earlier that they had never worn. The data relating to these patients (who all received standard care audiogram explanations) have been included because the patients claimed to have no recollection of their prior hearing test results. However, see Supplemental material 1 for analyses completed with these patients’ data removed. All conflicting findings between the full and reduced datasets are indicated in the Results section below.
Data collection procedure and materials
This study comprised two stages (see ). During Stage 1, audiologists explained hearing test results to 13 patients using a standard audiogram. During Stage 2, audiologists explained hearing test results to nine patients using a paper copy of the MHE tool. The MHE tool is readily available online (Ida Institute, Citation2019, and Supplemental material 2) along with a variety of optional training resources. It has a stylised image of a smiling face at the top of the page, and in the lower left-hand section of the guide are five “low-medium-high” rating scales for: “…ability to hear sound…” (right and left ears); “…understand speech…” (right and left ears); and “…energy for listening….” In the lower right-hand section of the guide, there is designated space to: document listening difficulties and abilities; rank personally important situations; and outline appropriate management options. The audiologists were unfamiliar with the MHE tool and had not used it clinically prior to participating in this study. After completion of Stage 1, the audiologists were encouraged to use the online training resources (written documents, video tutorials, and downloadable materials) and to practise using the tool in their clinics to familiarise themselves with it. They were given a 6–7-week window to prepare for the second stage of data collection. As noted in the Limitations section, although encouraged, accessing the training materials or practising with the tool was effectively optional.
During MHE tool explanations, the patient’s audiogram was not obscured from the patient’s view, nor were the audiologists prohibited from using the audiogram in parallel with the MHE tool. In practice, this occurred once; as the defining feature of explanation type was whether the MHE tool was used, this case was treated as an MHE tool explanation, and the data are presented as such.
Stages 1 and 2 involved:
Video-recording explanations following the hearing test. Video-recordings allowed gestures and the use of visual aids to be captured. A member of the research team operated the recording equipment (an AppleTM iPad (Apple Inc., Cupertino, CA) on a tripod). Initiation of recording was directed by the audiologist. Recording was stopped either at the instruction of the audiologist, or if no instruction was given, when the research team member considered the appointment had moved on to other content.
Interviewing patients within one-to-seven days of their hearing test (mean follow-up time for standard audiogram explanation 2.8 days, MHE tool 2.6 days). This timeframe meant patients could not rely on immediate recall and had at least 24 hours to digest the information they had received, whilst also providing scheduling flexibility. The semi-structured interviews (see Supplemental material 3 for the interview schedule) were conducted by a member of the research team in face-to-face, telephone or video-call format depending on the patient’s preference. Patients were asked to recall what they had been told about their hearing, what advice they had been given and what they thought about how it was delivered, what they did with this information and how it influenced decisions they made about their treatment, and what was clear/unclear/interesting/surprising to them.
The interviews were audio-recorded using the same equipment as for video-recordings.
All video- and audio-recordings were transcribed by a professional transcription service.
Analysis
Audiologists’ language
General language complexity
The transcripts of the audiologists’ speech were processed through Microsoft’s “Readability Statistics” tool (Microsoft Corps., Redmond, WA) to obtain: number of sentences; average number of words per sentence; percentage of passive sentences; Flesch Reading Ease score (Flesch, Citation1948); and Flesch-Kincaid Reading Grade level (Kincaid et al., Citation1975). Although the latter four measures are typically used to analyse written text, here they were used to analyse the complexity of the audiologists’ oral communication. This approach forms a key element of a validated framework for defining oral literacy demand (Nouri and Rudd, Citation2015; Roter, Citation2011; Roter et al., Citation2007) and has been adopted by others (e.g., Gemmiti et al., Citation2022; McCarthy et al., Citation2012; Nair & Cienkowski, Citation2010; Roter et al., Citation2009; Sciacca et al., Citation2017). Although the Flesch and Flesch-Kincaid measures are American in origin and have not been validated for a UK population, they are derived from calculations involving average word lengths (in syllables) per 100 words, and average sentence length in words; these variables are presumed to be similar for American and British English. Furthermore, the measures were used comparatively to explore differences between clinical approaches, rather than to make inferences based on the absolute scores. Data were summarised for standard audiogram and MHE tool explanations using descriptive statistics.
Use of medical jargon
Jargon terms used by the audiologists were extracted from the transcripts as follows. The transcripts were imported into R (R Core Team 2021, version 4.0.5, Vienna, Austria) and transformed using the “tm” package to remove numbers, punctuation and common English stopwords (e.g., “I,” “we,” “is”). A list of the remaining words underwent manual data-cleansing to combine singular and plural forms of words, identify frequently used compound nouns (e.g. “hearing aid,” “noise exposure,” “fitting range,” “ear canal”), and rectify post-transformation errors (e.g. by removing incomplete contractions such as “’ve”). Conceptually-related terms (e.g. low-, mid-, high-frequencies) were also grouped. The resultant “term list” was screened for the jargon terms published by Sciacca et al. (Citation2017, Appendix). Authors ML and HW then independently identified other terms they considered were technical/specialist health-related terms and which were unlikely to be understood by a patient attending an audiology clinic without clarification. The authors resolved discrepancies through discussion and consensus.
The frequency of jargon terms in each video-recording transcript, and the number and percentage that were not clarified by the audiologist, were calculated and then summarised for standard audiogram and MHE tool explanations using descriptive statistics. Jargon terms were deemed to have been clarified if the audiologist either provided a definition of the term, or physically demonstrated its meaning (e.g. showed an ear mould when referring to a “mould”). Jargon terms initiated by the patient were disregarded. Clarification was not determined based on patient understanding of the jargon, as the focus of this analysis was the audiologists’ language (i.e., in order to meet the first study objective).
Audiologist-patient interactivity
A rate of speaker change per minute was calculated by dividing the duration of each video-recording session by the number of speaker changes within the session. Single-word utterances (e.g. “yeah” or “okay”), repetitions of the previous speaker’s words, and simple affirmations were not counted as speaker turns. The number of open- and closed-ended questions posed by the audiologist within each transcript was counted as a measure of interactive behaviour (i.e., rather than of interactivity itself). A patient-to-audiologist ratio of oral communication was derived from the number of sentences and words spoken by patients and audiologists within each transcript. All measures were compared across standard audiogram and MHE tool explanations using descriptive statistics.
Understanding and interpretation
Inductive qualitative content analysis (Knudsen et al., Citation2012) was applied to the interview transcripts in order to extract information about the patients’ understanding, interpretation and recall of the hearing test explanations. An iterative, staged approach was followed. Authors GHS and HW, and a research audiologist, initially familiarised themselves with the entire set of transcripts. The transcripts were then re-read, and initial codes generated by GHS and the research audiologist. The codes were then reviewed and refined by HW. Inconsistences between authors were resolved through discussion and consensus. For instance, in the initial pass, “Looking forward to getting hearing aids” was included as a code. However, on review it was agreed that this was something implied rather than directly evidenced in the transcripts and it was thus removed. Codes were then grouped into themes and sub-themes. Code frequencies and proportions were calculated to allow comparisons to be drawn between standard audiogram and MHE tool explanations. Information recalled by the patient about their hearing was referenced back to the information provided by the audiologist during the video-recording.
Results
Each audiologist was video-recorded giving standard audiogram explanations to three or four patients, and MHE tool explanations to between one and three patients. Patient demographic data are summarised by explanation type in Supplemental material 4. This study was exploratory by design, so no attempt was made to match the patients receiving each type of explanation. An imbalance in patient sex was observed (69% of patients who received a standard audiogram explanation were female, compared to 33% of patients who received an MHE tool explanation), being a reflection of more eligible (and willing) female patients being referred to the Audiology service during recruitment for Stage 1. However, there were no significant differences in terms of age (t = −1.57, p = 0.13), or age they left full-time education (W = 50.5, p = 0.61).
Audiologists’ language
General language complexity
presents summary data for the number of sentences spoken by audiologists in each appointment, and the measures of language complexity. For the Flesch Reading Ease score, a score of zero indicates minimum readability, and 100 indicates maximum readability. A score of 100 suggests that the text would be understandable to a child who has just completed (US) fourth grade (Flesch, Citation1948). For the Flesch-Kincaid Reading Grade level, a higher score implies greater textual complexity, requiring a higher educational level for understanding.
Table 1. General language complexity (and number of sentences) data averaged across each appointment from audiologist transcripts for standard audiogram (Standard) and MHE tool (MHE) explanations separately. M = mean; SD = standard deviation.
Overall, audiologists spoke more sentences, used fewer words per sentence, and used fewer passive sentences when relaying hearing test results using the MHE tool than with standard audiogram explanation, although no difference in percent of passive sentences was seen for the reduced dataset (see Supplemental material 1). The Flesch Reading Ease score was higher (more readable) and the Flesch-Kincaid Reading Grade level of the audiologist transcripts was lower (easier) when the MHE tool was used, although the reading ease category for both explanations was “fairly easy” (Flesch, Citation1948).
Use of medical jargon
Twelve of the 33 jargon terms as listed by Sciacca et al. (Citation2017) were used by the audiologists in this study, although due to our grouping of conceptually-related terms, they represent eight jargon terms in our list. An additional 47 terms were identified, giving a final jargon term list of 55 items (see Supplemental material 5).
presents summary data for the audiologists’ use of jargon for each explanation type. The number of different jargon terms used was similar for both, although the total number of times any jargon term was used within a session, and the number and percentage of unclarified jargon terms, was lower for MHE tool explanations. [The difference in number of unclarified jargon terms for the reduced dataset was negligible.] The most frequently used jargon terms for both explanation types were “low/mid/high pitch,” and “outer/middle/inner ear,” followed by “frequency/frequencies” and “ear mould/mould” for standard audiogram and MHE tool explanations, respectively. For the reduced dataset, the three most frequently used jargon terms were “low/mid/high pitch,” “frequency/frequencies,” and “pressure test/negative pressure.”
Table 2. Summary data of audiologists’ use of jargon during standard audiogram (Standard) or MHE tool (MHE) explanations. M = mean; SD = standard deviation.
Audiologist-patient interactivity
The mean recording duration was 6.9 min (SD 5.1, range 1.8-15.9 min) for standard audiogram explanations, and 10.9 min (SD 4.4, range 4.9-20.4 min) for MHE tool explanations. On average, 61% of patients’ oral communication during standard audiogram explanations was either a single-word utterance, repetition of the audiologist, or simple affirmation. This compares to 40% for sessions involving the MHE tool. Speaking turns per minute were 1.6 (SD 1.2) and 3.2 (SD 0.8) for the standard audiogram and MHE tool explanations, respectively.
displays the number of open- and closed-ended questions posed by the audiologists during each type of explanation. The mean number of questions (both types) asked by the audiologists was 2.9 (SD 2.4) for standard audiogram, and 12.9 (SD 6.7) for MHE tool, explanations. Note that the latter is inflated by one session during which the patient and audiologist were particularly interactive. Nevertheless, when data from this session are excluded, a trend for asking more questions during MHE tool explanations remains, with the ratio of open- to closed-ended questions being 1:2.1, versus 1:4.3 for standard audiogram explanations.
Figure 2. Audiologist-patient interactivity during all 22 video-recording sessions: a) number of open- and closed-ended questions posed by audiologists, separated by explanation type (standard audiogram – Standard, or MHE tool - MHE), b) patient-to-audiologist ratio of sentences and words spoken, for Standard and MHE explanations (bars display mean values, points display individual session data).
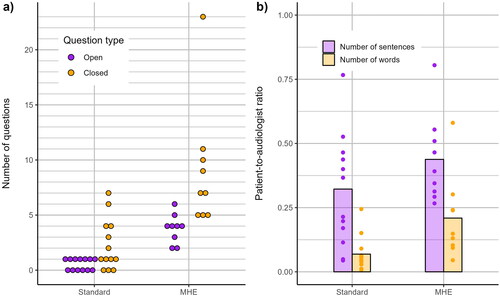
shows the ratio of patient-to-audiologist oral communication for number of sentences and words, by explanation type. A ratio of 0.50 would indicate that patients spoke half as much as the audiologists; a ratio of 1.00 would indicate that patients and audiologists spoke an equal number of sentences/words. The mean patient-to-audiologist ratios for standard audiogram explanations were 0.3 (SD 0.2) and 0.1 (SD 0.1) for sentences and words, respectively. The corresponding ratios for MHE tool explanations were 0.4 (SD 0.2) and 0.2 (SD 0.2).
Understanding and interpretation
shows the themes, sub-themes and codes from the content analysis of patient interviews, along with example quotes. The number of interviews in which each code arose and the percentage of patients this represents are displayed for each explanation type. There were many similarities, but it is notable that two codes associated with difficulties in interpretation (“Tired from hearing test, difficult to concentrate on explanation” and “Difficult to digest audiogram/overwhelmed”) were absent from interviews with patients who received an MHE tool explanation, and that two-thirds (six of nine) of these patients felt the MHE tool would be helpful for explaining their hearing to others; this compares to one-third (four of 13) of patients who received a standard audiogram explanation. Furthermore, patients who received the standard audiogram explanation (of whom five were given material to take home) more frequently expressed a desire for takeaway information.
Table 3. Content analysis of the patient semi-structured interviews. The number of interviews in which each code arose and the percentage of patients this represents is displayed per explanation type (standard audiogram – Standard, or MHE tool - MHE). *Quote from patient with previous hearing test experience.
When the four patients with prior hearing test experience are removed from the dataset, the codes “Validation most important part,” and “Tired from hearing tests, difficult to concentrate on explanation,” do not emerge. In other words, those patients who had received a hearing test in the past, were the ones who found validation important and testing tiring. The reader is directed to Supplemental material 1 for further details.
When comparing audiologist data from the video-recordings with the patient interview data, it was evident that across both explanation types, nearly 70% of patients could recall elements of what they had been told about their hearing (e.g., the degree of hearing loss, or if one ear was worse than the other). However, there were also occurrences of incorrect recall. Two patients who received standard audiogram explanations confused low- and high-frequencies, and one confused the degree of their hearing loss. One patient who had an MHE tool explanation incorrectly recalled which ear had worse hearing. [See Supplemental material 6 for further detail.] Incorrect recall could have consequences for uptake and adherence to treatment, or for receiving support from others.
Discussion
This study, conducted in a single UK audiology service, explored whether use of the Ida Institute’s MHE tool impacted the language used by audiologists when providing hearing test results, and patients’ understanding and interpretation of this information. A mixed-methods approach was employed, combining quantitative analysis of the audiologists’ language and qualitative content analysis of semi-structured patient interviews. The findings suggest that when the MHE tool was utilised, explanations took longer but audiologists used simpler language and less jargon, and audiologist-patient interactivity was greater. Furthermore, the interviews revealed patients were better able to interpret what they had been told and felt less need for takeaway information. Six in nine patients receiving an MHE tool explanation thought it would be helpful for explaining their hearing to others, as compared to four in 13 patients who received a standard audiogram explanation.
Audiologists’ language
General language complexity
On average, audiologists’ language was simpler when they used the MHE tool to explain hearing loss and its consequences, than when they gave a standard audiogram explanation, although the Flesch Reading Ease category was the same. Even with the MHE tool, the average Flesch-Kincaid Reading Grade level here (6.1) was higher than that reported in other studies of language use involving audiologists (Nair & Cienkowski, Citation2010, ∼3.6 mean grade level; Sciacca et al., Citation2017, 4.8). However, this finding may not be problematic for patients as (within the field of genetic counselling) it has been shown that for people with low literacy skills, learning is unaffected by Flesch-Kincaid Reading Grade level, and for those with adequate literacy skills, learning is improved by higher Flesch-Kincaid Reading Grade levels of speech (Roter et al., Citation2009).
Spoken language complexity was measured using tools designed for analysing written text, a method which has some limitations (i.e., it is not concerned with specific vocabulary or the more dynamic aspects of speech). Sciacca et al. (Citation2017) also assert that this approach likely underestimates oral literacy demand as the listener has less time to process information when it is delivered verbally than in written form. However, this is counteracted by the fact that verbal communication offers recipients the opportunity to react to (or question) the speaker and exploit visual cues.
Use of medical jargon
The audiologists used a similar number of different jargon terms during standard audiogram and MHE tool explanations, but the mean incidence of jargon, mean number of unclarified terms (for the full dataset), and percentage of unclarified terms, was less for MHE tool explanations; this is despite a longer average recording time. It seems plausible that the structure of the MHE tool encouraged the audiologists to use less technical language. That being said, reference to “pitch” was the most frequently used jargon for both standard audiogram and MHE tool explanations, suggesting that audiologists discussed hearing loss configuration regardless.
In comparison to the findings of Sciacca et al. (Citation2017), the audiologists here used jargon more often irrespective of the explanation type, which might be because we were overly inclusive in our identification of jargon terms (we identified 55 terms, whereas Sciacca et al. (Citation2017) identified 33). One example of this might be the inclusion of “low/mid/high pitch” as jargon, which caused some initial disagreement. In this case, the authors reached consensus on the grounds of their clinical experience of patients confusing pitch for loudness. This emphasises the usefulness of validating jargon terms via public consultation.
Akin to the findings of Watermeyer et al. (Citation2015), all audiologists in this study used unclarified jargon terms. However, proportionally, this occurred less often than in the Sciacca et al. (Citation2017) study. Moreover, because only the post-assessment explanations were video-recorded, it is possible that the percentage of unclarified terms was overestimated if the clarification took place earlier in the appointment. There is doubtless value in clarifying jargon terms within a hearing test explanation, although ideally, jargon would be avoided altogether since, even with clarification, the rate of jargon comprehension could still be <30% (Castro et al., Citation2007).
Audiologist-patient interactivity
During standard audiogram explanations, there was little interaction between the patient and audiologist, with most patients’ dialogue consisting of verbalisations that demonstrated active listening. On average, patients spoke one word for every 14 words spoken by the audiologist. This is consistent with other studies showing audiologists to be verbally dominant during audiological consultation and rehabilitation planning (Manchaiah et al., Citation2019; Watermeyer et al., Citation2012). Although not statistically tested, it is possible that a lack of audiologist questioning contributed to this finding. On average, the audiologists asked fewer than three questions per recording session and the mean ratio of open- to closed-ended questions posed by audiologists was 1:4. This is the same ratio reported by Grenness et al. (Citation2015), suggesting our findings are not atypical of audiological practice. Asking questions provides opportunities for patients to interact, and open-ended questions likely encourage patients to speak more.
There was an apparent change in audiologist-patient interactivity and facilitatory behaviours when audiologists used the MHE tool. On average, patients spoke four times as many words as those receiving standard audiogram explanations; audiologists asked patients more than four times as many questions; and, the ratio of open- to closed-ended questions, and the number of speaking turns per minute, doubled. Possible explanations for this are:
The structure and content of the MHE tool “facilitates more engagement” (Nell et al., Citation2022).
Video-recordings were longer. Grenness et al. (Citation2015) found that when the counselling phase of an initial hearing assessment appointment was longer, there was a better balance of information giving between the patient and audiologist.
General language complexity reduced when the MHE tool was utilised. Roter et al. (Citation2007) reported significant correlations between speaking turns per minute, and fewer words per sentence, smaller percentage of passive sentences, lower Flesch-Kincaid Reading Grade, and higher Flesch Reading Ease.
Interactivity in healthcare appointments is important for patients with low literacy, as it facilitates learning. This was demonstrated by Roter et al. (Citation2009) for genetic counselling sessions but it could also apply to audiology appointments. Moreover, maximising the use of open-ended questions will enable audiologists to confirm that the information they have provided has been accurately received; as highlighted by Castro et al. (Citation2007), this is something that cannot be presumed.
Understanding and interpretation
In keeping with the finding of Parmar et al. (Citation2022), a greater proportion of participants who received a standard audiogram explanation wanted information to take home, relative to those who received the MHE tool. This difference might be because those who received a standard audiogram explanation found the information they were given to be complex, tiring and overwhelming and thus needed more time to process what they had been told (see the first example quote in ).
Proportionally, more patients who received the MHE tool than the standard audiogram explanation stated that it had, or would, help them to explain their hearing test results to others. This is valuable as, “[c]ongruent perception of disability and rehabilitation needs between patients and their family members is important in functional coping” (Manchaiah et al., Citation2019). The concurrent provision of written/pictorial and verbal information with the MHE tool likely contributed to patient understanding and recall, and consequently, the ability to explain it to others (Houts et al., Citation1998).
At interview, about 30% of patients recalled no specific information about their hearing loss, and four made recall errors, despite the interviews taking place within a week of their assessment. Recall of medical information is correlated with, and (according to Ley’s cognitive model) directly influenced by, patient understanding (Ley, Citation1997). Thus, it is possible that many patients here did not understand the information they were given about their hearing well enough to recall any specific details. Alternatively, the patients might not have considered the details of their hearing test important, being more interested in the audiologist’s recommendations; they may have been experiencing emotional stress during the appointment, meaning their attention was restricted to the need for a hearing aid for example; or, the test results were not in keeping with their pre-existing beliefs about their hearing and were therefore forgotten (Kessels, Citation2003; Ley, Citation1997).
Clinical implications
This exploratory study provides evidence that the MHE tool might have some advantages over using the audiogram alone to explain hearing test results to first-time audiology patients, in that it results in the use of more accessible language and facilitates audiologist-patient interactions. However, consistent with the findings of Nell et al. (Citation2022), there was not universal acceptance of the MHE tool, with some patients finding it overly simplistic and lacking substance. We therefore suggest that hearing care professionals adapt their explanation of hearing loss and its consequences to the needs of each patient by simply asking each how much information they would like. Additionally, hearing care professionals should be more aware of the language they use and the extent to which they dominate interactions with patients so that remedial actions, such as asking more open-ended questions, or vocabulary matching (Williams & Ogden, Citation2004) can be taken. In this respect, self-reflection or peer-review would be valuable. Finally, patients should also be provided with take-home written materials to enable them to digest information from the appointment in their own time, and to share it with others more easily. Based on previous research (Klyn et al., Citation2020; Sciacca et al., Citation2017), it is possible that these efforts might increase hearing aid adoption and use.
Limitations
There are several limitations that must be acknowledged. First, the study took place with audiologists from a single clinical site and sample sizes were small and unbalanced, which limits the generalisability of the findings. The latter was the consequence of unexpected clinical capacity issues, the reluctance of some audiologists to be filmed, difficulties identifying suitable patients, and the COVID-19 pandemic. Second, four of the 13 patients who received standard audiogram explanations had previously had a hearing test, one of whom had also been issued with a hearing aid (albeit never worn). One might expect these patients to demonstrate better understanding of their hearing loss, but this was not reflected in the data. In fact, rates of recall were lower and the desire for takeaway written information was greater when these patients were included in the dataset. Further, one of the four patients incorrectly recalled their hearing test results. Third, the end point of video-recording was highly subjective, and was clearer for MHE tool explanations than for standard audiogram explanations; thus, we might not have compared like-for-like content. With hindsight, the entire appointment should have been recorded and the relevant sections extracted retrospectively. This would have had the additional advantage of allowing us to identify jargon terms that had been clarified earlier in the appointment, and to explore how other aspects of the appointment (e.g., prior conversations between the audiologist and patient) might have influenced the results. Finally, it was intended that an Ida representative would provide real-time virtual training for the audiologists, but due to circumstances beyond our control (a national day of mourning), this did not happen. Instead, MHE tool training was effectively at the discretion of the audiologists. However, should the MHE tool be implemented widely, it is likely that training will be self- or group-guided (i.e., with peer-support or feedback) rather than via a formal training session.
Summary and conclusions
This mixed-methods study explored the impact of the Ida Institute’s MHE tool on audiologists’ language and patients’ understanding and interpretation of their hearing test results. The findings suggest that relative to standard audiogram explanations, audiologists used simpler language and less jargon when using the MHE tool, and audiologist-patient interactivity was greater. From the patients’ perspective, there was also less demand for takeaway information, they considered the MHE tool helpful for explaining results to others, and they made fewer recall errors about their hearing loss. We therefore conclude that the MHE could be a valuable tool for improving the accessibility and comprehensibility of hearing test result explanations. However, data from larger samples of patients and audiologists are needed to test the significance of these observations.
Ethical approval
Ethical approval for this study was granted by the NHS Health Research Authority (East Midlands – Nottingham 1 Research Ethics Committee, 20/EM/0278).
Informed consent from participants
Informed written consent was obtained from audiologists and patients before their participation in this study.
Supplemental Material
Download PDF (511.4 KB)Supplemental Material
Download PDF (529.1 KB)Supplemental Material
Download PDF (496 KB)Supplemental Material
Download PDF (390.9 KB)Supplemental Material
Download PDF (85 KB)Supplemental Material
Download PDF (429.8 KB)Acknowledgements
The authors would like to thank Gemma Jones (Salford Audiology Service, Northern Care Alliance) and Dr Ann-Marie Dickinson for their collaboration and support in facilitating this study, and all the participating audiologists who braved being video-recorded to learn more about how to improve patient care. The authors also extend their thanks to Sarah Rudman (Research Audiologist, The University of Manchester) who performed the initial content analysis.
Disclosure statement
No potential conflict of interest was reported by the author(s)
Data availability statement
The data that support the findings of this study are available from the corresponding author, GHS, upon reasonable request.
Additional information
Funding
Notes
1 The term “patient-centred” was used earlier in the Introduction to be consistent with a cited article. The use of “person-centred” from here on reflects the importance of considering the individual beyond their “role” as a patient.
References
- Australian Bureau of Statistics 2018. National Health Survey: Health literacy. ABS. Retrieved 13/4/23 from https://www.abs.gov.au/statistics/health/health-conditions-and-risks/national-health-survey-health-literacy/latest-release
- Bo, A., K. Friis, R. H. Osborne, and H. T. Maindal. 2014. “National Indicators of Health Literacy: Ability to Understand Health Information and to Engage Actively with Healthcare Providers-A Population-Based Survey Among Danish Adults.” BMC Public health 14 (1):1095. https://doi.org/10.1186/1471-2458-14-1095.
- Castro, C. M., C. Wilson, F. Wang, and D. Schillinger. 2007. “Babel Babble: Physicians’ Use of Unclarified Medical Jargon With Patients.” American Journal of Health Behavior 31 (1):S85–S95. https://doi.org/10.5993/AJHB.31.s1.11.
- Flesch, R. 1948. “A New Readability Yardstick.” The Journal of Applied Psychology 32 (3):221–233. https://doi.org/10.1037/h0057532.
- Gemmiti, M., S. Hamed, J. Wildhaber, C. Pharisa, and P. L. Klumb. 2022. “Physicians’ Speech Complexity and Interrupting Behavior in Pediatric Consultations.” Health Communication 37 (6):748–759. https://doi.org/10.1080/10410236.2020.1868063.
- Grenness, C., L. Hickson, A. Laplante-Lévesque, C. Meyer, and B. Davidson. 2015. “The Nature of Communication throughout Diagnosis and Management Planning in Initial Audiologic Rehabilitation Consultations.” Journal of the American Academy of Audiology 26 (1):36–50. https://doi.org/10.3766/jaaa.26.1.5.
- Houts, P. S., R. Bachrach, J. T. Witmer, C. A. Tringali, J. A. Bucher, and R. A. Localio. 1998. “Using Pictographs to Enhance Recall of Spoken Medical Instructions.” Patient Education and Counseling 43 (3):231–242. https://doi.org/10.1016/S0738-3991(98)00065-2.
- Ida Institute. 2019. My Hearing Explained. Retrieved 18/4/2023 from https://idainstitute.com/tools/my_hearing_explained/
- Johns Hopkins Cochlear Center for Hearing and Public Health 2023. Hearing Number. Johns Hopkins Bloomberg School of Public Health. Retrieved 12/7/23 from https://hearingnumber.org/
- Kessels, R. P. C. 2003. “Patients’ Memory for Medical Information.” Journal of the Royal Society of Medicine 96 (5):219–222. https://doi.org/10.1177/014107680309600504.
- Kincaid, J. P., R. P. Fishburne Jr, R. L. Rogers, and B. S. Chissom. 1975. Derivation of new readability formulas (automated readability index, fog count and flesch reading ease formula) for navy enlisted personnel. https://stars.library.ucf.edu/istlibrary/56
- Klyn, N. A., C. Rutherford, N. Shrestha, B. L. Lambert, and S. Dhar. 2019. “Counseling With The Audiogram.” The Hearing Journal 72 (11):12–13. https://doi.org/10.1097/01.HJ.0000612568.43372.73.
- Klyn, N. A. M., C. Letendre, N. Shrestha, B. L. Lambert, and S. Dhar. 2021. “Interpretability of The Audiogram by Audiologists and Physician Non-Specialists.” International Journal of Audiology 60 (2):133–139. https://doi.org/10.1080/14992027.2020.1805129.
- Klyn, N. A. M., Z. M. Shaikh, and S. Dhar. 2020. “Health Literacy and Self-Reported Hearing Aid Use in the Health and Retirement Study.” Ear and Hearing 41 (2):386–394. https://doi.org/10.1097/AUD.0000000000000770.
- Knudsen, L. V., A. Laplante-Lévesque, L. Jones, J. E. Preminger, C. Nielsen, T. Lunner, L. Hickson, G. Naylor, and S. E. Kramer. 2012. “Conducting Qualitative Research in Audiology: A tutorial.” International Journal of Audiology 51 (2):83–92. https://doi.org/10.3109/14992027.2011.606283.
- Ley, P. 1997. Communicating With Patients: Improving Communication, Satisfaction And Compliance. Cheltenham: Stanley Thornes.
- Manchaiah, V., M. L. Bellon-Harn, A. L. Dockens, J. H. Azios, and W. E. Harn. 2019. “Communication Between Audiologist, Patient, and Patient’s Family Members During Initial Audiology Consultation and Rehabilitation Planning Sessions: A Descriptive Review.” Journal of the American Academy of Audiology 30 (9):810–819. https://doi.org/10.3766/jaaa.18032.
- McCarthy, D. M., K. A. Leone, D. H. Salzman, J. A. Vozenilek, and K. A. Cameron. 2012. “Language Use in the Informed Consent Discussion for Emergency Procedures.” Teaching and Learning in Medicine 24 (4):315–320. https://doi.org/10.1080/10401334.2012.715257.
- Nair, E. L., and K. M. Cienkowski. 2010. “The Impact of Health Literacy on Patient Understanding of Counseling and Education Materials.” International Journal of Audiology 49 (2):71–75. https://doi.org/10.3109/14992020903280161.
- Nell, L. A., F. Mahomed Asmail, K. C. De Sousa, M. A. Graham, and W. Swanepoel. 2022. “Satisfaction with Hearing Assessment Feedback Using The My Hearing Explained Tool: Client and Audiologist Perceptions.” International Journal of Audiology 62 (5):481–488. https://doi.org/10.1080/14992027.2022.2053595.
- Nouri, S. S., and R. E. Rudd. 2015. “Health Literacy in the “Oral Exchange”: An Important Element of Patient–Provider Communication.” Patient Education and Counseling 98 (5):565–571. https://doi.org/10.1016/j.pec.2014.12.002.
- Parmar, B. J., K. Mehta, D. A. Vickers, and J. K. Bizley. 2022. “Experienced Hearing Aid Users’ Perspectives of Assessment and Communication within Audiology: A Qualitative Study Using Digital Methods.” International Journal of Audiology 61 (11):956–964. https://doi.org/10.1080/14992027.2021.1998839.
- Ramachandran, V., J. D. Lewis, M. Mosstaghimi-Tehrani, B. A. Stach, and K. L. Yaremchuk. 2011. “Communication Outcomes in Audiologic Reporting.” Journal of the American Academy of Audiology 22 (4):231–241. https://doi.org/10.3766/jaaa.22.4.6.
- R Core Team. 2023. R: A Language and Environment for Statistical Computing. R Foundation for Statistical Computing, Vienna, Austria. https://www.Rproject.org.
- Roter, D. L. 2011. “Oral Literacy Demand of Health Care Communication: Challenges and Solutions.” Nursing Outlook 59 (2):79–84. https://doi.org/10.1016/j.outlook.2010.11.005.
- Roter, D. L., L. Erby, S. Larson, and L. Ellington. 2009. “Oral Literacy Demand of Prenatal Genetic Counseling Dialogue: Predictors of Learning.” Patient Education and Counseling 75 (3):392–397. https://doi.org/10.1016/j.pec.2009.01.005.
- Roter, D. L., L. H. Erby, S. Larson, and L. Ellington. 2007. “Assessing Oral Literacy Demand in Genetic Counseling Dialogue: Preliminary Test of A Conceptual Framework.” Social Science & Medicine (1982)65 (7):1442–1457. https://doi.org/10.1016/j.socscimed.2007.05.033.
- Scholl, I., J. M. Zill, M. Härter, and J. Dirmaier. 2014. “An Integrative Model of Patient-Centeredness - A Systematic Review and Concept Analysis.” PLOS one9 (9):e107828. https://doi.org/10.1371/journal.pone.0107828.
- Sciacca, A., C. Meyer, K. Ekberg, C. Barr, and L. Hickson. 2017. “Exploring Audiologists’ Language and Hearing Aid Uptake in Initial Rehabilitation Appointments.” American Journal of Audiology 26 (2):110–118. https://doi.org/10.1044/2017_AJA-16-0061.
- Simpson, R. M., E. Knowles, and A. O'Cathain. 2020. “Health Literacy Levels of British Adults: A Cross-Sectional Survey Using Two Domains of the Health Literacy Questionnaire (HLQ).” BMC Public health20 (1):1819. https://doi.org/10.1186/s12889-020-09727-w.
- Watermeyer, J., A. Kanji, and A. Cohen. 2012. “Caregiver Recall and Understanding of Paediatric Diagnostic Information and Assessment Feedback.” International Journal of Audiology 51 (12):864–869. https://doi.org/10.3109/14992027.2012.721014.
- Watermeyer, J., A. Kanji, and N. Mlambo. 2015. “Recall and Understanding of Feedback by Adult Patients Following Diagnostic Audiological Evaluation.” International Journal of Audiology 54 (10):758–763. https://doi.org/10.3109/14992027.2015.1051667.
- Williams, N., and J. Ogden. 2004. “The Impact of Matching the Patient’s Vocabulary: A Randomized Control Trial.” Family Practice 21 (6):630–635. https://doi.org/10.1093/fampra/cmh610.