
 ?Mathematical formulae have been encoded as MathML and are displayed in this HTML version using MathJax in order to improve their display. Uncheck the box to turn MathJax off. This feature requires Javascript. Click on a formula to zoom.
Abstract
Objective
The dynamic range (DR) available to the patient is a central parameter to determine speech intelligibility in quiet.
Design
In this retrospective study, the DR for the Vibrant Soundbridge implanted in individual patients was calculated using in situ thresholds of the patients and technical data of the implant system. The average DR across frequencies (0.5, 1, 2, 4 kHz) was correlated with the patients’ assigned word recognition score (WRS) in quiet.
Study sample
A data set of 66 cases (4 bilateral and 2 revised cases) from 60 implanted patients between 14.3–81.8 years were analysed.
Results
The relationship between DR and WRS was described by a sigmoidal growth function with R2=0.6371 and a maximum WRS (upper asymptote) of 93.5%. Word recognition scores in quiet improved with increasing DR. A significant shift in performance was detected from DR bin 2 (10–20 dB, median WRS 55%) to bin 3 (20–30 dB, median WRS 80%) and from DR bin 4 (30–40 dB, median WRS 82.5%) to bin 5 (40–50 dB, median WRS 90%).
Conclusion
A minimum DR of 20 dB can yield sufficient speech intelligibility in quiet in implanted patients, however, an optimum DR is suggested to be 40 dB.
Introduction
The input dynamic range (DR) of human hearing is the physiologically accessible loudness range of the patient. It is defined as the difference between the hearing threshold and the uncomfortable level (UCL) or loudness discomfort level (LDL) (Dillon and Storey Citation1998). The dynamic range of a normal hearing human ear comprises approximately 110–120 dB. In patients with a sensorineural hearing loss component, the dynamic range decreases with increasing hearing loss as soft tones become inaudible, but the perception of loud tones and the UCL remains nearly unchanged compared to normal hearing listeners.
The purpose of any hearing amplifier/system is the restoration of the communication ability. The aim of a hearing system is therefore to match the average ambient input level range of the speech spectrum to the individual residual dynamic range of the patient using dynamic range compression prescriptions rules to stimulate the inner ear. In general, these rules prescribes high amplification of soft levels and declining amplification towards loud levels.
Speech is a highly complex acoustic signal that can be decomposed into sine waves (periodic sounds) differing widely in frequency, amplitude and overall intensity. The dynamic range of human hearing must be large enough to match the level and spectral envelope of everyday speech so as to ensure optimal speech recognition. A minimum dynamic range for human speech is proposed to be in the range of 30 to 35 dB (French and Steinberg Citation1947), although some studies suggest DRs larger than 35 dB are needed for optimal speech understanding with (Zeng et al. Citation2002) or without assistive devices (Boothroyd, Erickson, and Medwetsky Citation1994; Studebaker et al. Citation1999).
The maximum output (MO) is an important factor when selecting a hearing system for hearing impaired patients. The level range that is conveyed to the patient is limited by the noise floor of the device or the hearing threshold of the patient at soft sounds and by the onset of output saturation or UCL at high levels (). The MO of a hearing system must be high enough to preserve the dynamics of the speech signal and minimise distortion. The MO of World Health Organisation (WHO) grade 4 hearing aids (WHO, Citation2008) intended for patients diagnosed with severe-to-profound hearing loss are higher than 140 dB SPL (WHO grade 4 hearing aid), and exceed the UCL of hearing impaired patients. Active middle ear implants (AMEIs) have the advantage that they circumvent the middle ear and need no reserve beyond UCL to compensate for conductive losses. However, middle ear implants and bone conduction implants have a limited MO (Snik, Noten, and Cremers Citation2004; Zwartenkot et al. Citation2012) that is generally below the UCL of implanted patients (with the exception of the Codacs implant [Grossöhmichen et al. Citation2015; Wardenga et al. Citation2020]).
Figure 1. Schematic overview of the hearing range of subjects with hearing loss compared to subjects with normal hearing and the maximum output (MO). The covered dynamic range reflects the part of the dynamic range accessible to the patient by using an implant. The dynamic range is determined as the difference between MO of the implant system and the hearing threshold of the patient.
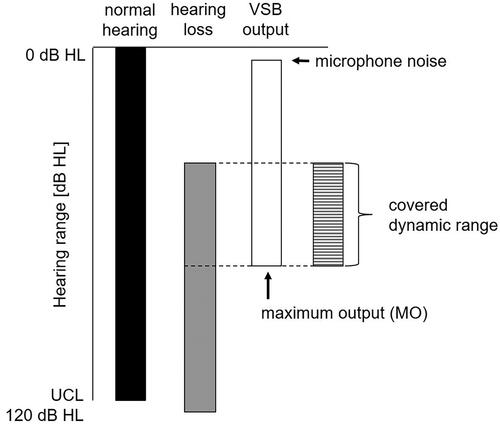
Thus, the covered dynamic range of a patient with a hearing implant is the range between the hearing threshold and the maximum output of the implant restricting the dynamic range available to the patient’s inner ear (). In other words, the covered dynamic range is determined by the subject-specific hearing threshold on the lower end of the hearing range and the implant-specific maximum output.
The active middle ear implant Vibrant Soundbridge (VSB) provides a variety of coupling options of the floating mass transducer (FMT) to treat patients with mild to moderate-severe hearing losses. The FMT can be attached to structures of the ossicular chain, to the oval window or the round window. The aim of the study was to determine the dynamic range available to patients implanted with the VSB using clinical data, to establish a relationship between the patients’ aided speech perception and their respective covered dynamic range, and to verify the minimum DR for sufficient benefit in terms of speech intelligibility in quiet.
Material and methods
Study subjects
For a retrospective analysis, all patients implanted with the Vibrant Soundbridge and the FMT positioned at the round window at the Medical School Hannover (Germany) between 2006 to 2020 were selected and analysed. Individual frequency-dependent maximum output of the Vibrant Soundbridge (see accompanying publication by Maier et al. Part 1) and the individual DR was determined for each patient based on the patients’ audiological data and device-specific technical specifications. Technical specifications (frequency-specific input voltage and device specific maximum voltage) of different VSB implants (VORP502, VORP503) and audio processor types (AP404, Amadé LoLo/Lo/St/Hi, Samba Lo/Hi) were provided by the manufacturer (MED-EL Medical Electronics, Austria) (Listed in Part 1 Maier et al. Citation2024).
All patient data were acquired during routine measurements and the analysis was performed in retrospective from patient files. Informed consent for anonymous use of data was obtained at the admission of patients. The data processing was done anonymously in accordance with the Regulation (EU) 2016/679 of 27 April 2016 on the protection of natural persons with regard to the processing of personal data, relevant guidelines and regulations and the internal regulations of the institution (MHH). According to German Data Protection and Professional Laws an ethics committee approval was not necessary for this study design.
Determination of the dynamic range
In general, the MO of most AMEI and the Vibrant Soundbridge are below the UCL of the patient. Thus, the covered DR of a hearing implant user depends on the subjects’ hearing threshold and the maximum output of the implant without distortion (). Our determination of the DR is based on the direct threshold (also known as in situ threshold or Vibrogram threshold (a generic name exclusively used for the Vibrant Soundbridge). Analogous to testing a hearing threshold, a frequency specific tone is presented via the actuator and increased until the tone is detected and confirmed by the implant user. The presentation level of the tone can be increased until the highest level – maximum input voltage of the device or maximum output – is reached. The DR for each patient is determined as follows:
In step one, the frequency-specific (f) input voltage at threshold is determined for each patient (i) by adding the (dB attenuator setting at the individual threshold) to the input voltage of the FMT actuator
at nominally 0 dB direct threshold:
(1)
(1)
In step two, the individual, frequency-specific dynamic range is determined by subtracting the frequency-specific input voltage at threshold from the frequency- and device-specific maximum voltage
:
(2)
(2)
Negative values determined for the DR in 11 frequencies of seven patients were set to zero. The mean dynamic range (DR as PTAN) was calculated for N = 4 frequencies (0.5, 1, 2, 4 kHz; PTA4) and N = 8 frequencies (0.5, 0.75, 1, 1.5, 2, 3, 4, 6 kHz; PTA8).
In step three, the absolute frequency-specific dynamic range was weighted with the band importance function of the speech intelligibility index (SII). The SII quantifies the proportion of audible speech cues weighted by a band importance function at each frequency band:
(3)
(3)
The Speech Intelligibility Index ranges between 0.0 and 1.0. A SII of 0.0 implies that none of the audible cues is available for the listener, while a SII of 1.0 implies that all the speech information is audible and usable for the listener. It is not a direct measure of speech intelligibility but highly correlated with speech intelligibility. Therefore, it is used to predict speech recognition scores based on test-specific transfer function (ANSI, S3.5, Citation1997). The SII band importance function I(f) was used for calculating of SII-weighted dynamic range (WDR) as mean value with different number of frequencies involved (PTAN) for N = 4 frequencies (0.5, 1, 2, 4 kHz; PTA4) and N = 5 frequencies (0.5, 1, 2, 4, 6 kHz; PTA5). For this purpose, two modifications were made. The band importance of 0.25 kHz had to be omitted because direct thresholds can only be determined for frequencies ≥ 0.5 kHz for the Samba processor or previous generations of processors. Further, the band importance function for 8 kHz was applied to 6 kHz instead. Finally, the I(f) was rescaled for the four- and five-frequency approach, respectively (), and multiplied with the frequency-specific dynamic range:
(4)
(4)
Table 1. Band importance function as reported in ANSI S3 5-1997/Table 4 and rescaled for four (4F) and five frequencies (5F), respectively. Please note that the band importance function for 8 kHz was applied to 6 kHz instead.
In step four, the linear correlation was determined between the subjects’ word recognition score (WRS, in %) determined with the German Freiburg monosyllable test in quiet at 65 dB SPL and corresponding DR and weighted DR, respectively.
In step five, the relationship between WRS and DR/WDR was determined for each dynamic range model using a nonlinear regression model. The sigmoidal Chapman equation (Zhao-Gang and Feng-Ri Citation2003) was applied by fitting three unknown parameters to the single patient data:
(5)
(5)
with a = upper asymptote or potential maximum of the WRS, b = parameter governing the rate at which the WRS approaches the potential maximum, and c = constant indicating the inflection point of the growth function.
Definition of dynamic ranges variables
For each patient four different DR variables were calculated. The absolute dynamic range was determined as a 4-frequency average (DRPTA4) across 0.5, 1, 2, 4 kHz (as required minimum data set for covering the main speech relevant frequencies) and an 8-frequency average (DRPTA8) across 0.5, 0.75, 1, 1.5, 2, 3, 4, 6 kHz (as a maximum available data set). The SII-weighted dynamic range was determined also as a 4-frequency average (WDRPTA4) across 0.5, 1, 2, 4 kHz and 5-frequency average (WDRPTA5) across 0.5, 1, 2, 4, 6 kHz (maximum available data set).
Statistics
The Jonckheere-Terpstra test, a non-parametric equivalent to the ANOVA with more than 2 independent samples, was performed to test for a linear trend in word recognition scores (WRS) across 10-dB dynamic range bins (bin 1: 0–10 dB; bin 2: >10–20 dB; bin 3: >20–30 dB; bin 4: >30–40 dB; bin 5: >40–50 dB; bin 6: >50–60 dB). A pairwise comparison of WRS for neighbouring DR bins was performed using the Mann-Whitney Rank Sum test (non-normal distribution), the Student’s t-test (normal distribution and equal variances) or the Welch’s test (normal distribution and unequal variances). The word recognition score (WRS) in quiet was correlated to both the absolute and weighted DR by fitting the sigmoidal Chapman function (non-linear regression model) with three unknown parameters. All statistical analyses and data visualisation were performed with SigmaPlot, Systat Software Inc. version 14 or IBM SPSS Statistics version 28.0.
Results
Patients
In accordance with (Maier et al. Part 1: MO), the same data set was used to determine the dynamic range for VSB implanted patients. However, only 66 cases (68 for MO) could be used for the analysis since two patients were excluded because of unreliable speech test scores. One patient was a non-native speaker, and another patient suffered from severe tinnitus and anxiety. The data set of the remaining 66 cases was derived from 60 patients (4 bilateral, 2 revised), 32 women and 28 men, with a mean age at the time of measurement of 60.9 ± 15.9 years (range 14.3–81.8 years). All patients were implanted with the Vibrant Soundbridge (Med-El) with the floating mass transducer coupled to the round window (round window vibroplasty) due to mixed hearing loss (MHL; 53 cases) or conductive hearing loss (CHL; 13 cases). The mean bone conduction (BC) hearing thresholds was 38.0 ± 13.4 dB HL (BC PTA4 ± standard deviation) and air conduction (AC) hearing thresholds was >84.4 ± 16.2 dB HL (AC PTA4). Measurements included in the study ranged from first fit appointments to annual check-up appointments up to year 10. The aim was to obtain complete data sets from the one-year appointment for all patients. However, the option to measure direct thresholds was not implemented in older processor types and therefore not available at all follow-up appointments. Additionally, some patients were lost to follow-up shortly after the implantation. In those cases, older or more recent datasets were included in the study and used for the analysis.
The obtained data set covered the entire range of the WRS from 0-100% and a mean dynamic range (DRPTA4) from 1.8 dB to 63.0 dB (). The Jonckheere-Terpstra test showed a significant trend of ascending median WRS with increasing DR for DRPTA4 (J = 1214.5, p < 0.001, z = 4.964), DRPTA8 (J = 1203.0, p < 0.001, z = 5.1893), WDRPTA4 (J = 1210.0, p < 0.001, z = 4.4738) and WDRPTA5 (J = 1210.5, p < 0.001, z = 4.6413). The descriptive statistic of the patients WRS across DR bins is presented in . The pairwise comparison of adjacent groups (DRPTA4) demonstrates a significant increase in the median WRS from 55.0% in bin two (DR > 10-20 dB) to 80.0% in bin three (DR > 20-30 dB, p = 0.011) and from 82.5% in bin four (DR > 30-40 dB) to 90.0% in bin five (DR > 40-50 dB, p = 0.038) (, ). Similar significant results were found for the other DR variables with two exceptions (). An additional significant increase in WRS was found between bin five (DR > 40-50 dB) and six (DR > 50-60 dB, p = 0.038) for the variable WDRPTA4. For the WDRPTA5, no significant change was found between bin four and five (p = 0.163).
Figure 2. Scatterplot of word recognition scores (WRS, empty circles) as a function of dynamic range (A DR PTA4; B DR PTA8) and weighted dynamic range (C WDR PTA4; D WDR PTA5). The boxplot for each 10-dB dynamic range group shows the median (solid line), the 25th and 75th percentiles (box) and the 10th and 90th percentile (whiskers) the mean value (dashed line) and outliers (black circles). Significant differences between adjacent 10-dB dynamic range groups are marked by an asterisks (*p < 0.05; ** p < 0.01). The sigmoidal function was fitted based on the single data points using the Chapman equation with three parameters.
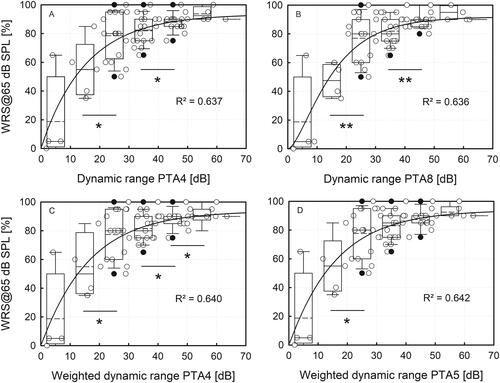
Table 2. Descriptive statistics of word recognition score (WRS) for each 10-dB dynamic range group 1 to 7 presenting the mean values, standard deviation (SD), the median and the 25th and 75th percentile and the sample size of each group for all four dynamic range variables.
Table 3. Statistic results of the pairwise testing of word recognition scores (WRS) of neighbouring dynamic range groups 1 to 6 only for all dynamic range variables (DRPTA4, DRPTA8, WDRPTA4, WDRPTA5). Group 7 was not included in the pairwise testing because the sample size was too small.
Comparison of DR variables
The comparison of the different dynamic range variables across all 66 cases revealed only minor differences between variables (, ). The median DRPTA4 differed by 0.9 dB (range −5.8 to 6.6 dB) from the DRPTA8, by 1.2 dB (range −1.1 to 3.2 dB) from the WDRPTA4 and by 0.3 dB (range −2.8 to 2.7 dB) from the WDRPTA5. The mean difference between WDRPTA4 and WDRPTA5 was −0.8 dB (range −2.6 to 1.0 dB).
Figure 3. Comparison of different measures characterising the DR, weighting the importance of different sets of frequencies equally or according to their importance for speech cues (SII): (A) DR PTA4 vs. DR PTA8); (B) DR PTA4 vs. WDR PTA4; (C) DR PTA4 vs. WDR PTA5; (D) WDR PTA4 vs. WDR PTA5.
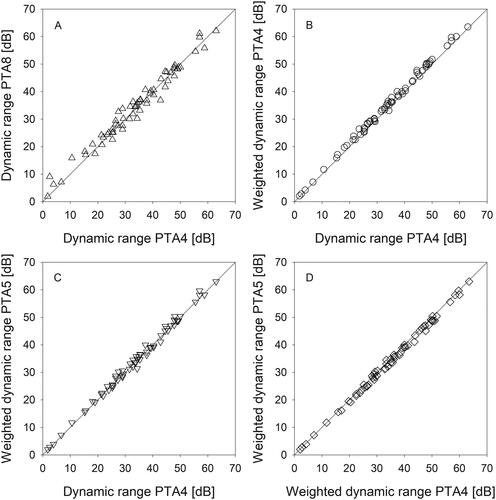
Table 4. Comparison of different dynamic range approaches used for determining the relationship between the dynamic range of an implanted patient and their ability for word recognition (n = 66).
The non-linear regression based on the sigmoidal Chapman function was determined between WRS and DR variables as an approximation of the intelligibility function. The amount of variance explained by the models (R2 = 0.637 [DRPTA4], R2 = 0.636 [DRPTA8], R2 = 0.640 [WDRPTA4], R2 = 0.642 [WDRPTA5]) and the upper asymptote/maximum WRS (ranging from 91.8% to 93.9%) did not differ much for the different DR variables ().
Table 5. Results of the nonlinear regression model with dynamic fitting based on the sigmoidal Chapman function with unknown parameters a, b and c and the overall model fit.
Discussion
The individual covered DR of patients implanted with an active middle ear implant could be successfully determined from patients’ clinical data only. The calculation of DRs requires only the direct thresholds which are commonly acquired during clinical routine, and device-specific technical data of VSB implants and processor types which were provided by the manufacturer. This simple technique requires no explicit knowledge about the maximum output of the device and the hearing threshold (air conduction and bone conduction thresholds) of the patient. Furthermore, differences in processor and implant configurations on the DR could be avoided by using technical data specific for the individual combination. In contrast to the MO, determination of the DR requires only the electrical actuator input at threshold (Vibrogram/direct threshold) determined via the implant system.
Another method to determine the DR is by measuring the input/output behaviour of AMEI using real ear measurements in the occluded ear canal of implanted patients with a probe-tube microphone (Snik, Noten, and Cremers Citation2004). Using this approach the DR is determined as the difference between input level at saturation and aided threshold. Albeit this method leads to device- and patient-specific dynamic range estimates, it is rather costly in terms of effort and time since it comprises many measurements and patient participation. Moreover, it is only feasible in patients that have a reverse sound transmission to the tympanic membrane that allows the recording of a response with sufficiently good signal-to-noise ratio, which is often not possible in patients with a dysfunctional or absent ossicular chain. Thus, results are obtained for a limited number of patients and frequencies only (Snik, Noten, and Cremers Citation2004; Zwartenkot et al. Citation2012). In comparison, our technique is independent of the fitting rule and requires no knowledge of the specific gain applied. Furthermore, by assuming the specifications of hypothetical processors the impact of a processor exchange on covered DR can be predicted.
To restore audibility, several prescription procedures are available that differ in prescribed gain and output for hearing impaired listeners. These strategies differ in their prescription aim (such as restoration of normal loudness, maximisation of speech intelligibility, comfort of audibility/hearing) and consider different factors such as the listeners hearing loss and age, differences in frequency intensities and real-ear-to-coupler-differences. One common rule applied is the one-half gain rule (Lybarger Citation1963, Citation1978) where the optimal gain is half of the users hearing loss for moderate hearing losses. The one-half gain rule was extended leading to other prescription rules such as POGO (McCandless and Lyregaard Citation1983), NAL (Byrne and Dillon, Citation1986), DSL (Seewald et al. Citation1997) including company proprietary fitting rules.
Here, for VSB users, the fitting rule Desired Sensation Level (DSL i/o*,4) was applied (MED-EL Fitting Guide SYMFIT 6.1 and Fitting Guide Samba; Scollie et al. Citation2005), which prescribes higher amplification and gain in the high and low frequency bands in cases of moderate hearing losses compared to the NAL rule. As the achieved WRS will depend on the applied fitting rule our results have to be interpreted in this context. However, as fitting rules are intended to implement a specific target for devices that are not limited in output, it would be worth to investigate modified fitting rules that are adapted to devices with limited MO, such as AMEIs and bone conduction devices. The method described here to determine the DR allows to investigate the impact of fitting rules optimised for limited output.
Our results show a high sensitivity to WRS in quiet towards the covered DR. Although a sigmoidal function was fitted to the single patient data, the WRS grows rather monotonously with DR with a slope insignificantly different from 1, and asymptotically approaches a plateau, the modelled maximum WRS of 93%, at approximately 40 dB DR. A strong positive correlation (r = 0.8) was found between WRS and DR, and the DR explains almost 64% of the variance of the speech outcome (R2=0.637). Two critical DR thresholds were identified. The first critical point is at a DR of approximately 20 dB above which the median WRS is at least 80% and below which the WRS steeply declines. A second significant shift was determined at a DR of 40 dB above which the WRS (median 90%) reached a plateau and higher DR only slightly improved the speech recognition. Whereas 20 dB could be considered the minimum covered DR, 40 dB seems to be the target value for optimum DR/speech perception. Thus, the minimum covered DR lies below the suggested DR found in literature of 30 to 35 dB while the optimum is found to be higher.
The covered dynamic range was correlated to speech in quiet at conversational level only, and different results must be expected for speech in noise. Speech recognition in noise is even more challenging and the speech signal must be separated from the background noise or competing noise. In devices with limited MO the output of the speech signal may be limited while the noise signal in amplified to the level of the MO which diminishes the level differences between speech and noise signals. Thus, the speech signal is less distinguishable from the noise signal and reduces the speech intelligibility in noise. A higher MO and therefore higher DR might be necessary to maintain the signal-to-noise ratio and sufficient speech understanding in noise.
The covered dynamic range calculated in this study should not be mistaken for the physical inner ear dynamic range. Our calculation of the dynamic range is based on the assumption that the implant maximum output does not cover the entire inner ear DR of the patient i.e. the MO is assumed to be lower than the patient’s UCL. The average MO determined for the Vibrant Soundbridge round window application did not surpass the 81 dB HL (MOL, maximum output hearing level, Maier et al. Part 1). It is intended for patients with mild to moderate-severe hearing losses and with the UCL usually above the MO of the device. Thus, the covered DR merely reflects the part of the dynamic range accessible to the patient by using an implant but not the inner ear dynamic range.
Comparing the different DR models applied, we found only minor differences between absolute DR and SII-weighted DR. The deviation of DR from the SII-weighted WDR PTA4 and WDRPTA5 respectively, comprises only few decibels (minimum −2.8 dB; maximum 3.2 dB). The largest difference was visible between DRPTA4 and the 8-frequency DRPTA8 (−7.5 to 2.5 dB) but did not change the overall outcome and results. The advantage of a shorter data set comprising only the main 4 speech related and almost always available frequencies 0.5, 1, 2 and 4 kHz is undiminished compared to an extended frequency resolution/range (in this case up to eight frequencies) as the loss of information seems to be negligible.
Although the determination of the DR is straightforward, some limitations of the study need to be mentioned. For the SII-weighted DR, the entire frequency range of the frequency importance function could not be used. The direct measurement of 0.25 kHz and 8 kHz is not implemented in the Samba audio processor or older generations. Band importance function for 0.25 kHz was neglected and for 8 kHz was applied to 6 kHz instead to determine the 5-frequency average. Modified band importance for calculation of SII-weighted dynamic range account for an error of 11.7% and 6.2% for the WDR PTA5 and WDR PTA4, respectively.
Further, the data (direct threshold and WRS) included in this study comprise a large time span from first activation to 10-year check-up because the direct measurement tool was not available in the early fitting software versions. Thus, speech recognition data from beginners and experienced implant users were pooled which might have introduced a small bias.
Another point that needs to be mentioned is that the WRS of patients was determined with different processor types. The type of processor can affect the speech recognition of users as new technical advances in speech processing may improve speech intelligibility with a newer generation processor. However, studies on the effect of different processor generations on speech outcome of implanted VSB patients found a significant difference between processor types for speech recognition in noise but not for speech recognition in quiet (using the German Freiburg monosyllable test) (Zimmermann et al. Citation2020). Since only speech in quiet data was used in this study, the influence of the processor type on WRS data used in this study can be considered low.
Conclusion
The individual DR could be successfully determined from patients’ clinical data only. Our results show that a DR of 20 dB can yield sufficient word recognition in quiet but increasing DR further improves the mean speech outcome and reduces the variability within the data. The absolute DR as a 4-frequency average is sufficient to determine the relationship between covered DR and WRS of implanted patients. The results propose a minimum covered DR of 20 dB and an optimum DR of 40 dB for patients implanted with a Vibrant Soundbridge.
Author contributions
All authors substantially contributed to this work: H.M. developed the idea for this study; S.B. analyzed the data and wrote the main paper; H.M. and T.L. discussed the results and implications, commented on the manuscript at all stages, provided critical revision of the manuscript and approved the final version to be published.
Acknowledgement
We thank Med-El for providing the device-specific data for the different Vibrant Soundbridge implant and processor generations, as that made the analysis and publication presented here possible.
Disclosure statement
SB and HM received travel support by Cochlear Ltd., MEDEL GmbH and Oticon Medical to conferences. The authors declare that the research was conducted in the absence of any commercial or financial relationships that could be construed as a potential conflict of interest.
Data availability statement
The clinical data that support the findings of this study are available from the corresponding author, SB, upon reasonable request. The technical data that support the findings of this study are available in the accompanying manuscript from the co-author, H.M., entitled “An easy method to determine crucial AMEI performance parameters from clinical routine data in individuals – Part 1: maximum output”.
Additional information
Funding
References
- American National Standards Institute (ANSI) 1997. Methods for Calculation of the Speech Intelligibility Index (ANSI S3.5-1997). New York: ANSI.
- Boothroyd, A., F. N. Erickson, and L. Medwetsky. 1994. “The Hearing Aid Input: A Phonemic Approach to Assessing the Spectral Distribution of Speech.” Ear and Hearing 15 (6):432–442. https://doi.org/10.1097/00003446-199412000-00004.
- Byrne, D., and H. Dillon. 1986. “The National Acoustic Laboratories' (NAL) new procedure for selecting the gain and frequency response of a hearing aid.” Ear and Hearing 7 (4):257–265. https://doi.org/10.1097/00003446-198608000-00007.
- Dillon, H., and L. Storey. 1998. “The National Acoustic Laboratories’ Procedure for Selecting the Saturation Sound Pressure Level of Hearing Aids: Theoretical Derivation.” Ear and Hearing 19 (4):255–266. https://doi.org/10.1097/00003446-199808000-00001.
- French, N. R., and J. C. Steinberg. 1947. “Factors Governing the Intelligibility of Speech Sounds.” The Journal of the Acoustical Society of America 19 (1):90–119. https://doi.org/10.1121/1.1916407.
- Grossöhmichen, M., R. Salcher, H.-H. Kreipe, T. Lenarz, and H. Maier. 2015. “The CodacsTM Direct Acoustic Cochlear Implant Actuator: Exploring Alternative Stimulation Sites and Their Stimulation Efficiency.” PloS One 10 (3):e0119601. https://doi.org/10.1371/journal.pone.0119601.
- Lybarger, S. 1963. Simplified Fitting System for Hearing Aids. Canonsburg, PA: Radioear Corp.
- Lybarger, S. 1978. “Selective amplification, A Review and Evaluation.” Journal of the American Audiology Society 3 (6):258–266.
- Maier, H., T. Lenarz, and S. Busch. 2024. An easy method to determine crucial AMEI performance parameters from clinical routine data in individuals – Part 1: maximum output. International Journal of Audiology 1–8.
- McCandless, G. A., and P. E. Lyregaard. 1983. “Prescription of Gain/Output (POGO) for Hearing Aids.” Hearing Instruments 34 (1):16–21.
- MED-EL Fitting Guide SYMFIT 6.1 and Fitting Guide Samba. Accessed May 27, 2024. https://www.manualslib.com/manual/2052332/Medel-Symfit-6-1.html and https://www.manualslib.com/manual/1583174/Med-El-Samba.html?page=1#manual
- Scollie, S., R. Seewald, L. Cornelisse, S. Moodie, M. Bagatto, D. Laurnagaray, S. Beaulac, and J. Pumford. 2005. “The Desired Sensation Level Multistage Input/Output Algorithm.” Trends in Amplification 9 (4):159–197. https://doi.org/10.1177/108471380500900403.
- Seewald, R., L. Cornelisse, K. Ramji, S. Sinclair, K. Moodie, and D. Jamieson. 1997. “A Software Implementation of the Desired Sensation Level (DSL[i/o]) Method for Fitting Linear Gain and Wide Dynamic Range Compression Hearing Instruments: Version 4.1a.” User’s Manual. London, Ontario: University of Ontario.
- Snik, A., J. Noten, and C. Cremers. 2004. “Gain and Maximum Output of Two Electromagnetic Middle Ear Implants: Are Real Ear Measurements Helpful?” Journal of the American Academy of Audiology 15 (3):249–257. https://doi.org/10.3766/jaaa.15.3.7.
- Studebaker, G. A., R. L. Sherbecoe, D. M. McDaniel, and C. A. Gwaltney. 1999. “Monosyllabic Word Recognition at Higher-Than-Normal Speech and Noise Levels.” The Journal of the Acoustical Society of America 105 (4):2431–2444. https://doi.org/10.1121/1.426848.
- Wardenga, N., A. F. M. Snik, E. Kludt, B. Waldmann, T. Lenarz, and H. Maier. 2020. “Hearing Aid Treatment for Patients with Mixed Hearing Loss. Part II: Speech Recognition in Comparison to Direct Acoustic Cochlear Stimulation.” Audiology & Neuro-Otology 25 (3):133–142. https://doi.org/10.1159/000504285.
- World Health Organization 2008. “Grades of hearing impairment (p. 23, Table 4) in European Commission SCENIHR. 2008.” “Potential health risks of exposure to noise from personal music players and mobile phones including a music playing function.
- Zeng, F.-G., G. Grant, J. Niparko, J. Galvin, R. Shannon, J. Opie, and P. Segel. 2002. “Speech Dynamic Range and its Effect on Cochlear Implant Performance.” The Journal of the Acoustical Society of America 111 (1 Pt 1):377–386. https://doi.org/10.1121/1.1423926.
- Zhao-Gang, L., and L. Feng-Ri. 2003. “The Generalized Chapman-Richards Function and Applications to Tree and Stand Growth.” Journal of Forestry Research 14 (1):19–26. https://doi.org/10.1007/BF02856757.
- Zimmermann, D., S. Busch, T. Lenarz, and H. Maier. 2020. “Audiological Results with the SAMBA Audio Processor in Comparison to the Amade for the Vibrant Soundbridge.” Audiology and Neurootology 25:164–171. https://doi.org/10.1159/000506067.
- Zwartenkot, J. W., A. F. M. Snik, M. Kompis, and C. Stieger. 2012. “Gain and Maximum Output of Implantable Hearing Devices in Patients with Moderate to Severe Sensorineural Hearing Loss.” Journal of Hearing Science 2 (3):35–40. https://doi.org/10.17430/883511.