
 ?Mathematical formulae have been encoded as MathML and are displayed in this HTML version using MathJax in order to improve their display. Uncheck the box to turn MathJax off. This feature requires Javascript. Click on a formula to zoom.
ABSTRACT
Price competitiveness is key for tourists’ destination choice. In the study, we evaluate the effects of an economic decline caused by non-tourism industry on a tourist destination’s price competitiveness. An econometric model of hotel revenue function is estimated in the study. Specifically, we estimate hotel revenue functions at the regional level in Norway to investigate how the crude oil price collapse and the subsequent economic decline influenced tourism demand in Norway. This type of cross-sectorial effect of non-tourism industries on tourism competitiveness has been little discussed in the tourism literature. The results show that the fall in crude oil price boosted tourism growth in Norway through a weakening of the local currency. This means tourism development is not always associated with economic growth, as discussed in most of the tourism literature. There might be some upper bounds of wealth in a nation where additional growth does not foster further tourism development due to the inflationary effects of economic growth. The study therefore adds new insights into the literature on tourism and economic growth.
Introduction
The role of price competitiveness in tourism is widely understood, but except for the study by Dwyer, Forsyth, and Rao (Citation2002), the causes of relative price differences are seldom discussed. This is likely because tourism studies seldom venture far outside the tourism domain while the price level in a destination is formed in the economy at large. In a theoretical model, Perles-Ribes, Ramón-Rodríguez, Sevilla-Jiménez, and Rubia (Citation2016) point out that a decrease in relative prices can counter the negative effect of an economic crisis on tourism performance. Following this reasoning, the main objective of our study is to question if the “birth of a tourist nation” can come about quite accidentally because of an economic decline and its secondary effect on relative prices. Specifically, we investigate an empirical case where the growing price competitiveness of the tourism industry in Norway appears to have outweighed the negative effects of an economic decline.
The economic decline in Norway driven by a plunge in the crude oil price commenced in 2014. Since the Norwegian economy was dominated by the oil industry and the slowing oil production also caused negative spillovers to other economic sectors, the oil price crisis directly led to a significant economic decline. Traditionally, a technical definition of an economic recession is that a nation's gross domestic product (GDP) has been measured as a decline in at least two successive quarters (Eaton, Kortum, Neiman, & Romalis, Citation2016). Although on a yearly basis, the Norwegian GDP decreased between 2014 and 2016, according to the World Bank data (The World Bank, Citation2019), it did not show a decrease in every successive quarter. Therefore for the overall Norwegian GDP decline in this period, we call it economic decline instead of economic recession in the study. The economic decline weakened the local currency and therefore increased the price competitiveness of the tourism sector in Norway. The period of decline accompanied by the weakening of the local currency from 2014 to 2016 was associated with a 24% increase in the number of leisure tourists’ hotel overnight stays (Statistics Norway, Citation2019).
It is not obvious what should be the outcome of an economic downturn on tourism performance in a high-cost country. Smeral (Citation2003) argues that in developed economies, long-term economic growth causes tourism growth due to the significant positive effect of income elastic tourism demand. Based on this reasoning, a decline ought to reduce tourism demand. The negative impact of the world economic recession on the global tourism demand during 2008 and 2009 was documented by Smeral (Citation2010). Satistics Norway (Citation2019) also shows the number of hotel overnight stays in Norway decreased by 2% and 3% respectively in 2008 and 2009. Bjornland and Thorsrud (Citation2016) have given the same conclusion but used a different argument of spill-over effect between industries in a country. They showed that the oil sector in Norway has significant positive spillover effects on the hotel and restaurant sectors. The downturn in the oil industry and subsequent economic decline should, therefore, lead to a contraction effect for those tourism sectors. However, something that has not been considered in these studies is a secondary effect of economic development. For instance, economic decline often brings a weakening of the local currency. A weaker local currency then increases the relative price competitiveness of the destination country. It consequently encourages more residents/companies to take their vacation/to arrange meetings and conferences in their home country (e.g. Norway), and at the same time, makes the country (e.g. Norway) more attractive to foreigners. In sum, the income and relative price effects pull in opposite directions, and its net result is an empirical question.
To analyze the link between the economic decline and tourism demand, we estimate the revenue functions of the hotel sector in Norway that includes regional effects. Strictly, tourism demand also consists of the products and services purchased by tourists (Song & Witt, Citation2000). However, due to the limitation of data availability, we use hotel revenue to reflect the overall magnitude of tourism demand. The regional effects are relevant since the strength of the decline varied regionally due to the uneven spatial distribution of the oil industry throughout the country.
The paper starts with a discussion about the literature on tourism destination competitiveness before providing background to our case study on the impact of economic decline and exchange rate weakening on the Norwegian tourism industry. Next, we develop the hypotheses to be tested, present the data and research methods. Finally, we present and discuss the empirical findings of the model results. The paper concludes with a discussion of the main findings.
Background
Price competitiveness is regarded as the most important economic influence on tourist destination choice (Dwyer, Forsyth, & Rao, Citation2000). Vacationers often need to dig deep in their pockets before packing suitcases, which makes it key for the successful tourist destination to be price competitive (Assaf & Alexander, Citation2012; Culiuc, Citation2014; Dwyer et al., Citation2000; Nordström, Citation2004; Røkenes, Citation2007). Compared to vacationers, business travelers are less price sensitive. Nevertheless, firms may investigate alternatives if a destination country is continuously expensive (Kulendran & Wilson, Citation2000). Since international tourists measure their real costs in their own currency rather than that of the destination, price competitiveness is influenced by exchange rate fluctuations (Aalen, Iversen, & Jakobsen, Citation2019; Dwyer et al., Citation2000, 2003; Khalik Salman, Arnesson, Sörensson, & Shukur, Citation2010). Earlier studies have found the price elasticity of inbound tourism demand tends to be slightly above unity (Peng, Haiyan, Geoffrey, & Stephen, Citation2015). This implies a ten percent strengthening of a destination currency reduces inbound tourism demand by more than ten percent.
Even if tourism development will depend on building appeal, image, quality of tourist services, destination marketing and promotion, cultural ties, etc., price competitiveness is key (Dwyer et al., Citation2000). If tourists perceive a destination is dear relative to competing destinations, they will largely shun it unless there are alternative ways to reduce travel costs; one such example is the success of international cruise lines that allows tourists to experience both fjords and Northern lights while sheltering their passengers from the high price level in Norway (Larsen, Wolff, Marnburg, & Øgaard, Citation2013; Sandvik, Enger, & Iversen, Citation2015).
In tourism studies, there has been a particular focus on how tourism growth in developing countries depends on economic growth, especially through its contribution in improving tourism infrastructure, accessibility, and institutional factors, etc. in the destination economy (Eugenio-Martin, Martin-Morales, & Sinclair, Citation2008; Ivanov & Webster, Citation2013; Yap & Saha, Citation2013). While something that has been ignored in the literature is that the development of the tourism industry in a high-income country might be impeded because the country is being “too” rich. The reason is that the inflationary effects of economic growth on a destination economy that already has a high price level can be detrimental for tourism price competitiveness. Thus, an economic decline could bode well for tourism sectors if the positive effect of improved price competitiveness outweighs the negative income effects. A decline can then end up boosting tourism growth. If this is the case, tourism growth is not always positively associated with economic growth. In the following, we focus on the decline in the Norwegian economy and its impact on tourism demand.
Economic decline and tourism price competitiveness
Although the cost of living indexes, such as consumer price index (CPI), apply to residents, not tourists, they are widely used to proxy the cost of tourism in destinations (e.g. Song & Witt, Citation2000). In our study, instead of using CPI, which is more useful for tracking changes in the cost of living in a country over time, we use the cost of living index provided by Numbeo.com (Citation2018)Footnote1 to compare the cost level differences between countries. The Numbeo index shows prior to 2014, Norway was the most expensive country in the world. It mirrors the price disadvantage Norway had as a tourist destination, which leads to that not only international tourists regard Norway as an expensive destination but also the Norwegian tourists travel outside of Norway to reduce costs. shows the cost of living index for Norway, its neighboring Nordic countries (Denmark, Finland, Iceland, and Sweden) and the largest tourist destinations in Europe (Spain, France, Italy, Switzerland, UK, and Germany) compared to the New York City (the base of the index).
Figure 1. Cost of living index in Norway and other European countries (Numbeo.com, Citation2018). Data source: Numbeo.com.
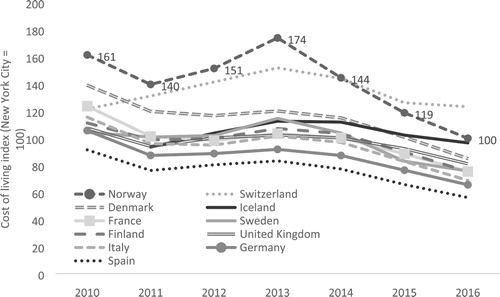
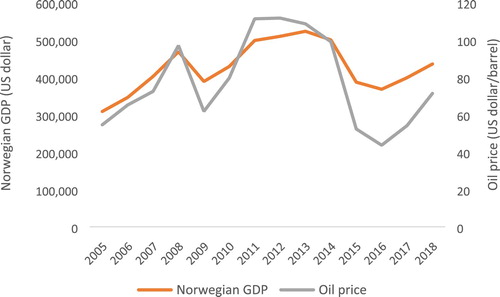
In 2013, Norway’s index was 174, suggesting it had an average price of 74% higher than in New York City. By taking the average of the indexes of the countries in each category, Norway’s index was 60% higher than the largest destinations in Europe and 53% higher than the neighboring Nordic countries. However, since the oil and gas industry was, and still is, the largest economic sector in Norway (Bjornland & Thorsrud, Citation2016; Torvik, Citation2001), the steep fall in the crude oil price in late 2013 triggered an economic decline (). Using annual data from 2005 and 2017, the correlation coefficient between the Norwegian GDP and the crude oil price was 0.92, mirroring the economy’s oil dependency. The dependence is also reflected in . After the economic decline, Norway's cost of the living index fell for three consecutive years, it resulted equal to that of New York City and only 24 and 20% higher than that of the largest destinations in Europe and the neighboring Nordic countries, respectively (see ) in 2016. Since the Numbeo’s cost of living index compares the living costs across countries, the index is influenced by exchange rates, the relative price changes between countries measured by same currency are big when exchange rates vary. The reduction in the Norwegian cost of living index in 2016 is an exhibit that the depreciation of Norwegian kroner increased the relative price competitiveness of the Norwegian tourism industry.
Figure 2. Correlation between the Norwegian GDP and the world crude oil price. Data source: The World Bank and the U.S. Energy Information Administration.
Tourist boom in Norway
According to Statistics Norway (Citation2019), the number of total commercial overnight stays is 33.8 million in Norway in 2018. Among them, 70% are hotel accommodation, and the left 30% are cottage and camping overnight. The steep fall in the Norwegian krone after 2014 is illustrated in , together with tourists’ hotel overnight stays. The exchange rate is measured as the Norwegian Krone (NOK) against the currencies of the top 10 tourist emitting countriesFootnote2 (measured in quantity of overnight stays in Norwegian hotels). Because many international visitors come from the euro area, the exchange rate index is heavily weighted against Euro (45%). The other currencies included in the calculation are Swedish Krone, Danish Krone, British Pound, US dollar, Chinese Yuan and Japanese Yen. shows that a significant increase followed the drop in the exchange rate from 2014 in tourists’ hotel overnight stays. Specifically, shows the annual growth rate of the tourist guest stays before the economic decline is 1.9% versus 4.0% after. We have to note the low growth rate between 2005 and 2013 is also partly due to the negative impact of the world economic recession on the global tourism demand between 2008 and 2009. For the different travel purposes, the annual growth rates of hotel overnight given by guests traveling for course/conference, business, and leisure are 0.50%, 3.70%, and 1.00%, respectively, before the economic decline. Their growth rates become 2.03%, 2.18%, and 5.99%, respectively, after the economic decline. If we look at the origins of tourists, before the economic decline, the growth rates in the international and domestic markets are 0.8% and 2.3%, respectively, which become 5.46% and 3.47% after the decline. The tremendous growth in the leisure segment where international tourists are major contributors is thus suggested.
Figure 3. Development in number of tourists’ hotel guest nights relative to changes in value of NOK currency. Data source: Statistics Norway and The World Bank.
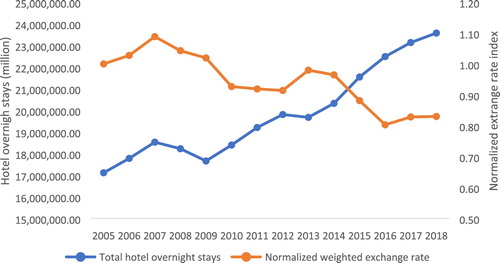
Table 1. Number of overnight stays in hotels in Norway (in million).
In our sample period, the shares of the tourist’s travel for different purposes are 13% for course/conference, 38% for business travel, and 49% for holiday. The share of the leisure segment has expanded from 48% before the economic decline to 51% after the economic decline. This phenomenon is particularly apparent in Western Norway, a cluster area of oil companies in Norway. Between 2014 and 2018, the hotel overnight stays in Western Norway for the course/conference guests, and business travelers decreased by 12% and 7%, respectively. Contrarily, the hotel overnight stays for the leisure segment grew by 45% (Appendix ).
In each segment, it is impossible to identify the origins of tourists. However, in an aggregation level of the total overnight stay, we know 73% of the tourists are from Norway, and 27% are from abroad between 2005 and 2018 (). Improvement in price competitiveness should affect both domestic and international demand for overnight stays in Norway. Domestic tourists can substitute international travels with homebound travels when the local currency weakens. This is particularly relevant in a small and high-income country like Norway, where people have a high propensity to travel abroad. According to Statistics Norway (Citation2019), in 2018, 58% of the Norwegian took a holiday both in Norway and abroad. This suggests the exchange rates between the Norwegian krone and foreign currencies are important for Norwegian in making their decisions to travel inside Norway or abroad. Furthermore, as suggested by Larsen and Wolff (Citation2019), the study on the domestic tourist is important due to its large share.
Since the main objective of this study is to investigate if the recent growing tourism demand in Norway is made by the overwhelming effect of improving price competitiveness, special attention is given to the two economic factors, GDP and the exchange rate. While this does not mean we disregard the fact that tourism competitiveness relies on a broad spectrum of factors.
Relative to its modest size, Norway is well “equipped” with tourist attractions. The Norwegian fjords were included in the UNESCO World Heritage in 2004 and named the best-unspoiled travel destination in the world in 2004 and 2009 by the National Geographic’s Traveler Magazine (Erfurt-Cooper, Citation2009; Hawkins, Chang, & Warnes, Citation2009). The Disney animation movie “Frozen” (released in December 2013) and the TV series “Vikings” (started to produce in 2013) have both created awareness and pull factors for Norway as a tourist destination (Beaumont-Thomas, Citation2014; Metcalf, Linnes, Agrusa, & Lema, Citation2015), likely reinforcing foreigners’ perception of Norway as exotic with key image associations like cold, dark, snow, mountain, Vikings and fjords (Prebensen, Citation2007). The increasing awareness of Norway’s natural attractions and cultural heritage has undoubtedly contributed to growth in both cruise and land tourism. At the same time, Norway has the hotel capacity required for hosting inbound tourists and well-developed international air connectivity that is key to facilitate visits to a fringe destination like Norway (Tveteras & Roll, Citation2014).
Using a broad set of indicators of tourism competitiveness, Gooroochurn and Sugiyarto (Citation2005) found that Norway was among the top five most competitive tourist destinations compared to over 200 other countries in the world. Nonetheless, even if a destination has all the desired characteristics to be competitive, travel costs will still choke demand if the price is too high compared to alternative destinations or if it merely exceeds peoples’ travel budgets. According to the World Economic Forum’s travel and tourism competitiveness reports (e.g. Blanke & Chiesa, Citation2013; Crotti & Misrahi, Citation2017), Norway scores high in areas related to the overall economic environment, safety and security, infrastructure and natural resources, nevertheless, the nation’s price competitiveness score is low. It was ranked 131st in a total of 136 countries evaluated in the report in 2017.
Hypotheses
Perles-Ribes et al. (Citation2016) proposed a theoretical model of the effect of an economic crisis on tourism market performance where the key economic determinants, including the GDP and exchange rate, are elaborated. They discussed that a decrease in relative prices where the exchange rate is important can compensate for the negative effect of an economic crisis on tourism performance. We follow Perles-Ribes et al. (Citation2016)’s model to empirically test if an improvement in price competitiveness can counter the negative effect of an economic crisis on tourism performance. Studies show that income elasticities for tourism demand are positive and significant (Peng et al., Citation2015). An economic decline is likely to hit firms’ travel budgets, especially for the petroleum-related industries directly linked to the downturn in the crude oil price. Derived demand for hotel accommodation from the sectors will be thus adjusted downwards. Likewise, the decline also means reduced household income and, consequently, a decrease in the domestic leisure travelers’ hotel demand. As a result, the reduction in GDP following the oil price fall leads to a straightforward first hypothesis:
H1a): The economic decline measured as a reduction in GDP has decreased hotel demand in Norway.
Due to the uneven spatial distribution of the oil industry across Norway, the strength of the decline was stronger in some regions than others. In particular, the oil industry is heavily concentrated in the Western part of Norway. This leads us to formulate a second hypothesis related to the decline effects:
H1b: The economic decline measured as a reduction in GDP has reduced hotel demand more strongly in Western Norway than in any other region.
Compared to the negative effects of the oil revenue and household income reductions, the subsequent weakening of the destination currency ought to have the opposite effect on hotel demand: first, a weaker currency makes it more expensive to travel abroad for both Norwegian businesses and households. Second, the relative strengthening of international tourists’ own currencies relative to NOK makes it cheaper for foreign tourists to travel to Norway and thus increases the attractiveness of Norway as a holiday destination. Both effects are positive for hotel demand. This leads to the following hypothesis:
H2: The weakening of the domestic currency has increased the relative price competitiveness of Norway and therefore increased hotel demand in Norway.
Hypotheses H1a)-b) and H2 can be viewed as trivial as they establish what we already know about tourism demand, but for a particular case study. The more interesting empirical question is the net joint effect of the GDP fall and the positive impact of increasing price competitiveness represented by the weakening of the local currency. Among domestic travelers, the negative income effect of the GDP reduction is likely smaller in the leisure segment’s hotel demand compared to business demand. This is because the activity level directly impacts business travels in the dominant oil industry in the Norwegian economy. Among international travelers, the foreign tourists’ demand for hotel accommodation in Norway is unaffected by the Norwegian domestic economic decline. At the same time, the currency effect is unequivocally positive for all international hotel guest segments. This leads to the following hypothesis about the net joint effect of these two forces brought about by the oil price fall:
H3a): The net joint effect of the reduced GDP and the weaker domestic currency is positive for total hotel demand, including all the market segments.
The next and final hypothesis, H3b, reflects that the oil-driven decline affects more negatively hotel demand from the business community due to the reduced economic activity. In contrast, the decline only influences domestic leisure tourism negatively through the income effect, but not inbound tourism demand. Moreover, the leisure segment is usually considered more price sensitive, and, as such, their demand response to the weaker local currency should be stronger than for the business segment. Therefore, we have:
H3b): The net joint effect of the reduced GDP and the weaker domestic currency is more positive for leisure tourists’ hotel demand compared to other guest segments’ hotel demand.
If the last hypothesis holds true, it implies a shift in the makeup of hotel guests towards a more significant share of leisure guests.
Data and research method
The Norwegian hotel data were obtained from Statistics Norway (SSB, Citation2019), including an overnight stay dataset and a hotel price dataset. The overnight stay dataset includes the number of overnight days in hotels in different Norwegian counties. The overnight stays were aggregated to six regions according to the definition given by the SSB, the capital Oslo, Eastern Norway (EN), Southern Norway (SN), Western Norway (WN), Central Norway (CN), and Northern Norway (NN). The average shares for the regions are 20% for EN, 17% for SN, 21% for WN, 12% for CN, 11% for NN, and 19% for Oslo between 2005 and 2018 (Appendix ). This regional distribution delineates naturally distinct tourism regions in Norway. For example, urban tourism will be more concentrated in the Oslo region, cruise tourism more heavily in the fjords of Western Norway, and tourism related to Northern lights and the midnight sun in Northern Norway.
The hotel price for each region is composed of the share-weighted average of the hotel price in each county that makes up the region. The shares used are the percentage of total overnight stays of each county in the region. Hotel price provided by the SSB is the average price for the total hotel demand, not specified to each guest segment. However, the hotel overnight stays dataset allows us to decompose guests according to their travel purposes as course/conference guest, business guest, and holiday guest. Accordingly, by multiplying the hotel price with the hotel overnight stays in each guest segment, we get revenue for each segment. The data is organized into a panel containing hotel overnight stays and hotel revenues in six regions over the time period.
The oil price is the Europe Brent spot prices for crude oil in US dollars per barrel in the trade term of Free of Board (FOB). The data were obtained from the U.S. Energy Information Administration (EIA, Citation2019). Exchange rates were provided by the Norges Bank (Citation2019), the central bank of Norway, and the consumer price index (CPI) and gross domestic product (GDP) of the tourists’ countries were obtained from the World Bank (Citation2019). All the data are monthly except for the GDP that is quarterly. Since only quarterly GDP data is available, we have aggregated the other data to quarterly by taking average values in each quarter.
Model
We start by formulating a basic tourism demand model following one of the most cited books on tourism demand modeling (Song & Witt, Citation2000). Hotel demand is a function of tourists’ income, which is often measured by GDP of guests’ source country, the relative price between a source country and destination country where the exchange rate is important , and other cost variables such as hotel price
. The function can be presented as:
(1)
(1) According to economic theory (Song & Witt, Citation2000), demand is positively related to GDP (a measure of tourists’ income) and negatively to exchange rate (when a unit of the destination currency is expressed in terms of the tourists’ currencies) and hotel price.
EquationEquation (1(1)
(1) ) of hotel demand in log–log form is:
(2)
(2) where
are parameters to be estimated, which can be interpreted as elasticities except
, which is a constant. Since most hotels adjust prices according to booking numbers, this creates simultaneous dependence of hotel prices on the number of overnight stays. To avoid the simultaneity issue, we shifted hotel price to the left side of the equation (multiplying it with demand
). By doing this, instead of the demand function, revenue function is estimated:
(3)
(3)
In the study, first, we want to investigate the overall effect of the economic decline on the Norwegian hotel demand. Second, as we have discussed, the international tourists’ demand for hotel accommodation in Norway is unaffected by the Norwegian economy, and the currency effect is undoubtedly favorable for international tourists. Thus special attention has been paid to inbound tourism. Third, the oil-driven recession should affect more significantly on the budget for the business traveler than the holiday traveler, while the exchange rate is unequivocally favorable for all travelers. Therefore, attention is further extended to the leisure segment. Consequently, Equationequation (3(3)
(3) ) has three empirical specifications. To conserve space, we have put the empirical model for total demand and demand in the leisure segment in one equation:
(4)
(4)
(5)
(5) where
represents the aggregated hotel revenue in region l in time t generated by the total hotel guests, leisure guests, and international guests, respectively. Revenue for total hotel guests includes demand by both domestic and international guests and for all travel purposes. Revenue in the leisure segment also includes both demand and international guests’ demand but only for the travel purpose of taking a holiday. International guest revenue as its name is the demand by international guests but for all travel purposes. Since domestic hotel guests account for 73% of the total overnight stays in Norway. In the data for the leisure tourist segment, no information is provided about tourists’ source countries. Furthermore, we want to investigate the effects of the economic decline in Norway on the Norwegian tourism industry through its effect on exchange rates and GDP. Therefore, the Norwegian GDP is used in both equations for total hotel revenue and revenue in the leisure segment. GDP in the international demand equation is the share-weighted GDP of the top 10 sources countries.
We assume the reduced economic activities resulting from the Norwegian economic decline affect differently on the hotel demand in the different regions. Particularly, compared to the other regions, it has a more significant negative impact in the oil industry clustered region (i.e. Western Norway). To identify this variation, we further have interactions between regional dummies and the GDP in Equationequation 4
(4)
(4) . Specifically,
interacts of the GDP with the regional dummies, where l = 1, 2, 3, 4, 5, 6 represent Eastern Norway (ES), Southern Norway (SN), Western Norway (WN), Central Norway (CN), Northern Norway (NN), respectively. By doing this, the parameter of
measures the effect of the Norwegian GDP on the base region, which is the capital Oslo, and the parameters of
measure the difference of GDP effect in region l compared to Oslo. The GDP elasticity in region l is thus computed by the parameter of
plus that of
. This interaction effect is not included in Equationequation 5
(5)
(5) because it is less likely that the regional economic activity levels influence international tourists’ travel decisions in different Norwegian regions.
is weighted real exchange rates of the currencies of the top 10 countries’ currencies against NOK, computed by the nominal exchange rate times the share weighted CPI of these ten countries divided by the CPI of Norway. Compared to the nominal exchange rate, the real exchange rate better reflexes the purchasing power of the foreign curries against NOK. The left variables
and
are regional dummies and interacts of regional dummies with seasonal dummies.
is 1 when demand occurs in region l (e.g. Western Norway) and otherwise 0;
is 1 when it is seasonal
(e.g. summer), otherwise 0. Tourism demand varies significantly between regions and fluctuates between seasons. Although the regional and seasonal variables are not the key variables in the study, they are critically important to make the estimation of the key variables (i.e. exchange rate and GDP) correct.
Estimated results
Equation 4 and 5 were estimated by multivariate ordinary least square (OLS) using the statistical software R. shows the estimation results for the models. Most of the estimated parameters are significant and have the expected signs with s between 0.86 and 0.91, suggesting the models have high explanatory power and are correctly specified. As expected, the results show that weaker NOK has contributed significantly to the tourist boom in Norway. The impact on hotel demand revenue of the reduction in GDP following the economic downturn varies across the regions. Western Norway is the most affected, where the “oil capital” of Norway, Stavanger, is located.
In the equation for the total overnight stays (), the estimated coefficient of is around 0.5. Although its magnitude is lower than what is found in tourism demand studies (e.g. Peng et al., Citation2015), the positive income elasticity supports hypothesis H1a, economic decline has made the hotel demand declined. The magnitude implies the declining rate of hotel revenue due to the decline is less than that of the overall Norwegian economy decline. Specifically, it suggests when the Norwegian GDP decreases by one percent, the total hotel revenue in the base region Oslo decreases by 0.5%. However, as
fell 29% between 2014 and 2016 (), the impact is still considerable.
Table 2. GDP, hotel price and hotel revenue in Norway.
As we have discussed, the five interaction variables between the Norwegian GDP and regions modify the regional impact of the economic decline on hotel revenues relative to the base region. Among them, the interaction variable of Western Norway is positive and has the biggest magnitude (0.25). It means the elasticity of hotel revenue in Western Norway with respect to the Norwegian GDP is 0.25 bigger than that of Oslo (base region). The elasticity for Western Norway then becomes 0.75. It suggests the impact of the economic downturn has been greater in Western Norway than any other region. This finding provides support for hypothesis H1b) that the bulk of these decline effects on demand are oil-economy driven.
As expected, the impact of the exchange rate on the total hotel revenue is large (). The estimated elasticity of total hotel revenue with respect to the real exchange rate is around −1.1, which is in accordance with previous findings (Peng et al., Citation2015). The magnitude of the exchange rate elasticity is larger than any regional GDP elasticity. For instance, it is more than double the magnitude of the GDP elasticity in Oslo. This result explains why hotel revenue in Oslo has continued to increase during the economic decline. The reason is that the weakening of the local currency has more than compensated for the negative effects of domestic GDP. In sum, the weakening of NOK has increased the comparative price advantage of Norway as a destination. This lends support to hypothesis H2, as expected.
Table 3. Estimation results for hotel revenue models.
also shows the decomposed effects of GDP and exchange rate on revenue generated by international guests and leisure guests. Compared to that in the total hotel revenue equation, the GDP elasticity in the leisure tourism equation is slightly larger for Oslo and Northern Norway than for Western Norway, signaling that it is the business segment that makes Western Norway the most sensitive region to GDP changes in the total revenue function. What most stands out about these regional differences is the inelasticity of hotel revenue in the Eastern and Southern Norway to income changes. What this probably reflects is that the incomes of tourists’ who stay over in hotels in these two regions are not much affected by the decline. The exchange rate elasticity is larger in the leisure tourist-guest segment equation than in the total hotel revenue equation. This reflects private households are more price sensitive than businesses concerning travel decisions (Brons, Pels, Nijkamp, & Rietveld, Citation2002). In fact, when evaluated on its own, the tourist segment has been extremely responsive to the weakening of the Norwegian krone (with a magnitude of 1.6 elasticity). This has also brought more international tourists to Norway and likely made them stay longer in Norway (Alegre & Pou, Citation2006). These results support the idea that the downturn in one economic sector and the resulting improvement in price competitiveness can give birth to a tourist nation.
In the equation for the international guest hotel overnight stays, the estimated parameter of GDP and exchange rate are 1.469 and −0.501, respectively. The results suggest the growing world economy and the weak NOK have uniformly contributed to the growth in Norwegian inbound tourism. Since the majority of international tourists are leisure tourists, the results also suggest the economic recession is more favorable to the leisure tourism segment.
To give an overall evaluation of how the collapse of the oil price affects the Norwegian hotel demand. We use the estimated elasticities of the Norwegian GDP and exchange rate in the equation for total hotel demand for computing their collective net impact on the Norwegian hotel industry. The GDP elasticity is the mean elasticity, which, as discussed earlier, is the estimated elasticities of each region weighted by the average number of stayover nights by region. Following this method, we get the weighted elasticity of GDP in the total revenue equation is 0.50. The Norwegian GDP declined by 29% between 2014 and 2016. This means the decline in the Norwegian economy made the total hotel revenue in Norway decreased by 15% (0.50 multiply 29%). At the same time, the elasticity of the exchange rate is −1.14. The NOK depreciated by 18% in the same period. It means the weak NOK made the total hotel revenue to increase by 20% (1.14 multiply 20%). The net joint effect of these two is 4%. Therefore, the hypothesis H3a, the overall effect of economic decline on total hotel demand in Norway, is positive is supported.
For the leisure segment, the weighted GDP elasticity is 0.56. Again, the rate of GDP decline is 29% in this period. Therefore, the revenue decrease in this segment given by the economic decline is 16%. The exchange rate elasticity in the holiday equation is −1.59, again the NOK depreciated by 18%. Therefore, the hotel revenue growth in the leisure tourism segment contributed by the deprecation in NOK is 29%, which is quite significant. The net joint effect of both GDP and NOK is 12%, much bigger than 4% in the same measurement for the total hotel revenue. This further suggests the joint net effect of the economic decline and weak NOK is more favorable to the leisure segment than the other segments, including the business and course & conference guest segments. Thus, the hypothesis H3b that the overall effect of the economic decline is greater for holiday hotel demand compared to the other segments is also supported.
One caveat is that elasticity measures the marginal effect of a factor. The average effect of a factor is always bigger than the marginal effect. Therefore, although the above evaluation makes sense, the actual growth rates for both the total hotel revenue and revenue created by the tourist segment are larger than those predicted here. In reality, they are 14% and 25%, for total hotel revenue and hotel revenue in the holiday segment, respectively. Another caveat is we use the period between 2014 and 2016 when the Norwegian economy was most significantly hit by the oil price collapse ( and ), and the Norwegian krone is most depreciated against main world currencies (). The Norwegian GDP and the NOK has recovered a little bit, although not completely following the recovery of the world oil price after 2016.
Discussion
In the study, the impact of the economic decline on the Norwegian tourism industry has been investigated in two dimensions. First, the oil-price-induced decline made the Norwegian economy slowdown. The decline leads to an income-driven contraction in hotel demand, in particular for the regions dominated by the oil industry. The economic decline reduced hotel demand due to 1) firms’ reduction in travel expenditures and 2) households’ reduction in incomes. Second, the decline weakened the Norwegian kroner and improved the relative price competitiveness of Norway as a tourism destination. The weakened currency made it cheaper for international visitors to travel to Norway and more expensive for Norwegian travelers to travel abroad. These two effects jointly made more tourists spend more days in Norwegian hotels. The estimated results show that the weakening of the NOK has more than compensated from the negative GDP effects. Specifically, the currency depreciation increased the price competitiveness of Norway and attracted more leisure tourists.
Before the oil crisis, despite Norway had all the desired characteristics to be competitive (Gooroochurn & Sugiyarto, Citation2005), travel cost and costs of other tourism services choked the growth of the Norwegian tourism industry. In a literal sense, this was reflected by oil companies’ demand for hotel rooms and pushing up room rates, which dispersed leisure tourists with relatively lower purchasing power (Bjornland & Thorsrud, Citation2014). This was also extended to key inputs such as labor since the higher productivity allowed firms in other industries to pay much higher salaries than that attainable in the tourism industry. The wealth generated by the non-tourism industries created inflationary effects for all labor-intensive services and products that could not be cheaply imported, leading to the low price competitiveness of Norway.
The oil-price driven decline that resulted in a weaker NOK has substantially improved Norway’s relative price competitiveness. This type of cross-sectorial effect of non-tourism industries on tourism competitiveness has been little discussed in the tourism literature. In conjunction with the discussion of whether tourism growth causes economic growth (see, e.g. (Lee & Chang, Citation2008)), this case study is an example where tourism growth associates with economic regress.
Since the highly productive non-tourism industries (e.g. the oil industry) employed input resources that otherwise the tourism industry could have used, tourism has the lowest productivity among all the major industries in Norway, (Iversen, Løge, Jakobsen, & Sandvik, Citation2014). The extensive use of a migratory workforce and seasonal pattern of employment (Joppe, Citation2012; Lundberg, Gudmundson, & Andersson, Citation2009) in tourism reflects the low productivity, as domestic residents prefer to seek employment in industries with more permanent year-through job situation and higher wages. Therefore, a more uplifting perspective is the potential long-term effects of increased price competitiveness on tourism productivity. As a piece of anecdotal evidence, we noted a local newspaper reporting of counties’ investment plans in funiculars to create more convenient access to panoramic nature views for tourists (Olsen, Citation2018). This comes across as a newfound focus for local politicians located in the heart of the Western oil-belt in regard to regional industry development. Increased capital investments in tourism transport and infrastructure will contribute to making tourism more productive.
The results found in this study show that the impact on tourism visitation in Norway of the oil slump-driven economic decline in 2014 differs from the effect of the global economic crisis in 2008. While the oil slump caused the NOK to depreciate significantly in many years, the global financial crisis of 2008 did not. This illustrates that the net effect on tourism of an economic decline depends on the economy’s relative impact on 1) income and 2) relative price (i.e. by weakening the destination currency). The case of Iceland underlines this point. In contrast to Norway’s economy, the Icelandic economy collapsed in the wake of the global financial crisis in 2008, not least because Iceland was aiming to become a nation of bankers (Mixa, Citation2014). The subsequent crash of the Icelandic currency (ISK) meant that Iceland abandoned its banking ambitions and returned to being a nation of fishers. However, Iceland’s increased price competitiveness combined with Reykjavik’s role as an international airport hub set the stage for a tremendous boost in tourism (Johannesson & Huijbens, Citation2010). Thus, one can argue the transformation to a tourist nation was even stronger for Iceland compared to Norway. This supports our finding that a weakening of the currency induced by an economic decline can increase the price competitiveness of a country's tourism industry and result in the birth of a tourist nation.
Conclusion
In this paper, we tested the hypothesis that the economic downfall caused by the fall in crude oil prices has boosted tourism growth through a weakening of the local currency in Norway. The analysis supported this hypothesis since the positive currency effect outweighed the negative income effect. This case study demonstrates the key role of price competitiveness for a destination. Moreover, the result can be viewed as an expansion of Smeral’s (Citation2003) findings by saying that - at some income levels in the destination economy - the positive effects on tourism demand for further income growth are outweighed by the negative impact of reduced price competitive.
The results show tourism development is not always associated with economic growth, as discussed in most of the tourism literature. It means low-income countries are not the only destinations with an economic handicap that can affect tourism competitiveness (Eugenio-Martin et al., Citation2008; Ivanov & Webster, Citation2013; Yap & Saha, Citation2013); high-income countries can also have a handicap because a high price level deters many potential visitors. More specifically, there might be some upper bounds of wealth in a nation where additional growth does not foster further tourism development.
Disclosure statement
No potential conflict of interest was reported by the authors.
Notes
1. Numbeo.com is an online database of user-generated price data. Cost of Living Index is defined as follows on their website: “Cost of Living Index (Excl. Rent) is a relative indicator of consumer goods prices, including groceries, restaurants, transportation, and utilities. Cost of Living Index doesn't include accommodation expenses such as rent or mortgage.”
2. The top 10 countries are Germany, the Netherlands, Italy, France, Sweden, England, Denmark, the USA, China, and Japan, accounting for 74% of the total overnight stays in Norwegian hotels.
References
- Aalen, P., Iversen, E. K., & Jakobsen, E. W. (2019). Exchange rate fluctuations and demand for hotel accommodation: Panel data evidence from Norway. Scandinavian Journal of Hospitality and Tourism, 19(2), 210–225. doi: 10.1080/15022250.2018.1482566
- Alegre, J., & Pou, L. (2006). The length of stay in the demand for tourism. Tourism Management, 27(6), 1343–1355. doi: 10.1016/j.tourman.2005.06.012
- Assaf, A. G., & Alexander, J. (2012). Identifying and ranking the determinants of tourism performance: A global Investigation. Journal of Travel Research, 51(4), 388–399. doi: 10.1177/0047287511426337
- Beaumont-Thomas, B. (2014). Disney's Frozen gives boost to Norwegian tourism. The Guardian. Retrieved from https://www.theguardian.com/film/2014.
- Bjornland, H., & Thorsrud, L. (2014). What is the effect of an oil price decrease on the Norwegian economy. Oslo: Norges Bank.
- Bjornland, H. C., & Thorsrud, L. A. (2016). Boom or gloom? Examining the Dutch Disease in two-speed economies. The Economic Journal, 126(598), 2219–2256. doi: 10.1111/ecoj.12302
- Blanke, J., & Chiesa, T. (2013). The travel & tourism competitiveness report 2013 . In NA (Vol. May). Geneve, Switzerland: The world Economic Forum.
- Brons, M., Pels, E., Nijkamp, P., & Rietveld, P. (2002). Price elasticities of demand for passenger air travel: A meta-analysis. Journal of Air Transport Management, 8(3), 165–175. doi: 10.1016/S0969-6997(01)00050-3
- Crotti, R., & Misrahi, T. (2017). The travel & tourism competitiveness report 2017. Paving the way for a more sustainable and inclusive future. In The world economic Forum: Geneva, Switzerland (pp. 2017).
- Culiuc, M. A. (2014). Determinants of international tourism (No. 14–82). Washington, D.C: International Monetary Fund.
- Dwyer, L., Forsyth, P., & Rao, P. (2000). The price competitiveness of travel and tourism: A comparison of 19 destinations. Tourism Management, 21(1), 9–22. doi: 10.1016/S0261-5177(99)00081-3
- Dwyer, L., Forsyth, P., & Rao, P. (2002). Destination price competitiveness: Exchange rate changes versus domestic inflation. Journal of Travel Research, 40(3), 328–336. doi: 10.1177/0047287502040003010
- Eaton, J., Kortum, S., Neiman, B., & Romalis, J. (2016). Trade and the global recession. American Economic Review, 106(11), 3401–3438. doi: 10.1257/aer.20101557
- Erfurt-Cooper, P. (2009). European waterways as a source of leisure and recreation. In M. Cooper, & B. Prideaux (Eds.), River tourism (pp. 95–116). UK: Cabi.
- Eugenio-Martin, J., Martin-Morales, N., & Sinclair, M. (2008). The role of economic development in tourism demand. Tourism Economics, 28(2), 391–398.
- Gooroochurn, N., & Sugiyarto, G. (2005). Competitiveness indicators in the travel and tourism industry. Tourism Economics, 11(1), 25–43. doi: 10.5367/0000000053297130
- Hawkins, D. E., Chang, B., & Warnes, K. (2009). A comparison of the National Geographic Stewardship Scorecard Ratings by experts and stakeholders for selected world heritage destinations. Journal of Sustainable Tourism, 17(1), 71–90. doi: 10.1080/09669580802209944
- Ivanov, S., & Webster, C. (2013). Globalisation as a driver of destination competitiveness. Annals of Tourism Research, 43, 628–633. doi: 10.1016/j.annals.2013.07.010
- Iversen, E. K., Løge, T. H., Jakobsen, E. W., & Sandvik, K. (2014). Verdiskapingsanalyse av reiselivsnæringen i Norge – utvikling og fremtidspotensial. Retrieved from the Norweigan Government website https://www.regjeringen.no/no/dokumenter.
- Johannesson, G. T., & Huijbens, E. H. (2010). Tourism in times of crisis: Exploring the discourse of tourism development in Iceland. Current Issues in Tourism, 13(5), 419–434. doi: 10.1080/13683500.2010.491897
- Joppe, M. (2012). Migrant workers: Challenges and opportunities in addressing tourism labor shortages. Tourism Management, 33(3), 662–671. doi: 10.1016/j.tourman.2011.07.009
- Khalik Salman, A., Arnesson, L., Sörensson, A., & Shukur, G. (2010). Estimating international tourism demand for selected regions in Sweden and Norway with iterative seemingly unrelated regressions (ISUR). Scandinavian Journal of Hospitality and Tourism, 10(4), 395–410. doi: 10.1080/15022250.2010.484221
- Kulendran, N., & Wilson, K. (2000). Modeling business travel. Tourism Economics, 6(1), 47–59. doi: 10.5367/000000000101297460
- Larsen, S., & Wolff, K. (2019). In defence of the domestic tourist-a comparison of domestic and international tourists’ revisit-intentions, word-of-mouth propensity, satisfaction and expenditures. Scandinavian Journal of Hospitality and Tourism, 19(4-5), 422–428. doi: 10.1080/15022250.2019.1695659
- Larsen, S., Wolff, K., Marnburg, E., & Øgaard, T. (2013). Belly full, purse closed: Cruise line passengers’ expenditures. Tourism Management Perspectives, 6(0), 142–148. doi: 10.1016/j.tmp.2013.02.002
- Lee, C.-C., & Chang, C.-P. (2008). Tourism development and economic growth: A closer look at panels. Tourism Management, 29, 180–192. doi: 10.1016/j.tourman.2007.02.013
- Lundberg, C., Gudmundson, A., & Andersson, T. D. (2009). Herzberg's Two-factor theory of work motivation tested empirically on seasonal workers in hospitality and tourism. Tourism Management, 30(6), 890–899. doi: 10.1016/j.tourman.2008.12.003
- Metcalf, B., Linnes, C., Agrusa, J., & Lema, J. (2015, 15–17 May). Do you want to build a snowman in Norway? The impact of Disney's Frozen movie on Norwegian tourism. Paper presented at the 21st Asia Pacific Tourism Association Conference, Kuala Lumpur, Malaysia.
- Mixa, M. W. (2014). A day in the life of an Icelandic banker. In E. P. Durrenberger & G. Palsson (Eds.), Gambling debt: Iceland's rise and fall in the global economy (pp. 33–46). Colorado: University Press of Colorado.
- Nordström, J. (2004). Estimating and predicting international tourism demand in Sweden. Scandinavian Journal of Hospitality and Tourism, 4(1), 59–76. doi: 10.1080/15022250410006408
- Norges Bank. (2019). Retrieved from https://www.norges-bank.no.
- Numbeo.com. (2018). Cost of living index. Retrieved from https://www.numbeo.com/cost-of-living/.
- Olsen, J. T. (2018, 10 April 2018). Disse kan ta turismen i Rogaland til nye høyder (These can take tourism in Rogaland to new heights). Stavanger Aftenblad. Retrieved from https://www.aftenbladet.no/lokalt/i/8wv6AA/Disse-kan-ta-turismen-i-Rogaland-til-nye-hoyder.
- Peng, B., Haiyan, S., Geoffrey, I. C., & Stephen, F. W. (2015). A meta-analysis of international tourism demand elasticities. Journal of Travel Research, 54(5), 611–633. doi: 10.1177/0047287514528283
- Perles-Ribes, J. F., Ramón-Rodríguez, A. B., Sevilla-Jiménez, M., & Rubia, A. (2016). The effects of economic crises on tourism success: An integrated model. Tourism Economics, 22(2), 417–447. doi: 10.5367/te.2014.0428
- Prebensen, N. K. (2007). Exploring tourists’ images of a distant destination. Tourism Management, 28(3), 747–756. doi: 10.1016/j.tourman.2006.05.005
- Røkenes, A. (2007). Price differences at European restaurants and possible implications for tourism. Scandinavian Journal of Hospitality and Tourism, 7(2), 81–103. doi: 10.1080/15022250701374426
- Sandvik, K., Enger, A., & Iversen, E. K. (2015). Developing scenarios for the Norwegian travel industry 2025. Journal of Tourism Futures, 1(1), 6–18. doi: 10.1108/JTF-12-2014-0018
- Smeral, E. (2003). A structural view of tourism growth. Tourism Economics, 9(1), 77–93. doi: 10.5367/000000003101298286
- Smeral, E. (2010). Impacts of the world recession and economic crisis on tourism: Forecasts and potential risks. Journal of Travel Research, 49(1), 31–38. doi: 10.1177/0047287509353192
- Song, H., & Witt, S. (2000). Tourism demand modelling and forecasting: Modern econometric Approaches. Oxford, UK: Elsevier Science.
- Statistics Norway. (2019). Retrieved from https://www.ssb.no/.
- Torvik, R. (2001). Learning by doing and the Dutch disease. European Economic Review, 45(2), 285–306. doi: 10.1016/S0014-2921(99)00071-9
- Tveteras, S., & Roll, K. H. (2014). Non-stop flights and tourist arrivals. Tourism Economics, 20(1), 5–20. doi: 10.5367/te.2013.0263
- The U.S. Energy Information Administration (EIA). (2019). Retrieved from https://www.eia.gov.
- The World Bank. (2019). Retrieved from https://www.worldbank.org/.
- Yap, G., & Saha, S. (2013). Do political instability, terrorism, and corruption have deterring effects on tourism development even in the presence of UNESCO heritage? A cross-country panel estimate. Tourism Analysis, 18(5), 587–599. doi: 10.3727/108354213X13782245307911