
 ?Mathematical formulae have been encoded as MathML and are displayed in this HTML version using MathJax in order to improve their display. Uncheck the box to turn MathJax off. This feature requires Javascript. Click on a formula to zoom.
ABSTRACT
Asia, particularly China, has become an attractive market that receives much attention in the Norwegian tourism industry. This raises relevant questions about the sustainability of the Chinese tourism boom. If the Norwegian tourism industry increasingly targets this rapidly growing market with larger investments, it should respond to the prospects of long-term growth. Such prospects hinge on the economic drivers behind the influx of Chinese tourists. In this study, we use both descriptive data analysis and the ARDL model to investigate the main economic factors that drive Chinese tourists to Norway. Specifically, we investigate whether the boom of the Chinese tourists is a relatively stable trend associated with the growing Chinese economy or just a short-term phenomenon brought by the weakened NOK. Our findings suggest instead of the well-recognized Chinese economic growth, it is the improving price competitiveness of Norway resulting from the weakening Norwegian kroner that has made the boom of the Chinese tourists in Norway. This result suggests although the income effect is significant in affecting aggregate tourist flow from a source country, for a single destination, price competitiveness is the key to make a destination attractive since the substitution effects of other destinations are huge and the income effect becomes uncertain.
Introduction
The rapid growth of Asian tourist arrivals, particularly from China, has converted Asia to an attractive market for the Norwegian tourism industry. In Norway, the number of hotel guest nights of Asian tourists has more than doubled between 2005 and 2018. By contrast, the conventional key European markets, including Germany, Sweden, the UK, and Denmark have been stagnant (Statistics Norway, Citation2019). China is the key market for the Norwegian tourism industry as it accounts for 40% of the Asian guest nights in Norwegian hotels in 2018, followed by Koreans and Japanese with 10% each. The hotel guest nights by the Chinese tourists increased by around seven times between 2005 and 2018. In comparison, the number of hotel guest nights by the Japanese tourists, which used to be the largest Asian market for the Norwegian tourism industry, decreased by 19% during the same period.
Due to these changing trends in inbound tourism, China has become the largest Asian market and in 2018 accounted for 6% of the Norwegian tourism market. This raises relevant questions about the sustainability of the Chinese tourism boom. For example, if the Norwegian tourism industry increasingly targets this rapidly growing Asian market with larger investments, it should respond to the prospects of long-term growth. Such prospects hinge on the economic drivers behind the influx of Chinese tourists.
Importantly, China’s economy has grown for more than two consecutive decades, but the significant growth of the Chinese tourist arrivals to Norway first commenced at the outset of 2013 and really grew in 2014. This phenomenon corresponds to the global oil price collapse and subsequent weakening of the local currency, Norwegian kroner. A weaker currency makes it more attractive for international tourists to travel to the destination (Xie & Tveterås, Citation2020) and spend more money in the destination (Larsen & Wolff, Citation2019). We, therefore, suspect that the improved Norwegian price competitiveness resulting from the weaker local currency has been the main driving force for the boom in Chinese tourists visiting Norway.
The main objective of this study is to investigate to what degree economic factors have been driving the boom of Chinese tourists visiting Norway. Specifically, we investigate the role that China’s economic growth and changes in the relative prices of visiting Norway have played in attracting more tourists to Norway. To investigate these relationships, we use descriptive statistics and an econometric Autoregressive distributed lag (ARDL) model. The term “autoregressive” means the lag effects of the explanatory variables have been considered in the model since it is well documented that economic variables, such as income and prices, have lag effects on consumer’s demand (Cheng, Citation2012).
In the descriptive statistics, we first investigate the change in the relative price competitiveness of Norway compared to China by the following changes to the exchange rate. This is because the exchange rate changes normally account for the majority of variation in relative prices between the two countries (Aalen, Iversen, & Jakobsen, Citation2019). Next, we try to identify how the relative price competitiveness and the Chinese GDP affect the number of Chinese hotel guest nights in Norway, respectively. In the ARDL model, we estimate the long-term income elasticity and price elasticity for the Chinese tourists to Norway. The magnitudes of these two elasticities measure the importance of economic growth and price competitiveness.
To investigate the puzzle of why Chinese tourist arrivals grew more rapidly than other markets when, in fact, the Norwegian kroner depreciated against the majority of currencies in the world, we have also included tourist arrivals from Japan and Germany in the analysis. Japan is the second-largest source market in Asia for the Norwegian tourism industry. Germany is the biggest market for the Norwegian tourism in the Euro zone, accounting for 11% of the Norwegian inbound tourist hotel overnight stays. We suspect the growth in the tourist numbers from a source country is highly related to the depreciation of local currency against the currency of the source country. In our case study of the Norwegian tourism industry, the local currency (NOK) has depreciated even more against the Chinese currency (CNY) than other currencies. In other words, although the price competitiveness of Norway as a destination country has overall improved, it has been most favorable for the Chinese tourists.
This study makes two key contributions. First, the research result is important to answer the question whether the boom of Chinese tourists is a relatively stable trend associated with the growing Chinese economy or just a short-term phenomenon brought by the weakened NOK. Second, income and price elasticities of international tourism demand reveal tourists’ economic reactions and preferences toward a destination. Therefore, such information is important for the local tourism industry in destination development planning and the design of marketing strategies (Peng, Haiyan, Crouch, & Witt, Citation2015).
The remaining sections of this paper are organized as follows. First, we have a background and literature review section where we discuss the key economic and non-economic variables that influence Chinese demand for international tourism. Then we present the variables and data sources used in both the descriptive statistical analysis and econometric modeling, followed by the research methods and corresponding results. The paper concludes with a summary of the main findings.
Background and literature review
According to the official definition given by China Tourism Academy (Citation2014), Chinese outbound tourism refers to the outbound travel made from Mainland China only. For example, trips taken from Mainland China to Hong Kong and/or Macau are considered as Chinese outbound travel. World Tourism Organization (UNWTO, Citation2018) reported that China continued to lead global outbound travel in 2018 with $258 billion expenditure on international tourism. This corresponds to almost one-fifth of the world’s total tourism spending. Nine of the top 10 outbound travel destinations for Chinese tourists are within Asia including Hong Kong, Macau, South Korea, Thailand, Taiwan, Japan, Vietnam, Malaysia, and Singapore indicating the tendency of Chinese tourists to visit neighboring countries (Jin & Wang, Citation2016). EU and USA are the two most popular destinations for Chinese tourists’ long-haul journeys (UNWTO, Citation2018).
Earlier studies have documented the social and economic factors that have stimulated the continuous and significant growth of the China outbound travel. The political liberalization and social tolerance for diversified sociocultural values (Cai, Li, & Knutson, Citation2008), coupled with the visa-issuing procedure for Chinese citizen, have significantly eased Chinese outbound travel (Wang & Davidson, Citation2010). It is evident that increasing disposal income levels resulting from the economic boom in China have stimulated many Chinese to travel abroad during the last couple of decades (Lin, Liu, & Song, Citation2015).
Income and price are the fundamental elements of the economic theory of demand. According to the meta-analyses of tourism demand (Crouch, Citation1994; Song & Witt, Citation2000; Peng et al., Citation2015), income and price have been suggested as the leading variables in explaining demand for international tourism and thoroughly demonstrated empirically by a large number of studies that have been carried out over the past three decades. Compared to the traditional lucrative tourist markets (e.g. Germany, France, Japan, Nordic countries, the UK, the USA), China is characterized by having a relatively low-average GDP per capita, but a high economic growth rate. This economic profile will often be associated with more rapid growth in outbound travels of people in the country since it implies that an increasing share of people reach a purchasing power level that allows them to travel abroad. This view is supported by Lin et al. (Citation2015) that estimated an income elasticity close to two for Chinese outbound travel. The large income elasticity implies that outbound travel in China is a luxury good and it responds strongly to income growth.
However, when estimating Chinese tourist demand for a small destination like Norway, the income effect may be swamped by other considerations. Although income is certainly important to explain outbound travel decisions, the residual demand from Chinese travelers facing a small and long-haul destination like Norway will additionally hinge on factors like relative prices (Lim, Citation1997) and other potential attractors. For example, Tveteras and Roll (Citation2014) show that good air connectivity is important to attract long-haul tourists. In terms of air connectivity with China, Norway should be fairly well off at least when compared to other small destinations in Europe. Lian and Denstadli (Citation2010) find the reduced airfares and the advent of low-cost carriers are important factors driving international tourists to Norway.
In particular, price competitiveness is regarded as a key determinant of tourist destination choice (Dwyer, Forsyth, & Rao, Citation2000). To have a competitive price level is important for a successful tourist destination (Assaf & Josiassen, Citation2012 ; Culiuc, Citation2014; Dwyer et al., Citation2000). Since international tourists measure their real costs in their own currencies rather than that of destination, price competitiveness is influenced by exchange rate fluctuations (Dwyer et al., Citation2000; Dwyer & Kim, Citation2003; Aalen et al., Citation2019). Earlier studies have found the price elasticity of inbound tourism demand tends to be slightly above unity (Peng et al., Citation2015). This implies a 10% strengthening of a destination’s currency reduces inbound tourism demand by more than 10%. Due to lower-income, tourists from developing countries are more price-sensitive than tourists from developed countries. For the same reason, one would expect that changes in the exchange rate and prices at a destination can greatly influence outbound tourists from developing countries. Six studies have reviewed Chinese outbound tourism research (Keating & Kriz, Citation2008; Cai et al., Citation2008; Tse, Citation2015; Keating, Huang, Kriz, & Heung, Citation2015; Law, Sun, Fong, Fong, & Fu, Citation2016; Jin & Wang, Citation2016).
As discussed in the review paper of Jin and Wang (Citation2016) on Chinese outbound travel, the literature covers the geographical expansion of outbound travel commencing with Hong Kong and Macau, then to neighboring Asian countries and Oceania, and further extended to other long-haul destinations. Hong Kong, Australia, the United States, Taiwan, Macau, and South Korea are the primary destinations of Chinese outbound travel that have been subject to studies. Although Europe is the most popular long-haul outbound destination for Chinese tourists, it has been little studied.
Most of the studies focus on themes such as travel motivation, destination choice, trade barriers and market overviews. Jin and Wang (Citation2016) have thoroughly reviewed and summarized the main findings in these research areas. Food and accommodation are found to be the main considerations for Chinese outbound tourists. Cleanliness, safety, and value for money are important factors for destination choice (Li, Lai, Harrill, Kline, & Wang, Citation2011). Some of the main barriers to Chinese outbound travel include language barriers, culture, information, media warnings, and visa regulations (Sparks & Pan, Citation2009; Li, Zhang, Mao, & Deng, Citation2011; Wu, Citation2015). Among the destinations, the USA has more positive image compared to its competitors (Li, Cheng, Kim, & Li, Citation2015). Jin and Wang (Citation2016) suggest the demand for Chinese tourists has been diversifying and the Chinese market is becoming increasingly sophisticated and experience-seeking.
There are 161 studies between 2000 and 2014 published in top-ranked journals reviewed by Jin and Wang (Citation2016). Among them, 50 articles in the field of psychology, 42 in marketing, 27 in business management, and only 7 in economics. This distribution of studies across fields indicates that even if economic factors are the engine of Chinese outbound tourism, the economic analysis of Chinese demand for outbound travel is under-researched. Recently, Lin et al. (Citation2015) examined the demand for outbound tourism by Chinese tourists to 11 international destinations. They further suggest this should as a new research direction, as this study aims to do.
Variables
For international tourism, price is a complex construct including the cost of the transportation to a destination, the costs of hotel overnight stays, the costs of other goods and services purchased at a destination. In an earlier review study on international tourism demand given by Crouch (Citation1992), Consumer Price Indices (CPI) were found to be most expedient based on the argument that the mix of goods and services consumed by tourists is not too different from the mix constituting CPI.
Furthermore, the relative CPI between origin and destination is preferred over the absolute price of a destination in the tourism demand literature since the relative price captures the tourist cost of living in destination relative to origin (Lim, Citation1997; Khalik Salman, Arnesson, Sörensson, & Shukur, Citation2010; Kronenberg, Fuchs, Salman, Lexhagen, & Hopken, Citation2016); this implies that an alternative to visiting a destination is to stay home. The demand literature has also suggested the importance of exchange rates in adjusting the relative price (Crouch, Citation1992; Peng et al., Citation2015). Based on the above analysis, we formulate price by the following the notation used in Lim (Citation1997) as(1)
(1) where
is the relative price variable in destination i in period t;
is the Consumer Price Index in destination i in period t;
is the Consumer Price Index in origin j in period t; and
is the exchange rate between currencies of origin j and destination i in period t, presented by currency j/currency i.
Seetaram, Forsyth, and Dwyer (Citation2016) argue for an alternative price index, the price competitiveness index (PCI), instead of the relative price that traditionally has been used in this type of modeling. Their main argumentsFootnote1 are two: first, the relative price measures the relative price between the source country and destination country, not relative prices between the different destinations. Thus, competition between destinations is not considered. Second, since the relative price is adjusted by exchange rates and exchange rates could be related to the country’s economy, income variable and price variable are thus dependent. This latter argument is largely irrelevant in our case, since the exchange rates of the Chinese yuan, Euro, and Japanese yuan with the Norwegian kroner are unlikely to influence the income in China, Germany, or Japan due to relative size differences of respective economies compared to Norway’s economy.
With respect to the first argument, it serves to mention that the relative price is still a workhorse in tourism demand modeling and has been reaffirmed by Dogru, Sirakaya-Turk, and Crouch (Citation2017). In particular, in our study, the limitations of using the relative prices discussed above are less of a problem. Cost of living in Norway is consistently higher than many other countries in the world before and after the boom of the Chinese tourists to Norway. As discussed in our study, our hypothesis for the reason why more Chinese tourists visit Norway is not because Norway becomes more price-competitive than other destinations, it is because price competitiveness of Norway has been improved following the weakening of the NOK. Consequently, in the study, the change in relative prices is more important than the comparison of price competitiveness between alternative destinations in determining tourists to visit Norway. This is consistent with the discussion by Seetaram et al. (Citation2016), the use of the relative price (real exchange rate in their study) implies that “potential travelers react to changes in the price rather than the actual price level at the destination (page 68)”.
In this study, i = Norway and j = China, Japan, or Germany. A decline in the relative price means purchases in the destination, Norway, becomes more affordable for the tourists from source country j (Lim, Citation1997). In other words, a reduction in the relative price improves price competitiveness of Norway as a tourist destination. As suggested by the formula, an improvement in price competitiveness can be due to two elements. It could be due to lower inflation rate in Norway compared to an origin (e.g. China), implying a reduction in ratio. Alternatively, it could be caused by a depreciation of NOK against the currency of an origin (e.g. CNY), meaning a decline in
. As noted by Witt and Witt (Citation1995), changes in the relative price are more often caused by exchange rate changes than changes in the inflation rate.
Compared to the relative price, the measurement of income is more straightforward as it is measured by the gross domestic production (GDP) of the tourists’ source country. Tourism demand is measured by the number of hotel overnight stays, reflecting both the number of arrivals and the length of stay at a destination.
Data and methods
The consumer price index (CPI) and Gross Domestic Product (GDP) of the source countries were obtained from the World Bank. Exchange rates were provided by the Norges Bank, the central bank of Norway. The data on hotel overnight stays were obtained from Statistics Norway (SSB). In the dataset, it is not possible to identify the tourists’ travel purpose by source market. However, we expect that the majority of the Chinese and Japanese tourists are leisure tourists. Moreover, there is a relatively small share of business travelers from Germany. Thus, the majority of guest nights from these three markets are leisure tourists. All the data are monthly except for the GDP that is quarterly. Since only quarterly GDP data are available, we have aggregated the other data to quarterly by taking average values in each quarter. The sample period is between quarter one 2005 and quarter 2018.
In the study, we first use figures to illustrate the change in the price competitiveness of the destination country, Norway. The figures make it easy to discern differences in exchange rates, inflation rates and income between the source markets compared to Norway. However, figures only show differences, but cannot precisely measure the effect of price and GDP and sometimes they mislead when the effect of other variables is not taken into account. For example, when the positive correlation between the Chinese GDP and the Chinese tourist arrivals to Norway is shown in a figure, we may conclude that GDP is driving the growth in the tourism demand. However, this conclusion can be wrong, since the possibility exists that GDP has a limited effect and instead the growing demand is caused by the lower prices of traveling to Norway. Therefore, we also apply econometric modeling to be able to isolate one effect from another by estimating the corresponding elasticities. Elasticity is a popular measure in economics because it gives a unit-free measure on-demand responsiveness. This makes it easy to compare the relative magnitude of income and price changes. Specifically, the elasticity shows how much demand changes in percentages where either price or GDP increases by 1%.
In multivariate time series models, the property of data series generating processes determines the choice of econometric approach. The Augmented Dickey-Fuller (ADF) test is used to determine if the variables used in the models are stationary or non-stationary, i.e. I(0) or I(1). In the ARDL model proposed by Pesaran, Shin, and Smith (Citation2001), it does not matter whether the underlying regressors are I(1) or I(0). We can, therefore, proceed to apply the model without having to determine if the variables are stationary or not. This is the model that is utilized to examine the long-run relationship between tourism demand, income level, and cost of staying.
Following Pesaran et al. (Citation2001), the ARDL model is outlined by Equation (2):(2)
(2)
i = China, Japan, and Germany where
stands for the difference operator, log represents natural logarithm. For the variables,
denotes the number of overnights of the tourists from country i (indexing China, Japan, and Germany, respectively) in time t (quarter).
is the gross domestic product of the source country i,
is the consumer price index of Norway relative to source country i and used as a proxy for the cost of visiting Norway, as defined in Equation (1). As discussed earlier, tourism demand is affected by income, the price competitiveness of the destination country relative to the source country.
In Equation (2), the first differenced variables associated with the difference operator capture the short-run income and price elasticities (less than one year). The short-term coefficients do not have structural interpretations. The lag variables identify the long-run relationships between overnight days, GDP, and RP, and our main focus will be on the estimated parameters
,
, and
.
The reminding variables in Equation (2), include the seasonal dummies (summer, autumn, and winter, with spring being the base) to catch the seasonal pattern of the tourists from China, Japan, and Germany. As reflected in , tourism in Norway is seasonal with summer as the peak season in a year. The seasonal pattern is determined by non-economic factors like holidays and climate, which is why seasonal dummies are included.
is a normal error term in a standard econometric model to account for other stochastic factors that might affect the dependent variable (tourism demand in this study) but have not been specified as explanatory variables in a model.
We estimate Equation (2) using quarterly data from 2005 to 2018. Considering the degrees of freedom and the frequency of data used, we impose two lags on each first differenced variable. The estimated results are overall satisfactory with high R squares. The Bound test results show that we fail to reject the null hypothesis for Japan, China, and Germany, indicating there is a cointegration relationship among the variables. Furthermore, it means there exists a long-run relationship between tourism demand, income level, and travel cost.
Results
Descriptive statistical analysis
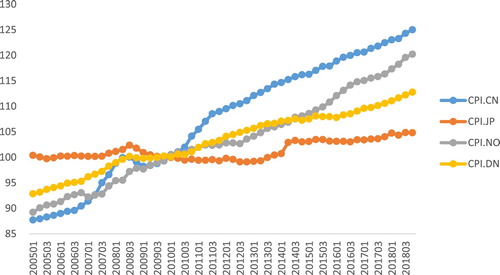
As illustrated by Equation (1) in the section of variables, price includes two factors, the changes in the CPI of the source countries relative to the CPI of the destination, and the changes in exchange rates of NOK against the currencies of source countries. presents the CPI of the three source countries, i.e. China, Japan, Germany, and the destination, Norway. It shows that, in our sample period between 2005 and 2018, the inflation rate growth in China was the highest, followed by Norway, Germany, and Japan. The growth rates in CPI were 36, 5, 18, and 29 percentage points, respectively. Since relative CPI development suggests changes in the overall price level in the tourists’ source country compared to a destination, we have further calculated the CPI of Norway relative to China, Japan, and Germany . The analysis suggests during the sample period, respective to the Norwegian price level, price increased by 6% in China, decreased by 26% and 10% in Japan and Germany, respectively. Furthermore, it means if we just look at the CPIs, taking a holiday in Norway became 6% cheaper for the Chinese tourists, 26% more expensive for the Japanese tourists, and 10% more expensive for the German tourists in 2018 than in 2005. This provides a clue why the number of tourists from China grew, while tourists from Japan and Germany either declined or remained stagnant.
Figure 1. Consumer Price Index (CPI) in Norway and Source Countries.
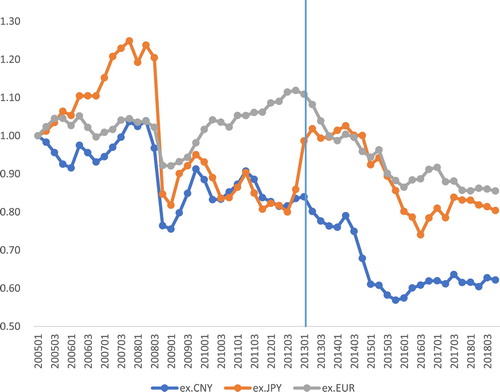
In the literature, the exchange rate is suggested to be important for adjusting relative price levels in source and origin countries, as can be seen from Equation (1) (Lim, Citation1997). Therefore, we further investigate the change in NOK value respective to the currencies of the source countries, which is presented by . To make the currencies easier to compare, we have standardized the exchange rates and converted them to indexes. Since the exchange rate is measured by the value of foreign currency for one NOK, the downward trends imply that NOK depreciates, i.e. becomes weaker. Except for a shock caused by the financial crisis that weakened the NOK, shows that before the oil price crisis in late 2013, the exchange rates did not have any clear long-term trends. An exception is that the NOK exhibited a downward trend against CNY, but this trend was not strong. However, after the oil price crisis, there is a significant weakening of NOK against all three currencies. In fact, NOK depreciated by 22%, 18%, and 19% against CNY, JPY, and euro, respectively, in this late period. The strongest depreciation of NOK against CNY was from 2013 to 2016 with a 25% drop. It has slightly strengthened in the last two years. The depreciation of NOK has made Norway more affordable, thereby improving the destination’s price competitiveness. Considering that Norway had among the highest cost of living worldwide prior to 2014 (CitationNumbeo.com), this change in price competitiveness is relevant for tourism.
Figure 2. Depreciation of the Norwegian Kroner after the collapse of oil price.
The above analysis suggests both the CPI and the exchange rate changes should have a positive effect on the Chinese tourist demand. The increasing price level in China and the depreciation of NOK have jointly made visiting Norway cheaper and boosted the tourist arrivals from China to Norway. In contrast, the effects of CPI and the exchange rates on the Japanese and German demands are mixed. The price levels in Japan and Germany have decreased relative to Norway, making Norway a more expensive destination than before for outbound tourists in these two countries, while the weak NOK has adjusted the Norwegian price downwards. To see the joint effects of CPI and exchange rate on the Norwegian price competitiveness, we used Equation (1) and calculated the exchange rate-adjusted relative CPI. The computed results show the Norwegian price competitiveness increased by 21%, 12%, and 13% respectively compared to the source country of tourists from China, Japan, and Germany between 2013 and 2018. In other words, traveling to Norway in 2018 is 21% cheaper for Chinese tourists, 12% for the Japanese tourists, and 13% cheaper for the German tourists compared to that in 2013. For Chinese tourists, this not only implies that Norway has become one-fifth less expensive, it also implies Norway has become relatively more competitive than Germany and likely the other European destinations where Euro is the currency used.
shows the relationships between the exchange rates and the overnight stays given by visitors from China, Japan, and Germany, respectively. The negative relationships between the exchange rates and the overnight stays of holiday visitors suggest the weak NOK attracts more tourists to Norway. This link between inbound tourism and the local currency has never been so obvious until the NOK drastically depreciated as a direct result of the oil price collapse. A clear result is that the comparative price advantage of Norwegian tourism is improved due to the weak NOK. Similar conclusion is also given by the Innovation Norway, a Norwegian organization to promote Norwegian tourism. In its annual report (Innovation Norway, Citation2016), it states the comparative advantage of the Norwegian tourism industry has been improved since 2014.
Figure 3. Hotel overnight stay and exchange rate.
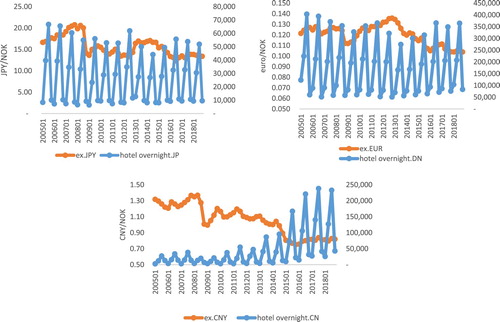
further suggests among the three countries, the NOK depreciated most against the CNY and the overnight stays given by the Chinese tourists increased most at the same time. The significant contribution of the weak NOK to the growing Chinese tourist arrivals is apparent. In conjunction with the 25% appreciation of the CNY against NOK from 2012 to 2018, the Chinese tourists’ overnight stays in Norwegian hotels increased by more than 4 times.
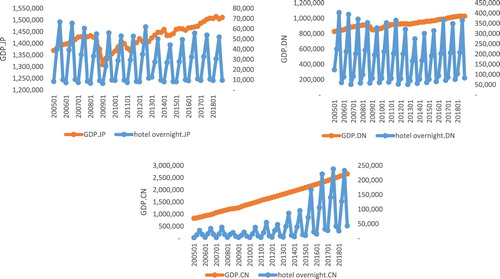
presents the GDPs of the three sources countries that proxy income levels of the tourists from these countries. Both the Japanese and German GDP have steadily increased since 2009. The income growth has been stronger for Japan than Germany. However, the tourism demand from these two countries has either decreased or stagnated except for the most recent years when there is a slight upward trend. We suspect this is linked to the weak NOK. There is a positive association between the Chinese GDP and their overnight stays in Norway. However, the economic growth in China is consistent over the entire data period as shown in the figure, but the strong growth in inbound tourism from China to Norway is a recent phenomenon. Furthermore, compared to the exchange rate, the relationship between the GDP and the volume of hotel overnight stays is less obvious.
Figure 4. Hotel overnight stay and GDP.
As we have discussed, the figures provide clues to the changes in inbound tourism from the three source market linked to GDP, CPI, and the exchange rates that mostly appear consistent with demand theory. However, the precise effect of the three factors on the hotel overnight stays cannot be answered by visual inspection alone. Therefore, we used the ARDL model to further measure the effect of each factor on the tourist demand.
Econometric model
presents the estimated results of the ADRL model. The estimated coefficients of the first differenced variables of GDP and RP capture the short-run income and price effects. Although the short-term coefficients do not have structural interpretations, the estimated result of that most of these coefficients are not statistically significant at 10% critical level indicates that tourists from China, Japan, and Germany do not adjust their travels immediately to changes in relative prices and incomes in a short time. This is consistent with the findings in the literature (e.g. Kulendran, Citation1996). For a long-haul international journey, many tourists make their travel plans months ahead of departures. It is difficult for tourists to adjust their plans according to price changes once decisions have been already made, which might involve more than one person. The estimated results of all the lag-dependent variables are significant at 5% critical level in the Chinese and German equations, which suggests the relevance of “word of mouth” effect. The larger magnitudes of the coefficients in the Chinese equation suggest compared to the German tourists, the Chinese tourists are more dependent on other tourists who have already visited Norway in obtaining information. This is in line with Chinese culture (Cheung, Anitsal, & Anitsal, Citation2007). None of the estimated coefficients of the lag-dependent variables in the Japanese equation is significant at 10% critical level. This result reflects the fact that Japan is a mature but stagnant market for the Norwegian tourism.
Table 1. Estimation results of the ARDL model by the source country.
The long-run relationship between economic determinants and tourism demand is the key interest of this study. The long-run elasticities of income and price are computed by and
, respectively. None of the parameters of GDP
is statistically significant at a high critical level of 25% in the three source equations. This means none of the income elasticities is significant and income has no effect on the tourism demand in the estimated models. However, this does not mean that income is not a determinant of tourism demand. Rather, it reflects that the changes in income during the data period have been too small to cause changes in the overall tourism demand from the three respective countries.
The estimated parameters of the price are significant at 5% critical level or even lower in the three equations, suggesting that changes in price competitiveness have influenced tourist arrivals to the destination. As discussed earlier, price competitiveness is defined by the exchange rate-adjusted relative price of destination (Norway) against a source country (China, Japan, and Germany). The negative sign of price is consistent with the law of demand, implying that when price level decreases in Norway relative to the source countries, it causes inbound tourism demand from the source countries to increase. The estimated price elasticities using formula
are −6.521 for China, −0.414 for Japan, −1.480 for Germany, suggesting the Chinese tourists are most sensitive to the price change in Norway, or in other words to the change in travel costs to Norway, followed by the German tourists and Japanese tourists. Specifically, when the relative prices of Norway against China, Germany, or Japan decrease by 1%, the tourism demands for Norwegian tourism from these three source countries increase by 6.521%, 1.481%, and 0.414%, respectively.
Discussion and conclusion
The results of both the descriptive analysis and the ADRL model show that changes in price competitiveness for Norway is the key factor to explain relative changes in tourist demand from key markets, especially for attracting more visitors from China. In other words, the main driving force behind the boom of the Chinese tourists in Norway is the improved price competitiveness of Norway as a tourist destination. The improved price competitiveness has mainly been a result of the depreciation of the Norwegian currency (NOK) caused by the oil price collapse in 2014, but also due to the growing inflation rate in China. In sum, these two effects have led to lower relative prices in Norway against China during more recent years. The improved price competitiveness means the cost of taking a holiday in Norway has become less expensive for Chinese tourists.
The extreme price sensitivity of inbound tourism demand from China likely reflects that the relative price has reduced sufficiently to reach a tipping point. The large magnitude of the estimated price elasticity for China also suggests that other factors could be at play. For example, this could be that Chinese tour operators have redirected efforts to the destination market of Norway, encouraged by the destination having become more affordable. In other words, the improved relative prices do not only affect demand, but also the deployment of resources of those who market destinations of tourists and tour packages in China.
While GDP growth surely is important to explain the overall growth in outbound travel from China, the results from our model show that the economic growth is not the main trigger behind the tourism boom in Norway. Rather, it is the changes in relative price. Although traveling to Norway is still expensive for the Chinese tourists, it has become more affordable in recent years.
Relative to the Japanese and German tourists, Chinese tourists are much more price-sensitive. This is expected since income per capita in China is still lower than many developed countries despite China is the second-largest economy in the world. Due to the income effect that comes into play through sizeable travel budgets, people with lower incomes are normally more price-sensitive than those having high incomes. This can explain why outbound tourism to Norway from China is firmly in the luxury product category. The higher price sensitivity of the Chinese tourists than the Japanese and German tourists and the relatively larger change in the relative price for China explain the significant growth in tourist number from China, while the growth of the Japanese tourists has either decreased or remained stagnant.
It is misleading to think that the growth of China’s economy is responsible for the recent boom of Chinese visitors to Norway, even if it over time has stimulated more Chinese to travel abroad. Thus, it is more appropriate to view economic growth as a precondition for the Chinese tourism boom in Norway, rather than the main engine. For a small destination like Norway, inbound demand from a faraway market like China can be fickle. A change in relative prices can have drastic consequences. Therefore, the worry among Norwegian destination managers that the Chinese boom can be unsustainable has some justification, because an appreciation of the NOK could lead to a reversal in the good fortunes. For example, if the recovery of the oil price to previous levels strengthens the NOK, the Chinese tourists might find other destinations more attractive than Norway.
It is also possible that when the income per capita in China grows to a similar level as that in Japan and Germany, the price sensitiveness of the Chinese tourists declines. However, since Norway is a faraway destination for Chinese, implying high travel costs, this suggests that inbound tourism demand to Norway from Chinese tourists will remain more price-sensitive than, say, Germans that have much lower travel costs.
To conclude, the three elements including the high price sensitivity of the Chinese tourists, the significant depreciation of the NOK against CNY, and the increasing living costs in China have jointly improved the price competitiveness of Norway. This implies that the future trends of Chinese tourist arrivals to Norway will be highly dependent on relative price development. The estimated income and price elasticities are important for the Norwegian tourism industry in destination development planning and the design of marketing strategies.
The limitations of this study are mainly two. First, as criticized by Seetaram et al. (Citation2016), no cross-price effects of other destinations are considered in using relative price (PR) as price variable in our study. Chinese tourists are likely to choose among several destinations in decisions. Therefore, substitution effects between destinations are relevant. Second, we have not looked at other factors than the key economic ones. In an economy as large as China, there can be several trends and factors that can influence a relatively small destination like Norway. Thus, a more detailed case study of the determinants of Chinese tourists travel decisions to Nordic countries would be relevant.
A final consideration is South Korea, which is another important growing market that accounts for 10% of the Asian market in Norway in 2018. Similar to China, South Korea has a significant emerging middle class who are eager to adventure the world. Therefore, it could be fruitful to have a further study to compare tourism demand by the Chinese tourists and Korean tourists in the destination of Norway.
Disclosure statement
No potential conflict of interest was reported by the author(s).
Notes
1 In Seetaram et al. (Citation2016), the relative price is named as real exchange rate (REX) since it can also be considered as CPI-adjusted exchange rate.
Related Research Data
References
- Aalen, P., Iversen, E. K., & Jakobsen, E. W. (2019). Exchange rate fluctuations and demand for hotel accommodation: Panel data evidence from Norway. Scandinavian Journal of Hospitality and Tourism, 19(2), 210–225. doi:10.1080/15022250.2018.1482566.
- Assaf, A. G., & Josiassen, A. (2012). Identifying and ranking the determinants of tourism performance: A global investigation. Journal of Travel Research, 51(4), 388–399. doi:10.1080/10507050802096778.
- Cai, L. A., Li, M., & Knutson, B. J. (2008). Research on China outbound market: A meta-review. Journal of Hospitality and Leisure Marketing, 16(1–2), 5–20. doi:10.1080/10507050802096778.
- Cheng, K. M. (2012). Tourism demand in Hong Kong: Income, prices, and visa restrictions. Current Issues in Tourism, 15(3), 167–118. doi:10.1080/13683500.2011.569011.
- Cheung, M.-S., Anitsal, M. M., & Anitsal, I. (2007). Revisiting word-of-mouth communications: A cross-national exploration. Journal of Marketing Theory and Practice, 15(3), 235–249. doi:10.2753/MTP1069-6679150304.
- China Tourism Academy (CTA). (2014). Annual report of China outbound tourism development 2014. Beijing: China Tourism Academy.
- Crouch, G. I. (1992). Effect of income and price on international tourism. Annals of Tourism Research, 19(4), 643–664. doi:10.1016/0160-7383(92)90059-X.
- Crouch, G. I. (1994). The study of international tourism demand: A review of findings. Journal of Travel Research, 33, 12–23. doi:10.1177/004728759403300102.
- Culiuc, A. (2014). Determinants of international tourism. In. International Monetary Fund IMF Working paper. https://www.imf.org/external/pubs/ft/wp/2014/wp1482.pdf
- Dogru, T., Sirakaya-Turk, E., & Crouch, G. I. (2017). Remodeling international tourism demand: Old theory and new evidence. Tourism Management, 60, 47–55. doi:10.1016/j.tourman.2016.11.010.
- Dwyer, L., Forsyth, P., & Rao, P. (2000). The price competitiveness of travel and tourism: A comparison of 19 destinations. Tourism Management, 21(1), 9–22. doi:10.1016/S0261-5177(99)00081-3.
- Dwyer, L., & Kim, C. (2003). Destination competitiveness: Determinants and indicators. Current Issues in Tourism, 6(5), 369–414. doi:10.1080/13683500308667962.
- Innovation Norway. (2016). Key figures for Norwegian travel and tourism 2016. https://res.cloudinary.com/, last accessed August 4, 2019
- Jin, X., & Wang, Y. (2016). Chinese outbound tourism research: A review. Journal of Travel Research, 55(4), 440–453. doi:10.1016/j.tourman.2016.11.010.
- Keating, B. W., Huang, S., Kriz, A., & Heung, V. (2015). A systematic review of the Chinese outbound tourism literature: 1983–2012. Journal of Travel & Tourism Marketing, 32(1–2), 2–17. doi:10.1080/10548408.2014.986009.
- Keating, B., & Kriz, A. (2008). Outbound tourism from China: Literature review and research agenda. Journal of Hospitality and Tourism Management, 15(1), 32–41. doi:10.1375/jhtm.15.1.32.
- Khalik Salman, A., Arnesson, L., Sörensson, A., & & Shukur, G. (2010). Estimating international tourism demand for selected regions in Sweden and Norway with iterative seemingly unrelated regressions (ISUR). Scandinavian Journal of Hospitality and Tourism, 10(4), 395–410. doi:10.1080/15022250.2019.1695659.
- Kronenberg, K., Fuchs, M., Salman, K., Lexhagen, M., & Höpken, W. (2016). Economic effects of advertising expenditures–a Swedish destination study of international tourists. Scandinavian Journal of Hospitality and Tourism, 16(4), 352–374. doi: 10.1080/15022250.2015.1101013
- Kulendran, N. (1996). Modelling quarterly tourist flows to Australia using cointegration analysis. Tourism Economics, 2(3), 203–222. doi:10.1177/135481669600200301.
- Larsen, S., & Wolff, K. (2019). In defence of the domestic tourist-a comparison of domestic and international tourists’ revisit-intentions, word-of-mouth propensity, satisfaction and expenditures. Scandinavian Journal of Hospitality and Tourism, 19(4–5), 422–428. doi:10.1080/15022250.2019.1695659.
- Law, R., Sun, S., Fong, D. K. C., Fong, L. H. N., & Fu, H. (2016). A systematic review of China’s outbound tourism research. International Journal of Contemporary Hospitality Management, 28(12), 2654–2674. doi:10.1108/IJCHM-06-2015-0323.
- Li, X., Cheng, C.-K., Kim, H., & Li, X. (2015). Positioning USA in the Chinese outbound travel market. Journal of Hospitality & Tourism Research, 39(1), 75–104. doi:10.1177/1096348012461548.
- Li, X., Lai, C., Harrill, R., Kline, S., & Wang, L. (2011). When east meets west: An exploratory study on Chinese outbound tourists’ travel expectations. Tourism Management, 32(4), 741–749. doi:10.1016/j.tourman.2010.06.009.
- Li, M., Zhang, H., Mao, I., & Deng, C. (2011). Segmenting Chinese outbound tourists by perceived constraints. Journal of Travel & Tourism Marketing, 28(6), 629–643. doi:10.1080/10548408.2011.598747.
- Lian, J. I., & Denstadli, J. M. (2010). Booming leisure air travel to Norway–The role of airline competition. Scandinavian Journal of Hospitality and Tourism, 10(1), 1–15. doi:10.1080/15022250.2010.484215.
- Lim, C. (1997). Review of international tourism demand models. Annals of Tourism Research, 24(4), 835–849. doi:10.1016/S0160-7383(97)00049-2.
- Lin, V. S., Liu, A., & Song, H. (2015). Modeling and forecasting Chinese outbound tourism: An econometric approach. Journal of Travel & Tourism Marketing, 32(1-2), 34–49. doi:10.1080/10548408.2014.986011.
- Numbeo.com. (2018). Cost of living index. Retrived from https://www.numbeo.com/cost-of-living/ accessed by March 3, 2019
- Peng, B., Haiyan, S., Crouch, G. I., & Witt, S. F. (2015). A meta-analysis of international tourism demand elasticities. Journal of Travel Research, 54(5), 611–633. doi:10.1177/0047287514528283.
- Pesaran, H. M., Shin, Y., & Smith, R. J. (2001). Bounds testing approaches to the analysis of level relationships. Journal of Applied Econometrics, 16(3), 289–326. doi:10.1002/jae.616.
- Seetaram, N., Forsyth, P., & Dwyer, L. (2016). Measuring price elasticities of demand for outbound tourism using competitiveness indices. Annals of Tourism Research, 56, 65–79. doi:10.1016/j.annals.2015.10.004.
- Song, H., & Witt, S. (2000). Tourism demand modelling and forecasting: Modern econometric approaches. Oxford: Elsevier Science.
- Sparks, B., & Pan, G. W. (2009). Chinese outbound tourists: Understanding their attitudes, constraints and use of information sources. Tourism Management, 30(4), 483–494. doi:10.1016/j.tourman.2008.10.014.
- Statistics Norway. (2019). https://www.ssb.no/. accessed by December 5, 2019.
- Tse, T. S. M. (2015). A review of Chinese outbound tourism research and the way forward. Journal of China Tourism Research, 11(1), 1–18. doi:10.1080/19388160.2014.984798.
- Tveteras, S., & Roll, K. H. (2014). Non-stop flights and tourist arrivals. Tourism Economics, 20(1), 5–20. doi:10.5367/te.2013.0263.
- Wang, Y., & Davidson, M. C. G. (2010). Chinese holiday makers’ expenditure: Implications for marketing and management. Journal of Hospitality Marketing & Management, 19(4), 373–396. doi:10.1080/19368621003667101.
- Witt, S. F., & Witt, C. A. (1995). Forecasting tourism demand: A review of empirical research. International Journal of Forecasting, 11(3), 447–475. doi:10.1016/0169-2070(95)00591-7.
- World Tourism Organization. (2018). UNWTO tourism highlights ( 2018 edition). Madrid: UNWTO.
- Wu, M.-Y. (2015). Driving an unfamiliar vehicle in an unfamiliar country: Exploring Chinese recreational vehicle tourists’ safety concerns and coping techniques in Australia. Journal of Travel Research, 54(6), 801–813. doi:10.1177/0047287514532364.
- Xie, J., & Tveterås, S. (2020). Economic decline and the birth of a tourist nation. Scandinavian Journal of Hospitality and Tourism, 1–19. doi:10.1080/15022250.2020.1719882.