
ABSTRACT
The purpose of this paper is to showcase how Public Participation Geographic Information Systems (PPGIS) can be used to assist in collecting data of relevance for planning at a tourism destination in general and, specifically how PPGIS data can assist in the early stages of transportation planning. In this paper, we report on a PPGIS study in Sälenfjällen, the largest ski tourism destination in Sweden. Our analysis uses data from 162 visitors sampled on-site using online and paper-based questionnaires containing survey questions and mapping tasks. We use the survey and mapped results from Sälenfjällen to discuss the opportunities and challenges of using PGGIS for this planning purpose. We conclude that, despite of various challenges like low response rates and sampling issues, PPGIS provides the possibility to collect rich information in terms of survey results and mapped values. This is important in understanding a transportation challenge at the early stages of planning, namely the initiation stage. Our study adds to a growing literature exploring the use of PPGIS in the field of tourism and recreation. To the best of our knowledge, ours is the first to use this approach in a tourism-transport context in a Nordic destination.
Introduction
Planning and provision of transportation infrastructure that can cope with tourism demand is one key area for developing a sustainable destination that is attractive for visitors and increases the liveability of the local area (Prideaux, Citation2000; Rodrigue, Citation2020). Moreover, planning and managing demand for transportation are fundamental since transportation has a substantial impact not only on the tourism industry but on the environment, economy, and society at large (Hall, Citation2008, Citation2015). Thus, the provision of sustainable transportation in tourism contexts requires considering the preferences of the multiple stakeholders (e.g. residents, tourism developers, tourists, planners, etc) who demand and/or supply the transportation. Also, as Rodrigue (Citation2020) argues, to achieve sustainable transportation it is important to devise systems and strategies that can manage demand for transportation as well as redistribute this demand in space and time throughout different seasons of the year (Butler, Citation2001). Seasonality in tourism and ultimately the change in demand for transportation at many destinations affects aspects of supply behaviour including operation and planning. It is, therefore, important to understand the varying levels of demand for transportation to develop suitable strategies and plan for actions that ultimately can enhance the sustainable development of destinations (Baum & Lundtorp, Citation2001).
In addition, engaging and involving stakeholders is beneficial for planning processes in several ways. For example, it can enhance the decision-making process due to the involvement of experts and community members, lead to a better understanding of the situation at the local level, and result in better policies if effective engagement is undertaken. The process of engaging stakeholders can be effective when several critical factors are considered. These factors include, among others, transparency in the planning process, aiming to incorporate stakeholder concerns as much as possible, having a two-way communication mechanism that promotes interaction and information sharing between stakeholders, and considering stakeholder engagement as early as possible and throughout the planning process (Cascetta & Pagliara, Citation2013). Several methods of stakeholder engagement exist such as public meetings, workshops, focus group discussion (Chase et al., Citation2011), and, more recently, Public Participation Geographic Information Systems (PPGIS).
PPGIS is a method for stakeholder engagement that has seen increased use during the past 20 years following the development of computer capacity and smartphones. While it has become increasingly common in urban planning in countries like Finland (e.g. Sandtröm et al., Citation2020; Tyrväinen et al., Citation2007), Australia, USA (e.g. Brown et al., Citation2020), few examples of its use within tourism, rural and transport planning exist. Nikula et al. (Citation2020) provide one example where PPGIS has been used to collect residents’ views on land-use preferences and land-use values in a cross-border Finnish-Norwegian case involving recreational values, scenic views, and other special nature values like health and well-being. Another example is provided by Kantola et al. (Citation2018) who explore the use of PPGIS in gathering tourists’ and locals’ views about their favourite places in a Finnish tourism resort.
Our PPGIS study was initiated as part of the Interreg Baltic Sea project Mobility and Accessibility in Rural Areas (MARA) by the Swedish Transport Administration (STA) together with stakeholders sharing a similar interest to address a transportation challenge for the development of tourism in a sustainable way. Hence, in this paper, we report on collaborative research between private (destination management organisation – destination Sälenfjällen, Scandinavian Mountain Airport, tourism businesses at the destination), and public (STA, Region Dalarna, Malung-Sälen municipality) stakeholders and university researchers conducted in Sälenfjällen (Sälen Mountain), a ski destination in Sweden experiencing transportation-related challenges during different seasons of the year.
The purpose of this paper is thus to showcase how PPGIS can be used as a tool to assist in collecting data of relevance for planning at a tourism destination in general and, specifically, how PPGIS data can assist in the early stages of transportation planning. Thus, the main goal of our study is not to provide data for a planning process per se but rather to explore the potential of PPGIS for transportation planning in a tourism context. We, therefore, discuss the data collected given it provides empirical grounding for our main aim. Thus, at this first stage of the project, we limit our study to one stakeholder group, namely the visitors to the area. Our study adds to a growing literature exploring the use of PPGIS in the field of tourism and recreation and is, to our knowledge, the first to use it in a tourism-transport context in a Nordic destination. To note, this study is situated within the exploratory PPGIS methodological framework proposed by Fagerholm et al. (Citation2021), which focuses on data description and visualisation. The next section gives a theoretical overview of transportation planning, and PPGIS as well as a review of a few relevant empirical studies in a tourism context. This is followed by a section on case description, then materials and methods. Results and analysis come thereafter, while the paper ends with some concluding remarks.
Transportation planning
Transportation and travel can survive without tourism, but tourism cannot survive without transportation (e.g. Page, Citation2005; Page & Connell, Citation2014). Hence, the role of transport in tourism can be seen in several ways, which mainly include connectivity between origin and destination and mobility within the destination region (Duval, Citation2020; Fletcher, Citation2013). The movement of tourists from origin to destination depends mainly on three modes of transportation, which all vary in terms of travel time and cost. These include air transport, land-based modes, and water transport. Additionally, to achieve the development of destinations in a sustainable way, a tourism transport system (TTS) ought to be developed (Rodrigue, Citation2020).
Prideaux (Citation2000, p. 56), defines the TTS as “the operation of, and interaction between, transport modes, ways and terminals that support tourism resorts in terms of passenger and freight flows into and out of a destination, and the provision of connecting transport modes in the tourism generating region”. In the context of the present study, transportation planning is defined as the planning conducted as part of the wider TTS. In other words, it is the transportation planning conducted to ensure the development of tourism that includes wider societal, economic, and environmental goals in a sustainable way (Hall et al., Citation2009; Hall, Citation2008; Sharpley, Citation2008).
Transportation planning is “concerned with developing and organizing transportation infrastructure, networks, and services” (Broaddus & Cervero, Citation2019). As Broaddus and Cervero further indicate, transportation planning seeks to prepare for the future growth of the flow of people and goods and modes of transportation used. More so, there has been a shift in forecasting future travel demands partly due to rapidly changing travel patterns and an increase in vehicle flows on urban roads. The change in travel demand is influenced by the rise of new modes of transportation such as shared mobility, on-demand systems, autonomous vehicles, among others. Therefore, “there is an increased need for inter-disciplinary approaches, planning for multiple modes of transportation, integration with land use planning, and public engagement skills” (Broaddus & Cervero, Citation2019, p. 1).
Recently there has been a paradigm shift towards sustainability-conscious transportation in the US, Europe, Canada, and Australia. This paradigmatic shift has emerged in response to environmental and social concerns (Leigh et al., Citation2019). While the broad ambition is to have transport systems and policies devised in consideration of social, economic, and environmental issues, most emphasis is on the environmental aspect particularly decarbonisation in terms of reducing the ecological footprint from tourism (e.g. Peeters & Schouten, Citation2006). Therefore, the end goal is to have sustainable transportation, which implies developing transportation systems to support the mobility needs of a society with the least damage to the environment and without impairing the mobility needs of future generations (Peeters & Dubois, Citation2010).
However, planning transportation for the development of tourism in a sustainable way is not something that can be done without encountering challenges (Dredge & Jenkins, Citation2011; Hall, Citation2008). Indeed, a key challenge in this regard is that of seasonality especially since it causes the fluctuation of tourist numbers to destinations (Vergori & Arima, Citation2020). Sweden is no exception when it comes to seasonality and challenges related to the planning of transportation for the sustainable development of tourism. The Organisation for Economic Co-operation and Development (OECD) report of 2020 specifically highlights transportation, destination development, sustainability, and seasonality as among the major challenges facing tourism in Sweden.
Commonly, the UN sustainable development goals (SDGs) guide policy development in Sweden (OECD, Citation2020). As an example, the transportation planning model in Sweden is designed to facilitate the development of sustainable transportation. The main objective of the transport and infrastructure policy is to ensure the “provision of economically efficient, sustainable transport services for the public and businesses throughout the country” (Ministry of infrastructure, Sweden, Citation2020). Several national authorities work in transportation and play an active role in implementing the policy. These authorities include to name but a few, the Swedish Airports and Air Navigation Services, the Swedish Maritime Administration, and the STA (Tornberg & Odhage Citation2018).
Swedish law demands that the national authorities involve actors at the local and regional levels in transportation planning activities. In 2013, institutional reforms occurred in the Swedish national transportation planning policy where, among others, all long-term infrastructure measures to be included in future national or regional plans were to be analysed using Strategic Choice of Measures (SCM) methodology. SCM was developed by the STA, and it is “an arena for early dialogue between main actors and stakeholders at local, regional, and national levels to jointly assess transport related problems and develop solutions” (Tornberg & Odhage, Citation2018 p.416; STA, Citation2014). As illustrates, the SCM includes four phases, each of which is described in much detail by STA (Citation2014) and Tornberg and Odhage (Citation2018). Of relevance in our paper is the earliest phase of involvement, namely initiation. This is the phase where a study is initiated by actors based on available assumptions of a perceived transport problem and suggested solutions. It is also at this stage where “neutral” managers are sought, competencies and actors engaged, and the purpose of the study is defined (Tornberg & Odhage Citation2018).
Figure 1. Four phases in the Swedish strategic choice of measures (SCM) transportation planning methodology. Adapted from STA (Citation2014).

Public participation GIS and transportation planning for tourism
PPGIS is an approach used to generate spatially explicit place-based information (Heikinheimo et al., Citation2020; McCreary et al., Citation2020) that can inform land-use planning and management alternatives (Brown, Citation2017; Kahila-Tani et al., Citation2016, Citation2019). PPGIS comes to the GIS community from the planning profession. PPGIS was established in 1993 in Friday Harbour, Washington (Obermeyer, Citation1998). The launch of PPGIS was because of a growth of GIS in the 1990s and researchers began operationalisation of place concepts using GIS to better inform land-use decisions (e.g. Craig et al., Citation2002; Elwood, Citation2011).
In recent times, methods such as PPGIS (e.g. Brown & Weber, Citation2011; Hausner et al., Citation2014), Participatory GIS-PGIS (e.g. Brown, Citation2017; Dunn, Citation2007; Zolkafli et al., Citation2017) and Volunteered Geographic Information -VGI (e.g. Goodchild, Citation2007; Hardy et al., Citation2012; Sui et al., Citation2013) are becoming mainstream as “institutional and societal issues” are increasingly important subjects in GIS research (Obermeyer, Citation1998, p. 2). Central to PPGIS, PGIS and VGI are the goals of valuing and including the wider public such as local communities (Craig et al., Citation2002) or non-expert knowledge in addition to conventional GIS “expert” knowledge (e.g. Elwood, Citation2011) in planning and decision making (e.g. Munro et al., Citation2019).
PPGIS is valuable given that it facilitates public participation, which is key to enhancing acceptance of decisions that have a spatial implication (Wolf et al., Citation2018) such as transportation decisions (Cascetta & Pagliara, Citation2013). This is partly because, as Brown and Weber (Citation2011, p. 2) highlight, PPGIS “is based on both sound science and social inclusiveness”. In other words, PPGIS facilitates engagement of the public who could provide knowledge based on their experiences and this could expand existing knowledge. However, what makes PPGIS unique is that (transport) planners and land managers could easily integrate the data gathered with other GIS layers (ibid) such as road networks.
Different PPGIS techniques could be applied in the mapping of landscape values and/or other spatial attributes: paper-based maps through mail surveys, internet-based electronic maps, facilitated group sessions such as workshops, and structured interviews. Each of the approaches has several pros and cons. Paper-based maps shared through mail surveys are the easiest as no internet connection or technological devices (e.g. computers or phones) are required in the mapping exercise. Participants would be provided with a paper map of the study area with accompanying instructions for placing stickers or any other markers. The disadvantages of this approach are cost (e.g. for maps and markers) and time (e.g. for mapping completion and digitalising the markers). Either paper or electronic maps could be used in interviews or facilitated group sessions. Nevertheless, a lot of personnel efforts would be required to successfully set up the interviews or group sessions. Internet-based electronic mapping could require the shortest time to complete. However, the participants would need a device such as a computer with internet access to complete. Thus, the lack of internet access among potential participants may negatively influence participation rates and in turn induce a sampling bias given only those with skills to use and have access to devices with internet connectivity will be included in the study (Brown & Reed, Citation2009). It is, therefore, important to consider the pros and cons of each technique when deciding which techniques(s) to use for a given PPGIS study. Ideally, as Brown and Reed further argue, a combination of various techniques would in most cases yield better results.
PPGIS has been used in various empirical and conceptual studies across multiple planning contexts. These include, but are not limited to, neighbourhood planning (Brown & Chin, Citation2013), urban planning (Jankowski et al., Citation2019a; Citation2019b; Kahila-Tani, Citation2015; Kahila-Tani et al., Citation2016, Citation2019) national park planning (Brown & Weber, Citation2011), coastal and marine planning (Skriver Hansen et al., Citation2021), and regional and environmental planning (Brown, Citation2012). For more comprehensive coverage on PPGIS see, for example (Brown, Citation2017; Brown et al., Citation2020; Brown & Kyttä, Citation2014; Sieber, Citation2006). Also, PPGIS bibliographies and open-source mapping resources could be found at an online open forum for PPGIS (PPGIS community, Citation2020).
PPGIS has also been applied in transportation planning. For example, Tang and Waters (Citation2005) study the use of Web-based PPGIS techniques in transportation planning. They argue that the PPGIS method (especially when conducted on the web) could provide interactive mapping and spatial analysis capabilities to help the public access and understand information, and to provide better public participation and collaboration in the transportation planning processes. Similarly, Griffin and Jiao (Citation2019), in their study of the geography and equity of participation methods for active transportation planning in Texas, note that online PPGIS increases wider public participation and collaboration by covering a wider geographic area than in-person meetings.
Despite the general adoption of PPGIS in the planning process, its application in tourism planning contexts is so far limited (Brown & Weber, Citation2013). However, there are a few exceptions such as the one by Wolf et al. (Citation2018) who used a PPGIS approach to research conflicts between mountain bike riders, horse riders, and other users of trails for tourism and recreation to national parks in northern Sydney, Australia. In their study Wolf et al., successfully identified potential conflict areas along trails. These authors went a step further by using empirical insights from their study to suggest an alternative conceptualisation in conflict theory. More examples of PPGIS in tourism contexts include Munro et al.’s (Citation2019) study on the use of PPGIS in coastal tourism planning. McCreary et al.’s (Citation2020) study on getting place-based visitor information through PPGIS to inform destination planning and in outdoor recreation activities (e.g. Heikinheimo et al., Citation2020). Nikula et al. (Citation2020) provide one example where PPGIS is used to collect residents’ views on land-use preferences and land-use values in a cross-border Finnish-Norwegian case involving recreational values, scenic views, and other special nature values like health and well-being. Another example is Kantola et al. (Citation2018) who explores the use of PPGIS in gathering tourists’ and locals’ views about their favourite places in a Finnish tourism resort. In we provide a summary of key PPGIS studies in land-use planning in general and a few available examples on transportation planning in particular. Thus, the use of PPGIS in tourism contexts is limited and almost unexplored in transportation planning for tourism. In fact, to our understanding, our study is the first to explore the use of PPGIS for transportation planning in a Nordic tourism destination.
Table 1. Summary of PPGIS studies.
Study area
We conducted this study in Sälenfjällen. The destination is mostly famous for ski tourism and is located in the municipality of Malung-Sälen, Sweden (Heldt et al., Citation2017) as in . Sälenfjällen is approximately 410 km from the capital of Sweden, Stockholm, and 460 km from the second biggest city Gothenburg. Malung-Sälen municipality has had a relatively steady population density with the slow growth of the local population while witnessing an influx of many second homeowners and other visitors (Scott & Pashkevich, Citation2019). As of 31st December 2019, the local population in Malung-Sälen was 10,138 according to Statistics Sweden, SCB (2020). Of this population, about 2000 live in Sälenfjällen throughout the year. Furthermore, Malung-Sälen is the starting point for Vasaloppet, a 90-km race, arguably the world’s largest cross-country ski-race attracting participants from all over the world (Vasaloppet, 2020). Sälenfjällen has developed as a predominant ski tourism destination since the 1960s. See for more information about the destination such as number of ski lifts and visitation statistics.
Figure 2. Sälen within Malung-Sälen municipality, Dalarna region, Sweden.
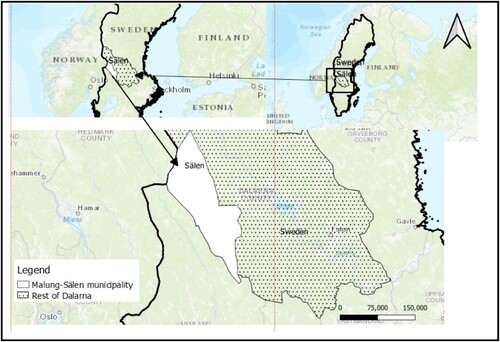
Table 2. Tourism infrastructure and guest turnover in Sälenfjällen.
In addition to benefits such as rejuvenating the local economy, tourism in Sälenfjällen has brought about negative effects including the emigration of better-educated youths (Thulemark et al., Citation2014), and economic restructuring in Malung-Sälen municipality (Lundmark, Citation2005). In 2019, for example, a total of 473 in-migrants were recorded of which 88 were from Dalarna County and the rest from other parts of Sweden and abroad (SCB, 2020).
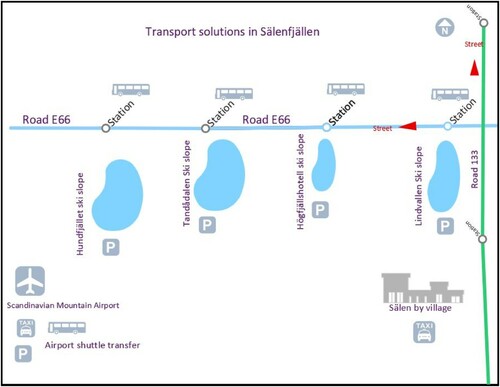
Presently, one can access Sälenfjällen by car, or bus. Also, it is possible to travel there by taking a train to the town of Mora and continuing by bus. Flying is an additional option. Since December 2019, the new Scandinavian Mountains Airport serves Sälenfjällen (and the cross-border destination Trysil on the Norwegian side) with both charter and scheduled flights nationally and internationally. Moreover, several options for traveling within Sälenfjällen exist including but not limited to, ski buses, public buses, rental cars, and taxi services (Destination Sälenfjällen, 2020). illustrates these current transportation solutions in Sälenfjällen. Notwithstanding these characteristics, there are challenges concerning transportation in Sälenfjällen. These transportation challenges are attributed to varying demand levels, especially during the high seasons when in peak weeks 50,000 unique visitors arrive at the destination.
Figure 3. Illustration of current transportation solutions in Sälenfjällen.
Materials and methods
As mentioned, we did the study as part of the Interreg Baltic Sea project MARA. There were several cases across Europe within the project each with a specific focus. For the Swedish case area Sälenfjällen, the special focus was exploring how PPGIS could be used at the early stages of transportation planning. To achieve this goal, we collected data on visitors’ perceptions of places needing transportation improvements.
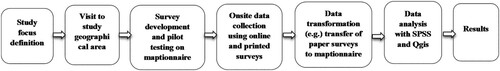
Apart from data on perceived places of improvement, we collected spatial data of relevance for visitors’ mobility behaviour (i.e. on where they stayed and places they visited). The study proceeded as illustrated in and explained in subsequent sections. More details on the MARA project as well as the survey for collecting data can be found in Alarcon et al. (Citation2020).
Figure 4. Diagram of method protocol in the study.
Data collection
Survey design and sampling
We used a PPGIS survey containing standard survey questions and mapping questions to collect information and preferences for transportation from visitors to Sälenfjällen over five weekends beginning with the last week of February to the end of March 2020. To facilitate participatory mapping from the visitors, the survey included mapping tasks in addition to standard survey questions (Nikula et al., Citation2020). The standard questions addressed the main reason for visiting, nights spent, lodging type, frequency of visit, transportation mode(s), satisfaction with transportation, demographic information, and finally visitors’ overall satisfaction with their stay. We developed the survey using the Maptionnaire tool, which “is a cloud service that allows anyone to create, publish and analyse map-based questionnaires with an editor tool” (Kahila-Tani et al., Citation2016, p. 200). After developing the survey, we conducted a pre-testing within the tourism research group at Dalarna University and improved the survey accordingly. Moreover, to minimize selection in the sampling of the visitors, we employed an on-site strategy in which we approached every 3rd visitor at checkout on pre-determined sites of the study. These included the main ski slopes and lodging facilities as in . The respondents could take the survey in either Swedish or English.
Table 3. Distribution of surveys over five weeks.
We distributed the survey online during the first 3 weeks of the study where participants had two possibilities for taking the survey; an online link which we sent to their email address or a QR-code. Thus, we provided tablets where visitors could fill in their email addresses and receive the link right away. For the QR-code option, visitors could use their mobile phones to scan and access the survey on the spot or take the QR-code as a printed copy and scan to access the survey later. Upon receiving the link, respondents could use mobile phones, tablets, or computers with an internet connection to answer the survey. Unfortunately, during the first three weeks of data collection, the response rate was low. We came across a few respondents who accepted to participate, scanned the QR code, and got access to the survey, but then never completed as can be seen from . In the discussion section, we elaborate further on the challenge of collecting data. From week four onwards we shifted to a paper-based format of the survey. Respondents were approached and asked to participate in the same way as previously but were also provided with pens so they could fill the printed questionnaires on the spot. A higher response rate was recorded on the printed version of the survey compared to the online version.
Unfortunately, the effects of Covid-19 resulted in the closure of Sälenfjällen in April 2020. Consequently, the data collection ended two weeks before the intended time. Notwithstanding, we collected a total of 184 (45 online and 139 on paper) surveys and included 162 of these for our final analysis. We have included the reasons for excluding the surveys in .
PPGIS mapping task
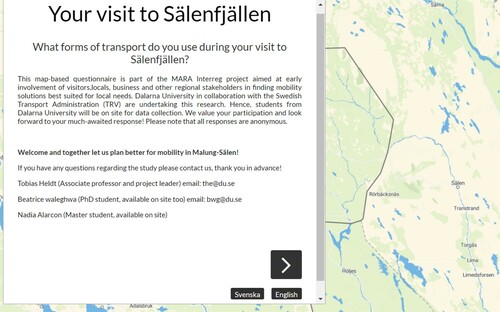
The PPGIS mapping task included Sälen as the starting point for the interactive map as illustrates. Specifically, this was the point in Sälen where the main road connecting Sweden and Norway (road E66), continues through Sälenfjällen. Respondents could zoom in and out of the map for the online version of the survey. Respondents who filled in the paper version of the survey could mark various places within Sälenfjällen such as Hundfjället, Lindvallen, Stöten, Tandådalen, and Högsfjället hotel. To operationalize the PPGIS mapping task, as mentioned earlier, the questionnaire had three mapping questions/possibilities: where were you staying during your visit to Sälenfjällen; my favourite places in Sälenfjällen; and places in need of improvement in Sälenfjällen.
Figure 5. Interactive survey on the Maptionniare interface.
In addition to the possibility to mark places visited and places to improve, a question on accommodation preference was added since a study by Heldt et al. (Citation2017) showed that the type of accommodation influenced travel behaviour, namely the choice for transportation mode to and from Sälenfjällen. For example, most visitors who had their cottages in Sälenfjällen used their car for transportation.
Furthermore, the three mapping questions comprised additional follow-up questions: “why do you prefer this location for your stay; why do you prefer visiting these places; why do you think these places need improvement; and finally, what kind of development do you think is needed?” For the follow-up questions, respondents could select a reason(s) for the areas they marked based on choices comprising of transportation attributes as stipulated in . Additionally, the questions were in part open-ended, making it possible for respondents to indicate other responses than those provided in the choices. We adopted the attributes from (Brown & Kyttä, Citation2014) and customized them to the purpose of our study.
Table 4. Attributes mapped by respondents.
Data analysis
We performed survey data management and analysis using SPSS- version 27. To learn about the respondent and trip characteristics, we produced descriptive statistics indicating gender, age, country, the main reason for visiting Sälenfjällen, frequency of visit, trip duration, transportation mode to and within Sälenfjällen, and a possibility to visit again. Furthermore, we performed an analysis of mapped responses using QGIS (e.g. Skriver Hansen et al., Citation2021). However, to begin with, we transferred all the paper surveys to Maptionniare after which we exported all the pointed data to QGIS for further analysis. However, a limitation with this procedure is that some precision might have been lost especially when transferring the mapped responses placed on paper surveys. That aside, we conducted a further spatial analysis in QGIS to get a visualisation of a summary of point-based data.
Results
As noted, our study is considered exploratory according to the PPGIS methodological framework by Fagerholm et al. (Citation2021). In exploratory PPGIS, data description and visualisation are fundamental methods, in contrast to predictive/modelling PPGIS studies where methods such as cluster, multivariate, and predictive analysis are common. In the subsequent section, we first show survey results followed by visualisation of the mapping results.
Standard survey results
In terms of representation, as shows, most respondents were female. Many of the visitors were from Sweden and a few from other countries including, the United Kingdom, and the USA. The results also indicate 33–47 years as the group with the most respondents, representing 45 percent of the total responses. also shows results indicating, albeit not surprisingly, that most visitors used their car for transportation to and within Sälenfjällen. Other modes of transportation that visitors used to Sälenfjällen included company cars, flying, and train. For traveling within Sälenfjällen, visitors used their car, bus, rental car, taxi, walking, and a combination of several transportation modes.
Table 5. Description of respondent and trip characteristics.
Mapping results
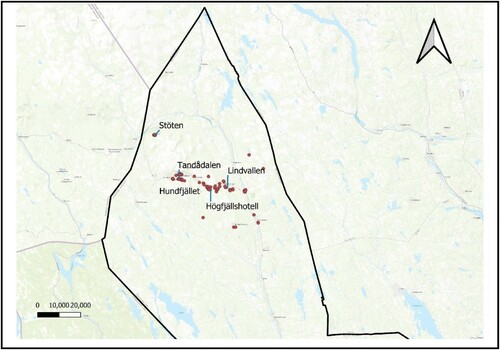
As mentioned earlier, the survey included PPGIS mapping tasks with three questions on accommodation, places visited, and places in need of improvement. Interestingly, respondents’ overall engagement in the mapping exercise was relatively high. Out of the total 162 surveys we analysed, 142 (88%) engaged in the mapping exercise. The engagement in mapping varied between online and paper surveys. Interestingly, it was on the paper surveys and not the online ones that most markers on average were placed. As illustrates, a total of 398 unique markers were placed by visitors.
Figure 6. All markers placed by visitors.
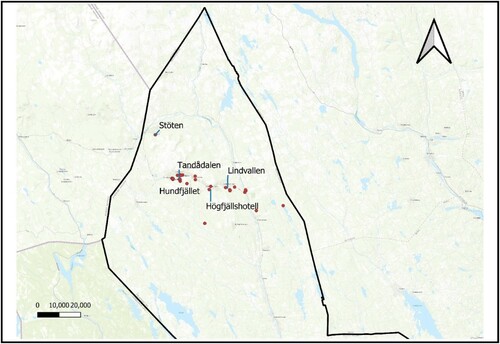
Place-based visitor preferences for accommodation
To show visitors’ preference for accommodation, we asked the question “where were you staying during your visit to Sälenfjällen?”. This was a simple question, which also served the purpose of getting the respondents familiar with the mapping part of the study. Respondents who answered online could place a marker in reply to this question. The respondents who answered on paper had several options to indicate their chosen places for accommodation. These choices were, Lindvallen, Högfjället hotel, Tandådalen, Hundfjället, Stöten, Kläppen, Sälen by or another site. Out of the 398 total markers, 139 indicated visitors’ location for their accommodation as shows. Based on the concentration of the markers, the results show most visitors stayed around Tandådalen followed by Lindvallen, Högsfjället, and Hundfjället in that order.
Figure 7. Markers indicating accommodation preferences of visitors.
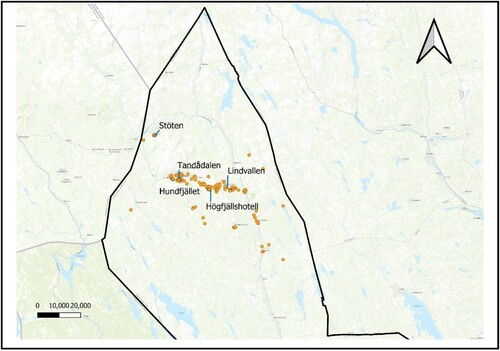
Place-based visitor preferences for activities
To get an idea of respondents’ mobility preferences, the second mapping question related to places they preferred visiting in Sälenfjällen. To operationalize this, a mapping section on “my favourite places in Sälenfjällen” was included and followed by a pop-up question “why do you prefer visiting these places?”. As shows, a total of 220 markers were placed in response to this question.
Figure 8. Markers indicating visitors’ preferences for activities.
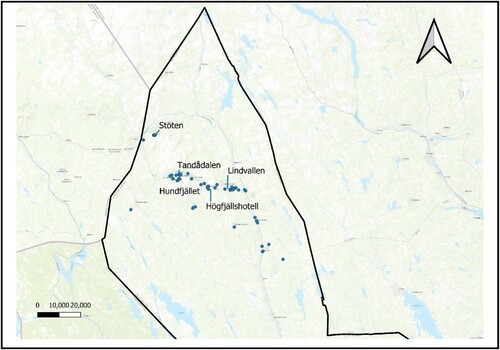
Place-based visitor preferences for improvements
The final mapping question was the one intended to be of most value for transport planning in its early stages. In this question, respondents had the opportunity to mark places in need of improvement and suggest the type of improvement to be made. In response, as is in , a total of 39 markers were placed. As mentioned earlier, this question received the lowest number of markers in comparison to questions about accommodation and places visited. Perhaps marking places to improve seems to have been the most demanding of all the mapping tasks. This led to a relatively lower number of markers placed. In this case, respondents also placed most markers around Tandådalen and Hundfjället areas. Despite its exploratory nature, our study suggests that Tandådalen and Hundfjället receive the most visitors, host most visitor activities, and need the most transportation improvements.
Figure 9. Visitor preferences for improvements.
Surprisingly, although very few markers were placed in places to improve, answers we received on the open-ended question about “suggestions for improvements”, point to needed improvements in Sälenfjällen. Examples of improvements highlighted by respondents include those in . In summary, the visitors indicated the need to maintain existing transportation infrastructure like roads and to build new infrastructure such as walking paths.
Table 6. Some examples of suggested improvements by visitors.
Discussion
Improving early stages of transport planning processes using PPGIS
Previous studies have noted the importance of using PPGIS in getting publićs values to inform management and land use planning (e.g. Brown, Citation2017; Kahila-Tani et al., Citation2016, Citation2019). In this study, we set out to explore the usability of the PPGIS approach in providing insights at the early stages of transportation planning in Sälenfjällen, Sweden. At this stage in the planning process, the focus is on understanding the challenge from different stakeholder perspectives. Although this study is limited to one stakeholder, the visitors, the details on consumer preferences and perceived transport challenges like lack of walking paths, areas for congestion, or places that need electric charging posts, are crucial inputs into a planning process. In addition, understanding visitors’ transportation preferences using PPGIS surveys could potentially promote their environmentally-friendly behaviour (Kelly et al., Citation2007) by for example including questions on visitors’ willingness to use alternative mobility solutions.
Our results about respondents and trip characteristics show the potential of PPGIS in providing information to planners on the composition of the stakeholder group under study, which in this case was the visitors to the area, while also indicating the possibility of collecting non-spatial data (McCreary et al., Citation2020) such as modes of transportation used by visitors. The PPGIS mapping task gives insights on the use of space, (i.e. locations) where visitors perceive to be having transportation challenges.
Findings from our study indicate, unsurprisingly, that the car is the predominant mode of transportation for visitors to Sälenfjällen. This could partly be because the destination has a sprawled land use pattern, where cottages are spread out, and there is limited public transport. This is not unique for Sälenfjällen as the situation is similar in other winter destinations internationally, including Whistler in Canada (Reilly et al., Citation2010).
This finding on the dominance of car use has important implications for transport planners at the municipality and destination level as it indicates continued demand for among others, parking spaces, but more likely parking spaces with electric charging options, following the shift towards electrified vehicles at the destination (Heldt et al., Citation2017). Furthermore, this result also raises intriguing questions about the not-so-frequent use of public transportation to and within the destination. Given the importance of early involvement in transportation planning processes (Cascetta & Pagliara, Citation2013), specifically in Sweden as in our case, this finding could be seen as a departure point for future studies to understand public transportation usage within the destination and addressing individuals’ willingness to and prerequisites for alternative mobility solutions. As has been explored in Whistler by Reilly et al. (Citation2010), studies on individuals’ willingness to shift their transportation could use choice methods to examine tourists’ transportation behaviour and their likelihood to shift their transportation choice based on the management options given to them. Regional transport planners could potentially collaborate in such a study as they are the main stakeholders who coordinate public transportation in Sweden (Tornberg & Odhage Citation2018).
Mapped responses from our study show the area around Hundfjället and Tandådalen as needing most transportation improvement. This could inform planning and management initiatives at the destination level by indicating where they could strategically direct available resources when designing interventions to address the transportation challenges. Also, developing destinations such as Sälenfjällen, to become more sustainable requires the input of data about environmental, economic, and social aspects (Hall, Citation2008). Broadly, while the economic, and environmental aspects are well addressed, the opposite is true when it comes to the social aspects (Tyrväinen et al., Citation2007). As Skriver Hansen et al. (Citation2021) also argue, PPGIS adds a social input of value for planning. Additionally, PPGIS could be used by municipal and regional planners to elicit place-based input from the public (e.g. Munro et al., Citation2019; Nikula et al., Citation2020) when planning the construction of new roads and maintenance of existing ones.
Just as has been argued in other PPGIS studies, our study raises the possibility that PPGIS surveys, although not without challenges, offer an opportunity to collect spatial information on the public’s perceived view about a planning challenge. PPGIS could, for example, be used in future transportation planning studies to analyse gender or possibly other socio-economic differences important for the early stages of planning. However, we should note that a participatory mapping design for a PPGIS study is influenced by several factors. These include what is mapped (attributes), who is mapping (sampling), the reason for mapping (purpose), how the mapping is done (i.e. the technology used), and the location of the study (where the mapping is conducted) (Brown & Kyttä, Citation2014, p. 6). These factors are unique to each study. To highlight the opportunities and challenges in PPGIS data collection, we discuss each of these factors based on insights from our study.
Opportunities and challenges in PPGIS data collection
PPGIS surveys are advantageous, unlike typical PPGIS studies where the focus is mostly on mapping questions. Adding surveys into the PPGIS process makes possible the mixing of different data collection strategies. This, in turn, addresses the inherent challenges of using just one method (e.g. Heikinheimo et al., Citation2020). However, collecting substantial amounts of data through PPGIS is both an opportunity and a challenge. It particularly becomes a challenge to get participants to become motivated enough to answer all the questions and engage in mapping. Consequently, there is a trade-off between complete surveys and the number of markers placed. Also, as mentioned earlier, what is mapped, who does the mapping, the reason for mapping, location for mapping and the technology used, influence markers placed, and general outcome of a PPGIS study.
The main categories of what could be mapped in a PPGIS study include but are not limited to, development preferences, place qualities, landscape values, and participant experiences (Brown & Kyttä, Citation2014). The mapping exercise in our study was closely related to our purpose which focussed primarily on exploring how PPGIS could be used at the early stages of transportation planning in a tourism context. The mapping exercise thus included questions on visitors’ preferences for transportation improvements, places they enjoyed visiting, and their accommodation preferences. There is a noticeable variation in the number of total markers placed between each of the mapping questions. Our results show that most markers were placed indicating places visited, followed by accommodation preferences, while those places in need of improvements (the last question) received a much smaller number of markers.
Interestingly, the question on places visited had the most markers. Indications from this result in comparison to the question “places to improve” could be threefold. One is that respondents had more places they preferred visiting in Sälenfjällen than places they wished were improved. Secondly, arguably the positioning of the question could have affected the markers placed. Lastly, marking places visited or rather favourite places could have been less demanding than marking places to improve. It seems possible that the few markers placed on the last question is due to a rather technical demand for PPGIS mapping. As Christine Dunn (Citation2007) cautions “ … although web-based GIS allows non-experts to visualize and manage geographical data interactively there are still technical demands of the user in terms of basic GIS skills … this could lead to participants feeling frustrated or manipulated” (p. 11).
Likewise, the sample, that is those who do the mapping does influence the outcome of a PPGIS mapping activity. “Mapping participants include stakeholders, broadly defined, such as residents or visitors to an area, experts or non-experts, and decision-makers or decision-takers” (Brown & Kyttä, Citation2014, p. 6). The sample in our study included visitors to Sälenfjällen. . The maps (which turned out to be quite similar) from our study show, the visitor’s geographical knowledge is limited to areas where they had accommodation and places they went to while at the destination. Hence further studies with other stakeholders (e.g. residents, second homeowners, business owners) with more geographical knowledge of Sälenfjällen are needed to identify areas that need transportation improvements within the destination. In addition, it is a challenge to encourage higher participation rates from visitors who are in most cases less invested in a destination and who have limited time which they want to use for other touristic activities and not to fill surveys (Brown & Weber, Citation2011). Thus, if a study aims to gather knowledge from the stakeholders to use it in a transportation planning process, it could be valuable to include the various stakeholders in a single study. This will be beneficial as it will not only ensure the geographical knowledge from each stakeholder group is complemented but could also lead to a higher response rate.
The location where mapping is done is yet another factor that influences the mapping activity. The mapping could be done in the field or a built environment (e.g. in the office, at home, etc.) (Brown & Kyttä, Citation2014). The location for mapping in our study included both the field (resting places near ski slopes) and built (various hotel lobbies and the Scandinavian Mountain Airport check-in bay). For mapping on the field, the visitors could fill the survey on the spot whereas, in the lobbies/airport option, visitors could scan a QR code or leave their email address to get the survey link and fill it in later. Our goal of including the option to scan the QR code was to provide the visitor with more possibilities to participate. But this meant that the visitors would by de facto end up using their phones to answer the survey. And this in part explains the low response rates on the mapping activity from the online version of the survey since participants might have been frustrated by the relatively small screen size of mobile phones.
Another possible explanation is that the online option made it easier to drop out and not complete the survey given that very few online surveys were returned. Thus, future studies should consider encouraging participants to use devices such as computers or tablets for example by having these devices on-site for participants to use straight away. Moreover, finding a suitable incentive that works for an online survey, lottery ticket, or gift voucher, that could be delivered upon completion, seems like another issue that could be explored further in terms of whether the incentives could elicit higher participation rates and the ethical dimension of using incentives in PPGIS studies. To add on, given the challenges with surveying which are not unique to PPGIS, it would be beneficial to combine several methods in a single study (Skriver Hansen et al., Citation2021) such as interviewing expert planners and workshops with residents.
Also, the mapping technology used could vary from print to digital media (e.g. Brown & Kyttä, Citation2014; Brown & Reed, Citation2009). As mentioned earlier, we collected data using an online-based survey during the first 3 weeks and shifted to a paper survey in the last 2 weeks. This was due to the very low response rate related to the online surveys. In contrast, the paper-based survey had a higher response rate. Additionally, respondents placed more markers on the paper surveys than on the online ones. The limitation we experienced with the paper survey related to having to digitalise the markers placed by respondents. Just as noted by Brown and Reed (Citation2009), digitalising the markers was time-consuming and some precision might have been lost in the process. In contrast, the surveys answered online did not present these challenges.
To add on, the very low response rate from the survey online compared to the paper-based version was unexpected given our presumption that the digital tools would be beneficial as Griffin and Jiao (Citation2019) and Tang and Waters (Citation2005) argued. After all, one expects that the internet presents new opportunities that paper-based surveys lack while Dunn (Citation2007) clearly indicates “at one level, web-based GIS [] has the potential, theoretically, to reach a limitless number of people and to elicit views rapidly and efficiently” (p. 10). Also, internet-based applications may reduce the overall cost of data collection, reduce the time required for data entry, and lead to increased precision in a mapping exercise (Denwood et al., Citation2022; Pocewicz et al., Citation2012). To some extent, like in the case of the results in our study, research by Pocewicz et al., found out that using a paper-based version of their PPGIS survey resulted in a “higher response rate, reduced participant bias, and greater mapping participation”. This leads us to ask the question: How can we encourage respondents to respond to digital PPGIS surveys given the numerous advantages that this approach can lead to?
Conclusions and future research
The main aim of our study was to explore the usability of PPGIS in collecting data of relevance at the early stages of transportation planning in Sälenfjällen, Sweden. In this study, we have shown that PPGIS surveys provide the possibility to gain detailed information, which includes standard survey data and place-based insights. This information is especially important at the early stages of transportation planning in tourism destinations where it is important to get all stakeholders’ views on the transportation challenges. Thus, our study lays the groundwork for future research, transportation planning, and management interventions in addressing for example the predominance of car use and the perceived unattractiveness of public transport alternatives in Sälenfjällen, which is a general challenge in many winter tourism destinations not only in the Nordic countries. It also leads to calls for further investigation of the overall mobility challenges at the destination, which seem to mostly exist in the area around the two biggest ski slopes Hundfjället and Tandådalen, but also includes overall destination’s adaptation to for example future scenarios with 100% e-car fleet and autonomous vehicles.
In retrospect, the challenges we experienced in this study mostly relate to issues of sampling and a low response rate to the survey. These are similar to experiences in other recent studies using PPGIS in a tourism context. In addition to sampling challenges in PPGIS studies, the Covid-19 crisis during the data collection stages of the study is likely to have further contributed to the sampling challenges and low response rate. Notwithstanding the challenges, PPGIS seems to have a great potential in providing useful insights to inform tourism destination management and transportation planning decisions. In this study, we have explored the preferences of one stakeholder group, visitors to the area. However, given visitor's geographical knowledge is mostly limited to areas for activities and accommodation facilities, comprehensive planning for a sustainable destination should, of course, include preferences of residents and business owners and their needed transport improvements during different seasons in Sälenfjällen to identify bottlenecks within the destination to further inform planning and management decisions. We see future studies particularly addressing the problem of sampling and engaging respondents to participate in a PPGIS study, recognizing that different incentives may be needed for the different stakeholder groups.
Funding details
This work was supported by Interreg Baltic Sea Mobility and Accessibility in Rural Areas (MARA) project 2019-2021.
Acknowledgments
We would like to thank the editor and two anonymous reviewers for your valuable comments and suggestions that have helped improve our paper.
Disclosure statement
No potential conflict of interest was reported by the author(s).
References
- Alarcon, N., Waleghwa, B., & Heldt, T. (2020). Mobility and accessibility in a rural tourism area: Report on mobility demand in Sälenfjällen, Sweden. Cetler, Centre for Tourism and Leisure Research No 2020:2, Falun, Sweden.
- Baum, T., & Lundtorp, S. (2001). Seasonality in tourism: An introduction. In T. Baum, & S. Lundtorp (Eds.), Seasonality in tourism (pp. 1–4). Pergamon.
- Broaddus, A., & Cervero, R. (2019). Transportation planning. In N. G. Leigh, S. P. French, S. Guhathakurta, B. Stiftel, & J. Doyle (Eds.), The Routledge Handbook of International Planning education (1st ed., pp. 253–264). Routledge.
- Brown, G. (2012). Public participation GIS (PPGIS) for regional and environmental planning: Reflections on a decade of empirical research. URISA Journal, 25(2), 5–16.
- Brown, G. (2017). A review of sampling effects and response bias in internet participatory mapping (PPGIS/PGIS/VGI). Transactions in GIS, 21(1), 39–56. https://doi.org/https://doi.org/10.1111/tgis.12207.
- Brown, G., & Chin, S. Y. W. (2013). Assessing the effectiveness of public participation in neighbourhood planning. Planning Practice and Research, 28(5), 563–588. https://doi.org/https://doi.org/10.1080/02697459.2013.820037.
- Brown, G., & Kyttä, M. (2014). Key issues and research priorities for public participation GIS (PPGIS): A synthesis based on empirical research. Applied Geography, 46, 122–136. https://doi.org/https://doi.org/10.1016/j.apgeog.2013.11.004
- Brown, G., Reed, P., & Raymond, C. M. (2020). Mapping place values: 10 lessons from two decades of public participation GIS empirical research. Applied Geography, 116, 1–8. https://doi.org/https://doi.org/10.1016/j.apgeog.2020.102156.
- Brown, G., & Weber, D. (2011). Public participation GIS: A new method for national park planning. Landscape and Urban Planning, 102(1), 1–15. https://doi.org/https://doi.org/10.1016/j.landurbplan.2011.03.003.
- Brown, G., & Weber, D. (2013). Using public participation GIS (PPGIS) on the Geoweb to monitor tourism development preferences. Journal of Sustainable Tourism, 21(2), 192–211. https://doi.org/https://doi.org/10.1080/09669582.2012.693501
- Brown, G. G., & Reed, P. (2009). Public participation gis: A new method for use in national forest planning. Forest Science, 55(2), 166–182.
- Butler, R. W. (2001). Seasonality in tourism: Issues and implications. In T. Baum, & S. Lundtorp (Eds.), Seasonality in tourism (pp. 5–22). Pergamon.
- Cascetta, E., & Pagliara, F. (2013). Public engagement for planning and designing transportation systems. Procedia - Social and Behavioral Sciences, 87, 103–116. https://doi.org/https://doi.org/10.1016/j.sbspro.2013.10.597
- Chase, L. C., Amsden, B., & Phillips, R. G. (2011). Stakeholder engagement in tourism planning and development. Springer. (pp. 475-490).
- Craig, W. J. (Ed), Harris, T. M. (Ed), & Weiner, D. (Ed) (2002). Community participation and Geographical Information systems. CRC Press.
- Denwood, T., Huck, J., & Lindley, S. (2022, February 27). Paper2GIS: Maintaining analytic potential whilst improving accessibility in participatory mapping [conference presentation abstract]. Association of American Geographers annual meeting, online. https://aag-annualmeeting.secure-platform.com/a/solicitations/19/sessiongallery/2796/application/10282
- Dredge, D. (Ed.), & Jenkins, J. (Ed.) (2011). Stories of practice: Tourism policy and planning. Routledge.
- Dunn, C. E. (2007). Participatory GIS - A people’s GIS? Progress in Human Geography, 31(5), 616–637. https://doi.org/https://doi.org/10.1177/0309132507081493.
- Duval, D. T. (2020). Transport and tourism: a perspective article. Tourism Review, ahead-of-print(ahead-of-print), 91–94.
- Elwood, S.. (2011). Participatory approaches in GIS and society research: Foundations, practices, and future directions. In T. L. Nyerges, R. McMaster, & H. Couclelis (Eds.), The SAGE Handbook of GIS and Society (1st ed., pp. 381–399). SAGE.
- Fagerholm, N., Raymond, C. M., Olafsson, A. S., Brown, G., Rinne, T., Hasanzadeh, K., Broberg, A., & Kyttä, M. (2021). A methodological framework for analysis of participatory mapping data in research, planning, and management. International Journal of Geographical Information Science, 35(9), 1–28. https://doi.org/https://doi.org/10.1080/13658816.2020.1869747.
- Fletcher, J. (2013). Tourism: Principles and practice (fifth edit). Pearson.
- Goodchild, M. F. (2007). Citizens as sensors: The world of volunteered geography. GeoJournal, 69(4), 211–221. https://doi.org/https://doi.org/10.1007/s10708-007-9111-y
- Griffin, G. P., & Jiao, J. (2019). The Geography and equity of crowdsourced public participation for active transportation planning. Transportation Research Record: Journal of the Transportation Research Board, 2673(1), 460–468. https://doi.org/https://doi.org/10.1177/0361198118823498
- Hall, C. M. (2008). Tourism planning: Policies, processes, and relationships (2nd ed.). Pearson/Prentice Hall.
- Hall, C. M. (2015). The Routledge Handbook of tourism and sustainability. Taylor and Francis.
- Hall, C. M., Müller, D. K., & Saarinen, J. (2009). Nordic tourism: Issues and cases. Channel View Publications.
- Hardy, D., Frew, J., & Goodchild, M. F. (2012). Volunteered geographic information production as a spatial process. International Journal of Geographical Information Science, 26(7), 1191–1212. https://doi.org/https://doi.org/10.1080/13658816.2011.629618.
- Hausner, V. H., Brown, G., & Lægreid, E. (2014). Effects of land tenure and protected areas on ecosystem services and land use preferences in Norway. Land Use Policy, 49, 1–46. https://doi.org/https://doi.org/10.1016/j.landusepol.2015.08.018.
- Heikinheimo, V., Tenkanen, H., Bergroth, C., Järv, O., Hiippala, T., & Toivonen, T. (2020). Understanding the use of urban green spaces from user-generated geographic information. Landscape and Urban Planning, 201, 1–15. https://doi.org/https://doi.org/10.1016/j.landurbplan.2020.103845.
- Heldt, T., Robertson, K., & Wikberg, Å. (2017). Hållbara turistresor: En fallstudie av destinationerna Kiruna, Åre, Sälen och Vimmerby. (Sustainable tourist travel – a case study of the destinations Kiruna, Åre, Sälen and Vimmerby) VTI rapport no. 929, Linköping, pp.47.
- Jankowski, P., Czepkiewicz, M., Młodkowski, M., Zwoliński, Z., & Wójcicki, M. (2019a). Evaluating the scalability of public participation in urban land use planning: A comparison of Geoweb methods with face-to-face meetings. Environment and Planning B: Urban Analytics and City Science, 46(3), 511–533. https://doi.org/https://doi.org/10.1177/2399808317719709.
- Jankowski, P., Czepkiewicz, M., Zwoliński, Z., Kaczmarek, T., Młodkowski, M., Bąkowska-Waldmann, E., Mikuła, Ł, Brudka, C., & Walczak, D. (2019b). Geoweb methods for public participation in Urban Planning: Selected cases from Poland. In K. Koutsopoulos, R. de Miguel González, & K. Donert (Eds.), Geospatial challenges in the 21st century (pp. 249–269). Springer.
- Kahila-Tani, M. (2015). Reshaping the planning process using local experiences: Utilising PPGIS in participatory urban planning. http://urn.fi/URN:ISBN:000-000-00-00
- Kahila-Tani, M., Broberg, A., Kyttä, M., & Tyger, T. (2016). Let the Citizens Map—public participation GIS as a planning support system in the Helsinki master plan process. Planning Practice and Research, 31(2), 195–214. https://doi.org/https://doi.org/10.1080/02697459.2015.1104203.
- Kahila-Tani, M., Kytta, M., & Geertman, S. (2019). Does mapping improve public participation? Exploring the pros and cons of using public participation GIS in urban planning practices. Landscape and Urban Planning, 186, 45–55. https://doi.org/https://doi.org/10.1016/j.landurbplan.2019.02.019.
- Kantola, S., Uusitalo, M., Nivala, V., & Tuulentie, S. (2018). Tourism resort users’ participation in planning: Testing the public participation geographic information system method in levi, Finnish lapland. Tourism Management Perspectives, 27, 22–32. https://doi.org/https://doi.org/10.1016/j.tmp.2018.04.001
- Kelly, J., Haider, W., Williams, P. W., & Englund, K. (2007). Stated preferences of tourists for eco-efficient destination planning options. Tourism Management, 28(2), 377–390. https://doi.org/https://doi.org/10.1016/j.tourman.2006.04.015
- Leigh, N. G., French, S. P., Guhathakurta, S., Stiftel, B., & Doyle, J. (2019). The Routledge Handbook of International Planning education (1st ed.). Routledge.
- Lundmark, L. (2005). Economic restructuring into tourism in the Swedish mountain range. Scandinavian Journal of Hospitality and Tourism, 5(1), 23–45. https://doi.org/https://doi.org/10.1080/15022250510014273.
- McCreary, A., Seekamp, E., Davenport, M., & Smith, J. W. (2020). Exploring qualitative applications of social media data for place-based assessments in destination planning. Current Issues in Tourism, 23(1), 82–98. https://doi.org/https://doi.org/10.1080/13683500.2019.1571023
- Ministry of Infrastructure, Sweden. (2020). accessed on 11/05/2020 at: https://www.government.se/government-policy/transport-and-infrastructure/
- Munro, J., Kobryn, H., Palmer, D., Bayley, S., & Moore, S. A. (2019). Charting the coast: Spatial planning for tourism using public participation GIS. Current Issues in Tourism, 22(4), 486–504https://doi.org/https://doi.org/10.1080/13683500.2017.1346589.
- Nikula, A., Turunen, M., Bogadóttir, R., Markkula, I., & Kantola, S. (2020). PPGIS for a better understanding of peoples values: Experiences from Finland and the Faroe Islands. In J. McDonagh, & S. Tuulentie (Eds.), Sharing Knowledge For Land Use management (pp. 70–85). Edward Elgar Publishing.
- Obermeyer, N. J. (1998). Evolution of public participation GIS. Cartography and Geographic Information Systems, 25(2), 65–66https://doi.org/https://doi.org/10.1559/152304098782594599.
- OECD. (2020). OECD tourism trends and policies 2020. OECD Publishing.
- Online PPGIS community. (2020). accessed on 29/10/2021 at: http://www.ppgis.net/communities-3/english/
- Page, S. (2005). Transport and tourism: Global perspectives. Pearson education.
- Page, S., & Connell, J. (2014). Transport and tourism. In A. A Lew, C. M Hall, & A. M Williams (Eds.), The Wiley Blackwell Companion to Tourism (1st eds., pp. 155–167). Wiley Blackwell.
- Peeters, P., & Dubois, G. (2010). Tourism travel under climate change mitigation constraints. Journal of Transport Geography, 18(3), 447–457. https://doi.org/https://doi.org/10.1016/j.jtrangeo.2009.09.003
- Peeters, P., & Schouten, F. (2006). Reducing the ecological footprint of inbound tourism and transport to Amsterdam. Journal of Sustainable Tourism, 14(2), 157–171. https://doi.org/https://doi.org/10.1080/09669580508669050
- Pocewicz, A., Nielsen-Pincus, M., Brown, G., & Schnitzer, R. (2012). An evaluation of internet versus paper-based Methods for Public Participation Geographic Information Systems (PPGIS). Transactions in GIS, 16(1), 39–53. https://doi.org/https://doi.org/10.1111/j.1467-9671.2011.01287.x.
- Prideaux, B. (2000). The role of the transport system in destination development. Tourism Management, 21(1), 53–63. https://doi.org/https://doi.org/10.1016/S0261-5177(99)00079-5
- Reilly, J., Williams, P., & Haider, W. (2010). Moving towards more eco-efficient tourist transportation to a resort destination: The case of whistler, British Columbia. Research in Transportation Economics, 26(1), 66–73. https://doi.org/https://doi.org/10.1016/j.retrec.2009.10.009
- Rodrigue, J. P. (2020). The Geography of transport system (5th ed.). Routledge.
- Sandtröm, S., Sandtröm, P., & Nikula, A. (2020). Who is the public and where is participation in participatory GIS and public participation GIS. In J. McDonagh, & S. Tuulentie (Eds.), Sharing Knowledge For Land Use management (pp. 55–69). Edward Elgar Publishing.
- Scott, D., & Pashkevich, A. (2019). Dalarna, Sweden: Conflicted touristic representations of a place on the fringe. In R. L. Koster & D. A. Carson (Eds.), Perspectives on rural tourism geographies (pp. 63–82). Springer.
- Sharpley, R. (2008). Planning for tourism: The case of dubai. Tourism and Hospitality Planning & Development, 5(1), 13–30. https://doi.org/https://doi.org/10.1080/14790530801936429
- Sieber, R. (2006). Public participation geographic information systems: A literature review and framework. Annals of the Association of American Geographers, 96(3), 491–507. https://doi.org/https://doi.org/10.1111/j.1467-8306.2006.00702.x.
- Skriver Hansen, A., Glette, V., & Arce, J. F. (2021). Mapping recreational activities in coastal and marine areas – PPGIS findings from western Sweden. Ocean & Coastal Management, 205, 105567. https://doi.org/https://doi.org/10.1016/j.ocecoaman.2021.105567
- STA, Swedish Transport Administration. (2014). Strategic Choice of Measures, a new step for planning of transportation solutions. Handbook. Publication 2013:176.
- Sui, D., Elwood, S., & Goodchild, M. (2013). Crowdsourcing geographic knowledge: Volunteered geographic information (VGI) in theory and practice. Springer Science & Business Media.
- Tang, K. X., & Waters, N. M. (2005). The internet, GIS and public participation in transportation planning. Progress in Planning, 64(1), 7–62. https://doi.org/https://doi.org/10.1016/j.progress.2005.03.004
- Thulemark, M., Lundmark, M., & Heldt-Cassel, S. (2014). Tourism employment and creative In-migrants. Scandinavian Journal of Hospitality and Tourism, 14(4), 403–421. https://doi.org/https://doi.org/10.1080/15022250.2014.968000.
- Tornberg, P., & Odhage, J. (2018). Making transport planning more collaborative? The case of strategic choice of measures in Swedish transport planning. Transportation Research Part A: Policy and Practice, 118, 416–429.
- Tyrväinen, L., Mäkinen, K., & Schipperijn, J. (2007). Tools for mapping social values of urban woodlands and other green areas. Landscape and Urban Planning, 79(1), 5–19. https://doi.org/https://doi.org/10.1016/j.landurbplan.2006.03.003
- Vergori, A. S., & Arima, S. (2020). Transport modes and tourism seasonality in Italy: By air or by road? Tourism Economics, 1–16. https://doi.org/https://doi.org/10.1177/1354816620974563.
- Wolf, D., Brown, G., & Wohlfart, T. (2018). Applying public participation GIS (PPGIS) to inform and manage visitor conflict along multi-use trails. Journal of Sustainable Tourism, 26(3), 470–495. https://doi.org/https://doi.org/10.1080/09669582.2017.1360315
- Zolkafli, A., Brown, G., & Liu, Y. (2017). An evaluation of participatory gis (pgis) for land use planning in Malaysia. The Electronic Journal of Information Systems in Developing Countries, 83(1), 1–23. https://doi.org/https://doi.org/10.1002/j.1681-4835.2017.tb00610.x.