
 ?Mathematical formulae have been encoded as MathML and are displayed in this HTML version using MathJax in order to improve their display. Uncheck the box to turn MathJax off. This feature requires Javascript. Click on a formula to zoom.
ABSTRACT
In this paper we analyse a set of socially responsible investment (SRI) indices against their conventional counterparts in the US context. Using a data set that spans the Obama and Trump administrations, we aim to identify whether performance and volatility patterns differ when markets are exposed to political uncertainty and the Global Financial Crisis (GFC). The findings suggest that SRI indices underperform conventional indices, and that the S&P 500 has a significant impact on their behaviour. The CBOE’s Volatility Index (VIX), the US Equity Related Economic Uncertainty Index (EEUi) and the impact of the economic policy uncertainty index (EPUi) are used to consider market volatility and political uncertainty, with VIX emerging as the best indicator to capture market uncertainty. The study signals a positive and significant impact on SRI indices during the first hundred days of the Obama administration with a lack of significant findings for the Trump administration for the period of study. The results for implied volatility reveal similar patterns across all indices.
1. Introduction
The concept of ethical investment can be traced as far back as 1602, when the Dutch East India Company faced boycotts from religious institutions because of its involvement in the trade of slaves. Later, in the 1920s, churches in the US began to apply faith-based criteria to exclude certain investments from their investment portfolio, such as businesses in the alcohol or tobacco industries. As such, socially responsible investment is not a new concept to the investment community, but recent interest in ethical investment dates to the early 1980s, when investors in the US began to screen their investments according to environmental, social and political criteria. By the 1990s, ethical investment had become popular and many investment companies launched a variety of ethically based investment products. Ethical investment entails a screening process in which stock shares are excluded or included on ethical, social or environmental grounds; the main idea is to “do good” by investing in portfolios that align with moral and ethical values. In general, socially responsible investment (SRI) aims to combine investors’ objectives with their commitment to social concerns. Thus, stocks would be selected by combining conventional financial criteria with ethical screening. Accordingly, SRI funds are formed by screening investment portfolios for particular social, ethical and/or environmental issues. However, is it coherent for investors to lose sight of their primary objective to invest successfully, namely, to obtain good returns for the level of risk taken? Should investors accept low investment returns or renounce a properly diversified portfolio for the sake of feeling good about their investment? This is a personal decision with a high emotional component, and the idea of investing in a socially responsible manner appears to be very appealing to certain investors with social mind-sets, but the concept is also quite ambiguous. Moreover, this type of investment experiences the same ups and downs as any other, and companies might claim to be socially responsible when in fact they are not. What, then, is the real power of ethical investment?
Ethical investment has evolved over the years and can no longer be considered a tiny niche market, as one out of every five dollars under professional management in the US follows some form of SRI strategy (US SIF, Citation2016). In 2016, sustainable, responsible and impact investing registered a 33% growth on its 2014 performance, and a 14-fold increase since 1995. The total of US-domiciled assets under management using SRI assets managed with ESG (environment, social issues and governance) totals $8.72 trillion (US SIF Foundation, Citation2016). There appears to be no limit to the continuous growth in the sector, and as a result, investors seem to be considering environment, social and governance issues when designing their strategies.
Considering the growing importance of SRI, this study considers the analysis of systemic risk and implications for SRI by looking at the impact of the economic policy uncertainty index (EPUi), implied volatility index (VIX) and the US Equity Related Economic Uncertainty Index (EEUi). Policy uncertainty has an impact on the effectiveness of policy intervention across the overall economy, and as such it is a major factor in the investment decision-making process (Tsai, Citation2017). Since the 2008 Global Financial Crisis, research on economic uncertainty has increased, motivating Baker, Bloom, and Davis (Citation2012a) to develop the EPU index. The index is grounded on three components: data from news reports on economic policy uncertainty in ten leading US newspapers; weighted and properly discounted tax code provisions; and disagreement from the Survey of Professional Forecasters measured by calculating the interquartile ranges of individual forecasters’ expectations of the consumer price index and purchases of goods and services by the federal, state, and local governments.
The review of the extant literature reveals a significant amount of research exploring the effects of EPU on a variety of economic and financial issues. For example, Zhang, Han, Pan, and Huang (Citation2015) examined EPU implications in the context of corporate governance. Wang, Chen, and Huang (Citation2014) looked at the impact of economic uncertainty on investment behaviour, while Scheffel (Citation2015) explored issues related to economic development. Monetary policy effects, commodity markets, stock price behaviour and market volatility were studied by Aastveit, Natvik, and Sola (Citation2013), Ko and Lee (Citation2015), Li et al. (Citation2015) and Scrabic and Soric (Citation2017) , respectively. Interestingly, there is no evidence of any research combining the analysis of SRI behaviour in the US during the first hundred days of a new administration and the economic and financial uncertainty associated with this initial period. Consequently, the present study contributes to this literature by incorporating Baker, Bloom, and Davis (Citation2015) EPU and EEU indices to measure economic and market uncertainty. This approach combined with the study of implied volatility; provide a suitable research framework in which to determine whether SRIs show stability patterns in the context of the Global Financial Crisis and during the first hundred days of the Obama and Trump administrations. The interest in the Obama and Trump administrations is motivated by mixed findings in the literature on this question. On the one hand, stock markets seem to prefer Democrat presidents over Republicans (Belo, Gala, & Jun, Citation2011; Santa‐Clara & Valkanov, Citation2003), whereas, popular wisdom holds just the opposite, signalling a positive stock market reaction to Republican presidents rather than Democrats (Jones & Banning, Citation2009). The question then arises of whether SRIs show a preference for the president’s political party, and to what extent SRI would exhibit more stable patterns during times of sustained economic and political uncertainty.
The novel contribution of the paper lies in the careful analysis of SRI and conventional indices in the context of the first hundred days of a new administration in the US, as this type of analysis has not been considered by the extant literature as yet. The study is based on four augmented market models that is complemented by a causality frequency domain approach that seeks to determine whether economic policy uncertainty, implied volatility and systemic risk have a significant impact on the performance of the selected indices. To our knowledge, this is the first study of its type, and as such makes a clear and significant contribution to the existing literature on SRI index performance. The rest of the paper is organised as follows: the second section presents a brief overview of the research on the political cycle and implications for investment portfolios. The third section outlines the data and the research methodology. The fourth section reports the main findings and offers a critical assessment of the results and their implications. Section five concludes the analysis and makes some suggestions for further research.
2. Literature review
According to the basic principles of portfolio theory, investors look for portfolios that maximise their returns, while at the time minimising their risk exposure, allowing them to receive the best possible return on their investment. However, a pertinent question concerns the potential price that investors might pay for selecting socially responsible investments. Renneboog, Horst, and Zhang (Citation2008) investigated under- and over-performance hypotheses for every SRI fund in the world, finding that SRI funds in the US, the UK and in many continental European and Asia-Pacific countries underperform their domestic benchmarks by −2.2% to −6.5%. These authors showed that except for some countries (such as France, Japan and Sweden), the risk adjusted returns of SRI funds were not statistically different from the performance of conventional funds. These findings suggest that investors’ preference for ethical investment does not seem to have a notable impact on their final return, and rather than materialising gains from the conscious investment approach they might end up being penalised. To examine this issue further, the following section explores the main research findings that have recently been reported in the field and that clearly show controversies regarding the benefits of investing in SRI funds.
2.1. The performance of socially responsible funds
The socially responsible investment (SRI) literature, together with the SRI industry, has experienced rapid growth in the past twenty years, attracting interest from analysts and academics alike. One particular aspect of interest among individual and private investors, concerns the link between SRI and ethical values, environmental protection, improved social conditions and good governance (Revelli & Viviani, Citation2015). Over the past decade, research has focused on analysing SRI performance to determine whether the financial costs associated with SRI investment are significantly different from those associated with conventional investments, and whether they have a significant effect on the financial and/or market performance of portfolios that follow an SRI strategy. According to Hamilton, Jo, and Statman (Citation1993), SRI has captivated some investors by incorporating a “feel good” factor into their investment decisions, as its main objective is to invest and generate returns while taking into consideration ethical and responsible activities. However, ethical investments that consider moral values as part of the investment process seem to bear an additional cost in terms of portfolio performance. The reason for this is that SRIs may be considered to be less-diversified portfolios, which as a result yield lower returns and are exposed to non-diversification risks. The literature on this question is inconclusive with some studies suggesting that SRIs perform less well than conventional portfolios and others finding SRI investments outperforming conventional portfolios (e.g., Alam & Rajjaque, Citation2010; Consolandi, Jaiswal-Dale, Poggiani, & Vercelli, Citation2009; Fernandez-Izquierdo & Matallin-Saez, Citation2008; Gil-Bazo, Ruiz-Verdu, & Santos, Citation2009; Lyn & Zychowicz, Citation2010).
Recent research interest seems to be shifting to the debate on whether SRI funds and indices are more profitable than conventional investments. Researchers have not managed to reach consensus on how SRI funds perform, and ambiguity on the performance of SRI remains an open question. Another issue arises out of this debate and involves discussions examining the similarity in performance of SRI and conventional investments, namely, whether there is a real interest among companies to take on greater environmental and social responsibility when addressing their stakeholders’ expectations. Most of the literature has analysed SRI fund performance in individual countries, with the US and the UK appearing to dominate the field. For example, Hamilton et al. (Citation1993), Goldreyer and Diltz (Citation1999), and Bello (Citation2005) looked at SRI performance in the US, finding that it is not significantly different from that of non-SRI funds. In contrast, Geczy, Stambaugh, and Levin (Citation2003) reported that the financial costs associated with SRI screens can be substantial; more specifically, financial costs can impose constraints of more than 1.5% per month on investors who put their trust in managers’ asset selection skills. The evidence for the UK (Luther, Matatko, & Corner, Citation1992; Mallin, Saadouni, & Briston, Citation1995; Gregory, Matatko, & Luther, Citation1997) concluded that the difference in performance between SRI and non-SRI is not statistically different from zero.
Abdelsalam, Duygun, Matallin-Saez, and Tortosa-Ausina (Citation2014) study of performance persistence in Islamic and SRI mutual funds adopted a multi-stage strategy, using partial frontier approaches to measure the sample funds’ performance. The main results indicated performance persistence for some of the analysed funds. The authors found that performance was particularly important during financial crises, as investors would be looking for funds with a more stable performance, and that Islamic and SRI types of funds seemed to have more stable patterns than conventional funds. The two types of funds were analysed together as they share social, ethical and financial objectives, and both use negative screening (filtering) criteria in selecting stocks for their portfolios in order to reflect these objectives (Forte & Miglietta, Citation2007).
The performance of sustainable investment in the context of the Global Financial Crisis and market uncertainty was studied by Lean and Nguyen (Citation2014), who reported lower Sharpe ratios on sustainable portfolios than conventional portfolios. Their results indicate that the Global Financial Crisis impacted sustainable investment return and volatility, while the US policy uncertainty index was found to have a limited effect, as it only seemed to impact on two of the regions examined (Asia Pacific and North America) during the crisis period.
Gil-Bazo et al. (Citation2009) analysed whether mutual funds constrained by an SRI strategy underperform mutual funds that are free of this constraint. Their findings show that rather than paying a price in the form of reduced performance, SRI mutual funds earned a premium from the superior risk-adjusted performance relative to that of a similar conventional fund. Furthermore, these authors found no conclusive evidence that SRI funds charge higher fees. However, the SRI funds have a higher performance premium than those of conventional funds, which is entirely due to the fact that SRI funds are operated by management companies specialising in SRI funds. Indeed, when compared to these highly specialised firms, SRI funds run by generalist companies will underperform conventional funds. The results highlight the importance of taking into account management company characteristics and specialisation in SRI when investors are selecting their SRI portfolio.
An analysis comparing the performance of SRI and conventional funds by Humphrey, Warren, and Boon (Citation2016) uncovered no meaningful differences on return estimates, which were insignificant and small in economic terms. This study corroborates existing evidence that investors can expect returns from SRI that are neither better nor worse than those from conventional funds, findings that seem to refute the notion that SRI will perform less well than conventional investments. Furthermore, Sturm and Field (Citation2018) concluded that conventional interpretation of SRI performance relative to benchmarks for evaluating financial investment does not appear to be appropriate for certain SRIs as they do not consider the opportunity cost. The reviewed literature offers evidence of the lack of agreement among researchers regarding the positive attributes of SRI, with some researchers supporting the idea of better performance associated with socially responsible investments while others clearly question their benefits.
2.2. The US presidential cycle and socially responsible funds
There is a large amount of literature analysing the effect of elections on the performance of financial markets. However, the study of socially responsible investment in the context of presidents’ first hundred days in office has not been considered yet. The election of Donald Trump as the 45th president of the USA was unexpected and was followed by a strong reaction in US stock prices, as markets seemed to incorporate expectations of economic growth and tax policy fairly quickly. Expectations among investors shifted towards the belief that economic growth would be strengthened, corporate taxes would fall and the climate for domestically oriented companies would be more favourable than for those with substantial foreign involvement (Wagner, Zeckhauser, & Ziegler, Citation2017). These events need to be analysed and compared with the market reaction to the first Obama administration as they might shed some light on how SRI responded to periods of significant uncertainty, as Trump’s election was not expected and Obama took office in the midst of the Global Financial Crisis, which made the first hundred days of his administration quite uncertain, when compared to Trump’s economic and financial climate.
Available research seems to consider the presidential cycle over its four years, with a clear lack of attention to the first days in office of a new administration. For instance, Sturm (Citation2009) studied the impact of the US presidential election cycle, finding that January holds greater predictive power during certain years of the president’s term in office. Cooper, McConnell, and Ovtchinnikov (Citation2006) documented evidence indicating that January returns have predictive power over returns for the remaining eleven months of the year. In particular, positive (negative) January returns will dictate the patterns for the remaining eleven months. These authors examined the presidential cycle and reported that stock returns appear to be higher during Democratic than Republican presidencies. The influence of the presidential party seems to be determined by variations in fiscal policies across party lines that are not reflected by standard variables examining the business cycle. The analysis of the US presidential cycle seems to focus on the study of equity indices like the S&P 500 and Dow Jones Industrial with very little examination of how ethical investments behave during the early days of a new administration. The identified research gap has motivated the development of this research paper, where its main contributions to the literature can be identified as follows: i) the study offers initial evidence on SRI performance by looking at SRI indices return and volatility patterns in the context of political uncertainty in the US during the first hundred days of the Obama and Trump administrations; ii) the research framework is supported by the incorporation of the VIX, EEU and the EPU indices, which measure political uncertainty and market volatility; and iii) the study is developed in the context of four market models that complemented by the frequency domain causality framework developed by Breitung and Candelon (Citation2006) seek to identify whether SRI indices are especially receptive to situations where market uncertainty is at its highest.
3. Data and research methodology
The economic policy uncertainty index (EPUi), introduced by Baker et al. (Citation2012a, Citation2012b), has been used in a large number of research papers in its short history. Researchers have considered uncertainty in the context of economic, monetary and fiscal policies, and the EPU index is commonly referred to as a good indicator of economic risk. However, the literature examined does not offer evidence of studies that have integrated the VIX and the EEU indices in the context of market uncertainty that examines the first hundred days of the most recent US administrations (Obama and Trump’s first hundred days in office) in the context of SRIs.
Our research sample is formed by five SRI indices (Calvert US LC Core Responsible, DJ Sustainability, DJSI World USA subset, DJSI World excluding alcohol, gambling, tobacco and arms and the MSCI KlD 400 Social); four conventional indices (Dow Jones Industrial, Nasdaq, Russell 2000 and the S&P 500); the US Treasury Bill (3 months rate); and three proxies for market uncertainty (EPUi, EEUi and the VIX). The data set for SRI indices and the conventional indices were collected from DataStream and MorningStar. The risk-free rate was downloaded from the US Department of the Treasury, where the daily Treasury yield curve for three months was selected. As the analysis deals with the performance of SRI in the US context, all the data were downloaded in US dollars and the most representative indices were selected to conduct the study. The research sample considers the first hundred days of the new administration for two US presidents; the first Obama administration and the Trump administration were considered due to data availability. The research sample spans from 28 April 2000 to 28 April 2017. Daily prices were downloaded, yielding a total of 4,436 observations. The return series were calculated by estimating the natural logarithm between two consecutive index prices. An extension of the traditional market model was implemented to account for excess returns. The model was adjusted with dummy variables introduced to capture the effects of potential uncertainty generated by the first hundred days of the Obama and Trump administrations and to capture the impact of the GFC. The market model was augmented by adding the Economic Policy Uncertainty index (EPUi), the US Equity Related Economic Uncertainty Index (EEUi) and the implied Volatility Index (VIX) to measure for market and political risk. The STLFSI (St. Louis Fed Financial Stress Index) was considered to measure systemic risk as it gauges the degree of financial stress in the markets. Unfortunately, the index comes as weekly data and did not match the data frequency selected to support this study. As a result, the VIX was selected as a substitute variable that reflects market uncertainty. The VIX index measures market expectations of near-term volatility conveyed by stock index option prices. The EPUi is a news-based equity index that is highly correlated with the widely used market-based equity volatility index (Ajmi, Aye, Balcilar, El Montasser, & Gupta, Citation2015). Consequently, when considering the VIX and the EPUi the results should be quite similar, an approach that would allow us to cross-check the research outcomes. Standard methodologies testing for the presence of unit roots (Dickey-Fuller test and Phillips Perron test) were used to ensure that the series were stationary. A VAR framework was also used to identify the number of lags to be considered as part of the causality analysis and to ensure that the models were properly specified. These tests are not reported in this paper as they are standard procedures used when working with time series to ensure data stability properties that are needed before engaging with econometric modelling. The market models and the causality domain approach are explained in the discussion that follows.
3.1. Model 1
The first market model considers the basic scenario to help understanding indexes performances in the context of the GFC, the Obama Administration and the Trump Administration.
where, ,
,
refers to the returns for the SRI and the conventional indices, the benchmark market indices and the risk-free asset (US T-bill). Four benchmark indices are considered in this study: the Dow Jones Industrial, the NASDAQ Composite, the Russell 2000 and the S&P 500, thus providing a broader view on market performance and at the same time, helping to identify which index might be causing major disruptions during the three sub-periods considered. In order to capture the impact of policy and market uncertainty the model is augmented to consider the impact of the EPUi, the EEUi and the VIX index. As a result, three extra dummy variables are introduced in the model to consider the first hundred days of each new administration and to account for the effects of the Global Financial Crisis (GFC). The dummy variable takes a value of one during each new administration and the GFC period and zero otherwise. As such, the model incorporates three dummy variables that explore the indices performance under three different periods: the first dummy variable was introduced to capture the effects of the Global Financial Crisis (
. The second dummy variable capture the first hundred days of the Obama administration (
, and Trump administration is represented by the third dummy variable (
, to help identify whether any abnormal returns were generated.
The models that follow (models 2, 3 and 4) are the augmented versions of model 1, including the uncertainty indices.
3.2. Model 2 – economic policy uncertainty index
Model two is the augmented version of model one as it seeks to capture the selected funds’ performance and how they are affected over the selected period of study in the context of Economic Policy Uncertainty that is measured by the EPU index. As a result, the economic policy index is properly integrated in the model to ensure that the index impact on the funds returns is captured. Furthermore, the model examines indices performances taken into account the two administrations under consideration and the effects of the GFC that are represented by the appropriate dummy variables.
3.3. Model 3 – implied volatility
Model three is the augmented version of model one adjusted to explore the impact of the implied volatility index. In this case, the model follows the same logic as model two with the difference that the VIX is the variable that captures market uncertainty and its impact on the performance of the funds under study.
3.4. Model 4 – equity economic related uncertainty index
Model four is the augmented version that considers equity economic related uncertainty following the same logic presented in model two and three. As in the previous cases, the augmented versions of the initial econometric model seek to capture specific dynamics associated with the selected uncertainty indices and as such the model is adjusted to integrate each relevant index at the time.
3.5. Model 5 – causality domain
Through the frequency domain, the analysis looks at frequency-varying causal effects across SRI and conventional funds and how they are impacted by economic, equity and market uncertainty during the selected time period with particular attention given to the first hundred days of the Obama and Trump administrations, and that this model helps to capture due to its dynamic behaviour. The main aim is to determine whether SRIs reacted differently to conventional funds, and how they were impacted by episodes of remarkable market uncertainty. A brief explanation on the Breitung and Candelon’s methodology is offered below (for further details, please refer to the authors research paper). A bivariate causality analysis between the SRI and conventional indices and the EPUi, VIX and systemic risk is considered as part of the methodological framework. A bivariate causality analysis in the context of the frequency domain brings further information to the indices’ behaviour over the sample period. Breitung and Candelon (Citation2006) study is based on earlier work by Geweke (Citation1982) and Hosoya (Citation1991) that considered the two-dimensional vector containing with a finite-order VAR representative of order p,
where, is a 2 × 2 lag polynomial and
are 2 × 2 autoregressive parameter matrices, with
and
. The error vector
is white noise with zero mean and
, where
is positive and finite. The MA representative of the system is
with G is the lower triangular matrix of the Cholesky decomposition
such that
and
The causality test developed by Geweke (Citation1982) can then be written as:
within this framework no Granger causality from to
at frequency
corresponds to the condition
. Breitung and Candelon (Citation2006) main contribution is to show that this condition leads to
where, is the (1,2)th element of
, such that a sufficient set of conditions for no causality is given by
Hence, we can test the null hypothesis of no Granger causality at frequency using a standard F-test for the linear restrictions imposed by the VAR representative of order p, which follows an F(2, T-2p) distribution for every
between 0 and
, where T is the number of observations in the series (Breitung & Candelon, Citation2006).
This causality test was selected because it is a dynamic test that can measure how the relationship between variables changes depending on the data frequency considered. As the study is analysing three main periods – the GFC and the first hundred days of the Obama and Trump administrations – the use of the spectral causal test is ideal to determine whether the causal relationship changes depending on the event considered.
4. Results and critical analysis
This section presents the main research findings and associates them with the key issues identified in the literature review. The analysis starts by outlining the basic details of the research sample and presenting descriptive statistics that offer some initial information on the performance of the indices. The discussions are followed by a brief comment on the basic time series analysis and tests conducted to ensure that the sample complied with stationarity requirements. The outcomes from the market models and the causality domain are then presented with some concluding comments on the indices’ volatility.
below offers the main details of the variables chosen to support this study and identifies the time period analysed. The selection of the SRI price indices was conditioned to data availability and also to the significance of the indices. The indices were filtered according to their relevance, and to ensure that the initial one hundred days of at least two presidencies could be analysedFootnote1. A sample of four conventional fund price indices was selected to ensure good representation of traditional funds. Data availability for the SRI indices determined the sample period that considers the impact of the Global Financial Crisis and the first hundred days of the first Obama administration and the Trump administration. The risk-free rate was included to ensure that the market model returns were adjusted accordingly. Three indices measuring economic and financial uncertainty were integrated into the research framework for robustness purposes. The indices were selected for their relevance and representativeness in measuring economic and financial uncertainty.
Table 1. Research Sample – 29 April 2000 to 28 April 2017.
The analysis of the first hundred days of a first-term presidency of two US presidents (Barack Obama and Donald Trump) helped to determine whether the performance of selected SRI Market Indices differed from that of conventional ones. The main research interest in analysing the first hundred days lies in the belief that during this period a president’s successes and accomplishments can be measured since this is when their power and influence are considered to be at their greatest level. It is therefore of interest to examine whether investors could materialise additional gains from their investments during the initial days of a new administration, or whether they should be more cautious because of higher levels of uncertainty that might have a negative impact on their investment portfolios.
4.1. Descriptive statistics
in the appendix outlines the basic descriptive statistics of the sample. The results offer interesting insights on the indices’ behaviour over the sample period. Daily average returns for Calvert, DJIR and MSCI are aligned with the patterns exhibited by the returns for the NASDAQ and the S&P 500 indices, while DJSIS, DJSIW (excluding alcohol, gambling, tobacco, and arms) and DJSR returns were slightly lower. The standard deviation highlighted the NASDAQ and Russell indices as the riskiest over the period, followed by Calvert, while the rest of the SRI indices had similar volatility levels to the S&P 500 and Dow Jones Industrial index. The highest Sharpe ratio was recorded for the Russell 2000 index, which was positive for all the indices except for the DJSIW. Three SRI indices had higher Sharpe ratios than the NASDAQ, and the ratios for two of them (Calvert and MSCI) were in a similar range to that of the S&P 500.
The correlation matrix (see in the appendix) indicates high positive correlation between the returns on SRI and the conventional stock market indices. The lowest correlations were found for the DJSIW index, which had the lowest average daily return over the period, with a standard deviation matching that of the Dow Jones Industrial. This was the only index with a negative Sharpe ratio, indicating that the return on the index was below the US-T Bill. These results show that DJSIW did not offer its investors appropriate returns when its risk level is taken into consideration. It is noteworthy that once “sin” activities are removed from the index, its performance drops significantly.
4.2. Model outcomes
The first market model (Equation 1 – in the appendix) identifies Calvert, DJSIS, DJS and MSCI as indices that outperform the Dow Jones Industrial with beta coefficients higher than one. Not surprisingly, DJSIW is associated with the lower beta coefficient, while the Calvert index reports a higher beta. When the NASDAQ, Russell 2000 and S&P 500 are used as the market return to measure for systemic risk, the results of the market model show beta coefficients lower than one in every case for the SRI indices, with the exception of Calvert in the context of the S&P 500 index. The coefficient for the dummy variable that considers the impact of the Global Financial Crisis shows that each index was negatively affected. However, with the dummy variable considering the first hundred days of the Obama administration only Calvert, DJS and MSCI appeared to be positively impacted, while the coefficients for the dummy variable capturing the first hundred days of the Trump administration were insignificant. These results suggest that SRI also aligns with the belief that markets prefer a Democratic president.
The results from market model 2 (see in the appendix), which incorporates the EPU index, show that the EPU index is insignificant in every case, the only exception being the DJS when the S&P 500 is used as a proxy for market returns. Calvert and MSCI outperform the Dow Jones Industrial and the S&P 500, while DJSIS outperforms the Dow Jones Industrial with registered beta coefficients higher than one. In the rest of the cases the beta coefficients are below one with the lowest outcomes registered when the NASDAQ is the proxy for the market return. The dummy variable for the GFC period suggests that only the DJS index was negatively affected, as the coefficients for the rest of the indices were insignificant. The results for the Obama administration show weak evidence of an impact on the indices, as coefficients were found to be significant at the ten percent level on only five occasions, and results are mixed for DJS and Calvert, which appear to be positively impacted, while DJSIW and DJSIS were impacted negatively. The results for the Trump administration showed a negative impact on the indices: again, the significance was quite low and only Calvert and DJS (when the S&P 500 is the proxy for the market return) reported negative and significant coefficients, reflecting a negative effect of the Trump administration on these indices.
The results from the augmented market model 4, considering market uncertainty from the EEUi index (see in the appendix), confirm that Calvert, DJSIS and MSCI outperform the market in the context of the Dow Jones Industrial, and that Calvert and MSCI have a beta coefficient greater than one for the case of the S&P 500 market return. For the rest of the cases, the SRI indices are lower than one with particularly low results when the NASDAQ is considered as the market return. One interesting outcome is found when the EEUi economic uncertainty is introduced in the model. This variable appeared to be insignificant, and in the selected cases where a significant coefficient was recorded the outcome was quite weak (significant at the ten percent level). The results also show that the Global Financial Crisis had a negative impact on Calvert and DJSIS in the context of the Dow Jones Industrial and the S&P 500. However, the Obama and Trump administrations did not seem to have any impact on the behaviour of the SRI indices.
When adjusted for implied volatility (VIX), the augmented market model shows some interesting findings (see in the appendix). Here, the reported beta coefficients are lower than one for every case with the exception of Calvert when the S&P 500 is the proxy for market returns. The dummy variable that captures the impact of the VIX indicates that implied volatility has a negative effect on each of the SRI indices and a positive effect was found only in three cases when the S&P 500 is the proxy for market returns. This model reported a positive and significant impact on SRI indices during the first days of the Obama administration with positive coefficients when the Dow Jones is the market proxy, and on two occasions (Calvert and MCSI) when the S&P 500 is the market proxy. During the first days of the Trump administration the coefficients are insignificant for every case.
As in Humphrey et al.’s (Citation2016) study, there were no meaningful differences on return estimates, corroborating the idea that SRI indices should be considered neither better nor worse than conventional indices. The results also align with findings from Lean and Nguyen (Citation2014) indicating that the Global Financial Crisis impacted on the performance of sustainable investment, while the US policy uncertainty index does not seem to be significant. And finally, it appears that the Trump administration did not have any significant effect on SRI indices, whereas the opposite is true for the Obama administration; this is an interesting result considering that the first days of the Obama administration were heavily impacted by the GFC.
4.3. Causality in domain frequency findings
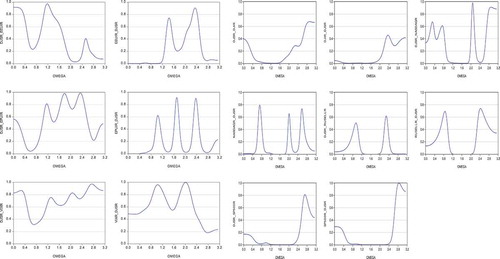
The causality domain model was estimated after examining the existence of a cointegration relationship between the indices analysed (see in the appendix). The outcomes from the cointegration tests show no long-term relationship between the SRI and conventional indices. On the other hand, the SRI indices showed evidence of a long-run relationship with the three indices measuring market uncertainty. These outcomes are considered when implementing the causality domain analysis. The Akaike information criterion was selected as the lag selection criterion when performing the causality test in the context of long-run relationship and no relationship. As in Breitung and Candelon (Citation2006), to assess the statistical significance of the causal relationship between stock market index returns, the causality measure for the frequency ω is compared to the 5% critical value of a χ2-distribution with 2 degrees of freedom (5.99). The domain causality results are presented in the appendix (see –).The results do not confirm the existence of causality between Calvert and the VIX, with findings that are also insignificant for the EEUi, while EPUi has a dynamic relationship, highlighting a short-term impact during the initial days of the Obama and Trump administrations. The market index S&P 500 has an impact on the behaviour of Calvert during the GFC and the early days of the Obama administration. In the case of DJSIS, the EPUi has a short causal effect during the Obama administration period, while no significant causal relationship was found for the EEUi and the VIX. The results of causal effects from conventional indices suggest that DJSIS is not affected by any of the conventional funds in the short run. In the case of DJSIW the results show no evidence of causal relationships from the EPUi, EEUi and VIX. Only in the case of the S&P 500 was a short-term causal effect found during the GFC and the Obama administration. For MSCI there is no significant evidence of causal relationships from the proxies for market uncertainty, while the outcomes for causal effects from conventional funds show that the NASDAQ and the S&P 500 have a short-term effect on the performance of the index during the GFC period, and a longer-term effect registered from the S&P 500. In the case of DJSR the results show a short causal effect from EPUi during the Obama administration period with insignificant causal effects from the EEUi and the VIX. The S&P 500 and the Russell 2000 indices have a causal effect on the DJSR, with the S&P 500 having a persistence effect during the GFC, although no causal effect is recorded during the Trump administration.
Figure 1. Domain causality – Calvert.
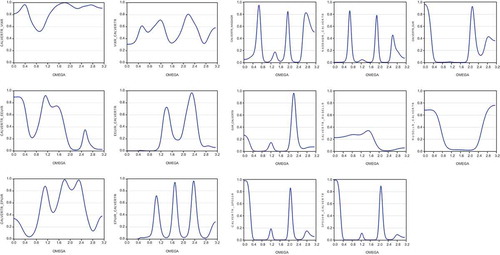
Figure 2. Domain Causality – DJSI.
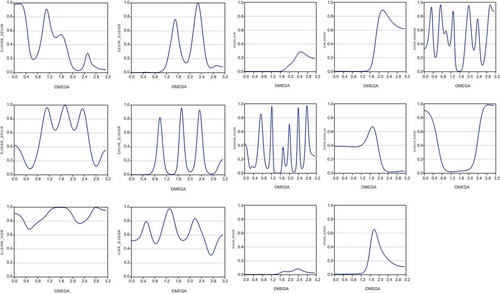
Figure 3. Domain Causality – DJSI2.
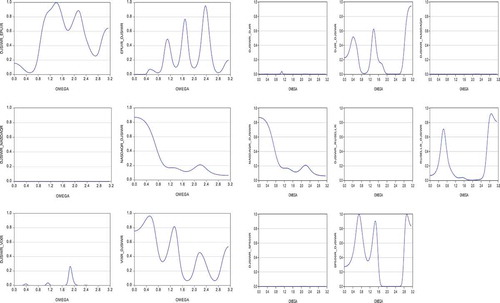
Figure 4. Domain Causality – MSCI.
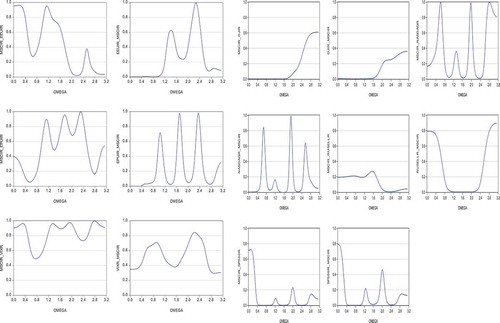
Figure 5. Domain Causality – DJS.
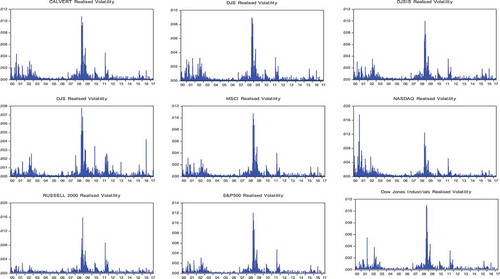
The results for realised volatility show high levels of volatility around the period of the GFC, with patterns highlighting the DJS, DJSIS and the DJSW indices as more instable over the period, showing evidence of more persistence episodes that seem quite remarkable in the case of the DJSW index. On the other hand, Calvert and MSCI volatility behaviour aligns with that of the Dow Jones Industrial and the S&P 500. These findings contradict Abdelsalam et al.’s (Citation2014) conclusions that SRIs are associated with more stable patterns, as their volatility seems to replicate the behaviour of conventional indices (see in the appendix for realised volatility).
Figure 6. Realised Volatility.
The main research outcomes can be summarised as follows:
The EPUi and EEUi appear to be insignificant, confirming that the economic policy uncertainty index does not add further understanding of the behaviour of SRI indices and how they might be reacting to periods of economic and financial uncertainty. On the other hand, the VIX seems to be a better metric to consider market sentiment and investors reaction to risk as this variable was significant in almost every case and appeared to have a negative impact on the performance of SRI over the analysed period.
SRI indices have lower returns than conventional indices and in general they are associated with volatility levels that tally with patterns exhibited by the Dow Jones Industrial and the S&P 500.
Registered beta coefficients indicate that in general, SRI indices underperform their conventional counterparts apart from Calvert and MSCI, which seem to perform better when the Dow Jones Industrial and the S&P 500 are used as proxies for the market return.
The causality domain analysis suggested that the GFC had a significant effect on the SRI indices, with the S&P 500 index having a more defined influence on the behaviour of the SRI indices over the period.
The analysis of realised volatility shows that in general, SRI indices react to market uncertainty in a similar way to their conventional peers. The case of DJSW is exceptional as it appeared to exhibit higher levels of instability and longer persistence effects.
In sum, when considering the power of SRI in the context of market uncertainty, it seems that this type of fund does not offer real opportunities to investors, as they underperform well-established indices like the Dow Jones Industrial and the S&P 500. SRI appears to be associated with a “feel good” concept of investing while sacrificing financial gains, an approach that appears to be incongruent with the basic principles of portfolio theory, which seek to maximise expected returns based on a given level of market risk.
5. Conclusions and further research
This study compares the performance of five SRI indices (Calvert US LC Core Responsible, DJ Sustainability, DJSI World USA subset, DJSI World excluding alcohol, gambling, tobacco and arms and the MSCI KlD 400 Social) with selected unscreened conventional counterparts (Dow Jones Industrial, NASDAQ, Russell 2000 and the S&P 500). The results suggest that in general SRI indices underperform conventional indices, and that the S&P 500 index fund has the strongest impact on their behaviour. The study also considered market volatility and political uncertainty using the VIX, EEU and EPU indices as indicators. The VIX is identified as the best indicator to capture market uncertainty, with insignificant results for the EPU index (EPUi) and the EEU index (EEUi).
Overall, our results reveal that once the EPUi is included in the model, both conventional and SRI market indices incorporate the level of implied volatility relatively quickly when a shift in the political party occurs, as the Trump administration led to a negative impact on both indices. However, a weak and positive relation was identified for the Obama administration, indicating a gradual impact on SRI indices under his presidency. Additionally, this effect is observed in an augmented market model adjusted for implied volatility (VIX), thus observing a more pronounced positive and significant impact on SRI indices during the first hundred days of the Obama administration. The results confirm that the market prefers a Democratic presidency, specifically in the case of the SRI stock market, and it opens a window of opportunity to break the impasse in extreme economic conditions, such as the GFC.
In addition, the causality in domain frequency findings shed light on the lack of any relationship between SRI indices and their conventional counterparts. In tune with earlier results, the Obama administration only reports a clear short-term causal effect for the S&P 500 and only the DJSR has a weak causal effect with the EPUi. Furthermore, other indices analysed such as DJS, DJSIS and DJSW yield to higher levels of instability over the period that coincided with the Global Financial Crisis (GFC), during which the stock market was characterised by high levels of volatility and aligned with the Obama administration.
This study provides insights on SRI performance and behaviour when markets are exposed to unexpected events, such as GFC and changes in presidential administrations. To gain more robustness in the implied volatility analysis, selected conventional market indices were considered and although previous literature seems to attribute a major stability to the SRI, our results reveal similar patterns across all indices during the period analysed. It seems that only the S&P 500 and Dow Jones Industrial conventional indices are aligned with Calvert and MSCI, but DJS, DJSIS and especially DJSIW seems to give a stronger reaction to the instability of the market. This analysis covers stock market reactions to key economic events, such as GFC and the first hundred days of a presidential term, in the case of responsible investing, an issue that has barely been approached in literature. Due to the increasing importance of SRI in the context of the US and internationally, further empirical research is needed in conjunction with the development of cross-country samples in order to understand how market indices react to combinations of extreme implied volatility and political uncertainty. A natural direction for future research includes rethinking the Democratic versus Republican Party puzzle and its implications for the stock market volatility.
Disclosure statement
No potential conflict of interest was reported by the authors.
Additional information
Notes on contributors
Lucía Morales
Lucía Morales is a scholar in the College of Business at Technological University Dublin. She is an active researcher in the areas of Time Series, Economics, Finance and Education. She teaches in the fields of Economics, Finance, Financial Economics, and Econometrics at postgraduate and doctoral level.
Amparo Soler-Domínguez
Amparo Soler-Domínguez is Lecturer of Financial Economics at the University Jaume I (Castellón, Spain). Her main research field is the performance analysis of mutual funds from a nonparametric perspective, in which she has been applying traditional, but also innovative, operational research methodologies to assess the efficiency, determinants and persistence of mutual funds. She has been a visiting researcher at the University of Leicester, the Internet Interdisciplinary Institute of the Open University of Catalonia and the Dublin Institute of Technology. She has co-written papers published in specialized journals, such as Omega, Business Ethics: a European Review, The North American Journal of Economics and Finance, ACM Computing Surveys, Journal of Cleaner Production, Finance Research Letters, Journal of Operational Research Society, Journal of Applied Economics and Applied Economics Letters, among others and she has presented the results of her investigations in several international conferences.
James Hanly
James Hanly is a Senior Lecturer in the College of Business at Technological University Dublin (Ireland). He holds a PhD and an MS.c in Finance from University College Dublin and a BBS(Finance) from Dublin City University. His research interests focus on asset pricing, risk management and volatility modelling in energy, financial and commodity markets. He is also interested in experiential learning and management dynamics and how research can inform and help develop management practice.
Notes
1 The study sought to examine as many US presidencies as possible, but this was conditioned to data availability. The research sample ended up examining the first term of the Obama and Trump administration as SRI funds did not have consistent information for early administrations.
References
- Aastveit, K., Natvik, G. J., & Sola, S. (2013). Economic Uncertainty and the Effectiveness of Monetary Policy. Oslo, Norway: Norges Bank Working Paper.
- Abdelsalam, O., Duygun, M., Matallin-Saez, J. C., & Tortosa-Ausina, E. (2014). Do ethics imply persistence? The case of Islamic and socially responsible funds. Journal of Banking and Finance, 40, 182–194.
- Ajmi, A. N., Aye, G. C., Balcilar, M., El Montasser, G., & Gupta, R. (2015). Causality between US economic policy and equity market uncertainties: Evidence from linear and nonlinear tests. Journal ofApplied Economics, 18(2), 225–246.
- Alam, N., & Rajjaque, M. S. (2010). Shariah-compliant equities: Empirical evaluation of performance in the European market during credit crunch. Journal of Financial Services Marketing, 15, 228–240.
- Baker, S., Bloom, N., & Davis, S. J. (2012a). Measuring economic policy uncertainty. University of Chicago and Stanford University. Retrieved from www.policyuncertainty.com
- Baker, S. R., Bloom, N., & Davis, S. J. (2012b). Has economic policy uncertainty hampered the recovery?. In L. E. Ohanian, J. B. Taylor, & I. J. Wright (Eds.), Government policies and the delayed economic recovery (pp. 39–56). Stanford, CA: Hoover Institution Press.
- Baker, S. R., Bloom, R. N., & Davis, S. J. (2015). Measuring economic policy uncertainty (NBER working paper series). Retrieved from http://www.nber.org/papers/w21633
- Bello, Z. (2005). Socially responsible investing and portfolio diversification. Journal of Financial Research, 28(1), 41–57.
- Belo, F., Gala, V. D., & Jun, L. (2011). Government spending, political cycles, and the cross-section of stock returns. Journal of Financial Economics, 107(2), 305–324.
- Breitung, J., & Candelon, B. (2006). Testing for short-and long-run causality: A frequency-domain approach. Journal of Econometrics, 132(2), 363_378.
- Consolandi, C., Jaiswal-Dale, A., Poggiani, E., & Vercelli, A. (2009). Global standards and ethical stock indexes: The case of the Dow Jones sustainability Stoxx Index. Journal of Business Ethics, 87, 185–197.
- Cooper, M. J., McConnell, J. J., & Ovtchinnikov, A. V. (2006). The other January effect. Journal of Financial Economics, 82, 315–341.
- Federal Reserve Bank of St. Louis, St. Louis Fed Financial Stress Index© [STLFSI], Retrieved from FRED, Federal Reserve Bank of St. Louis https://fred.stlouisfed.org/series/STLFSI
- Fernandez-Izquierdo, A., & Matallin-Saez, J. (2008). Performance of ethical mutual funds in Spain: Sacrifice or premium? Journal of Business Ethics, 81, 247–260.
- Forte, G., & Miglietta, F. (2007). Islamic mutual funds as faith-based funds in a socially responsible context. Technical report, social science research network. O. Abdelsalam et al. Journal of Banking & Finance, 40(2014), 182–194 193.
- Geczy, C. C., Stambaugh, R. F., & Levin, D. (2003). Investing in socially responsible mutual funds. Working Paper Wharton School.
- Geweke, J. (1982). Measurement of linear dependence and feedback between multiple time series. Journal of the American Statistical Association, 77(378), 304–324.
- Gil-Bazo, J., Ruiz-Verdu, P., & Santos, A. A. P. (2009). The performance of socially responsible mutual funds: The role of fees and management companies. Journal of Business Ethics, 94, 243–263.
- Goldreyer, E. F., & Diltz, J. D. (1999). The performance of socially responsible mutual funds: Incorporating socio-political information in portfolio selection. Managerial Finance, 25(1), 23–36.
- Gregory, A., Matatko, J., & Luther, R. (1997). Ethical unit trust financial performance: Small company effects and fund size effects. Journal of Business Finance and Accounting, 24(5), 705–724.
- Hamilton, S., Jo, H., & Statman, M. (1993). Doing well while doing good? The investment performance of socially responsible mutual funds. Financial Analysts Journal, 49(6), 62–66.
- Hosoya, Y. (1991). The decomposition and measurement of the interdependence between second-order stationary processes. Probability Theory and Related Fields, 88, 429–444.
- Humphrey, J. E., Warren, G., & Boon, J. (2016). What is different about socially responsible funds? A holdings-based analysis. Journal of Business Ethics, 138, 293–297.
- Jones, S. T., & Banning, K. (2009). US elections and monthly stock market returns. Journal of Economics and Finance, 33(3), 273–287.
- Ko, J. H., & Lee, C. M. (2015). International economic policy uncertainty and stock prices: Wavelet approach. Economics Letters, 134, 118–122.
- Lean, H. H., & Nguyen, D. K. (2014). Policy uncertainty and performance characteristics of sustainable investments across regions around the global financial crisis. Applied Financial Economics, 24(21), 1367–1373.
- Li, X.-M., Zhang, B., & Gao, R. (2015). Economic policy uncertainty shocks and stock–Bond correlations: Evidence from the US market. Economics Letters, 132, 91–96.
- Luther, R. G., Matatko, J., & Corner, D. (1992). The investment performance of UK ethical unit trusts. Accounting. Auditing and Accountability Journal, 5(4), 57–70.
- Lyn, E. O., & Zychowicz, E. J. (2010). The impact of faith-based screens on investment performance. The Journal of Investing, 19, 136–143.
- Mallin, C. A., Saadouni, B., & Briston, R. J. (1995). The financial performance of ethical investment funds. Journal of Business Finance and Accounting, 22(4), 483–496.
- Renneboog, L., Horst, J., & Zhang, C. (2008). The price of ethics and stakeholder governance: The performance of socially responsible mutual funds. Journal of Corporate Finance, 14, 302–322.
- Revelli, C., & Viviani, J.-L. (2015). Financial performance of Socially Responsible Investing (SRI): What have we learnined? A meta-analysis. Business Ethics: A European Review, 24(2), 159–185.
- Santa‐Clara, P., & Valkanov, R. (2003). The presidential puzzle: Political cycles and the stock market. The Journal of Finance, 58(5), 1841–1872.
- Scheffel, E. M. (2015). Accounting for the political uncertainty factor. Journal of Applied Econometrics, 3, 1048–1064.
- Scrabic, B. P., & Soric, P. (2017). A note on the “economic policy uncertainty index”. Social Indicators Research. doi:10.1007/s11205-017-1609-1
- Sturm, R. (2009). The “other” January effect and the presidential election cycle. Applied Financial Economics, 19, 1355–1363.
- Sturm, R. R., & Field, C. M. (2018). Benchmark error and socially responsible investments. Global Finance Journal, 38, 24–29.
- Tsai, I.-C. (2017). The source of global stock market risk: A viewpoint of economic policy uncertainty. Economic Modelling, 60, 122–131.
- US SIF Foundation (2016). The forum for sustainable and responsible investment. 2016 Trends and Report Highlights. Retrieved from http://www.ussif.org/files/Trends/US%20SIF%202016%20Trends%20Overview.pdf
- Wagner, A., Zeckhauser, R., & Ziegler, A. (2017). Company stock reactions to the 2016 election shock: Trump, taxes and trade (Faculty Research Working Paper Series. RWP17–005). Harvard Kennedy School. Retrieved from https://research.hks.harvard.edu/publications/workingpapers/Index.aspx
- Wang, Y., Chen, C. R., & Huang, Y. S. (2014). Economic policy uncertainty and corporate investment: Evidence from China. Pacific-Basin Finance Journal, 26, 227–243.
- Zhang, G., Han, J., Pan, Z., & Huang, H. (2015). Economic policy uncertainty and capital structure choice: Evidence from China. Economic Systems, 39(3), 439–457.
Appendix
Table A1. Descriptive Statistics of Daily Returns.
Table A2. Correlation matrix.
Table A3. Market model 1.
Table A4. EEUi market model (Equation 4).
Table A5. EPUi market model (Equation 2).
Table A6. VIX market model (Equation 3).
Table A7. Cointegration tests (Causality domain model).