
 ?Mathematical formulae have been encoded as MathML and are displayed in this HTML version using MathJax in order to improve their display. Uncheck the box to turn MathJax off. This feature requires Javascript. Click on a formula to zoom.
ABSTRACT
This study investigates the relationship between demography and inflation using panel cointegration for 24 countries during 1961–2014. It shows that the age structure of the population affects inflation. The answer to the question “is population aging inflationary or disinflationary?” depends on the stage of the demographic process and, particularly, on the consideration that the share of mature workers is increasing or decreasing. The empirical results support the existence of a long-run equilibrium function between inflation and the changes in the shares of the population under 20 years of age, young adults (20–34), middle-age people (35–64), and older-old people (75+). The panel least squares equations for inflation with population age shares growth, GDP growth, M2 growth, exchange rate growth, labour costs and recession dummy variables as exogenous regressors allow the identification of the population shares that have positive significant impact on inflation, and those that have negative significant effects on inflation.
1. Introduction
A considerable amount of literature exists that discusses the impact of aging on the economy, particularly on macroeconomic performance. Some consensus has developed around the difficulties that the advanced stages of population aging create for economic growth and fiscal balance, although the scale of these difficulties is also subject to different evaluations. The same degree of consensus does not exist with respect to other variables, such as the effect of population aging on inflation. In this study, we analyse the main reasons identified in the literature to verify the inflationary or disinflationary nature of population aging. Is population aging responsible for low levels of inflation in many OECD countries, despite substantial monetary policy stimulus? Population ages because the share of young people decreases, and the share of older people increases with or without a change in the proportion of middle-aged individuals. Can we really speak of one effect of population aging on inflation?
We investigate the relationship between population aging and inflation using panel cointegration methods. Cointegration techniques (such as the Engle-Granger or the Johansen approach) to test the presence of long-run relationships between population aging and inflation for individual time series have only recently been used in the empirical literature (Bobeica, Lis, Nickel, & Sun, Citation2017). We apply the Pedroni, Kao, and Fisher panel cointegration tests using unbalanced panel data of 24 OECD countries from 1961 to 2014 to examine the long-run equilibrium relationship between inflation and the age structure of the population.
The paper proceeds in four sections. Section 1 introduces the topic. Section 2 reviews the literature that relates demographics with pressure on inflation. Section 3 provides the data, a brief description of the methodology, and reports the empirical findings. Finally, section 4 presents the main conclusions of the research.
2. Demographics and pressure on inflation
2.1. The theoretical relationship between demographics and pressure on inflation
There are two types of arguments for the effect of population aging on inflation: economic arguments and a political-economic argument.
The political-economic argument is simple: aging increases the share of older individuals, who favour price stability more than younger generations do to protect the real value of their savings and fixed income securities holdings (Bullard, Garriga, & Waller, Citation2012; Davis, Citation2005; Fujiwara, Hori, & Waki, Citation2019; Katagiri, Konishi, & Ueda, Citation2014). Therefore, this increasingly larger group of inflation-averse people will attempt to influence the government to choose tax-financed public debt, which typically harms younger people more, instead of allowing inflation. The fact that older generations tend to have higher voter turnout rates reinforces their political influence.
The economic arguments are more diverse and complex, especially when one considers the direct and indirect effects, and the potential interaction of mechanisms. The change in the age structure of the population is linked in several ways with the evolution of prices or inflation.
The discernment regarding the effect of population aging on inflation can be blurred by the different understanding concerning what population aging is. As it represents a process which combines lower fertility rates with lower mortality rates and longer longevity, the demographic transition goes through phases. Together with an unquestionable decrease in the proportion of young people and an increase in the proportion of older people who are categorized as being in a typically inactive status with regards to their participation in the labor market, there is some amplitude in categorizing aging in terms of the respective share of prime-age workers and of older workers. Aging implies that workers become older but only in an advanced phase, when individuals who become workers are insufficient to compensate those who reach retirement age, does it lead to a reduction in the total labor supply. In addition, when expressed as a proportion of total population, the category of older workers can increase or decrease, which may modify the conclusion regarding how population aging affects inflation.
We first present the main economic arguments that can be found in the literature to justify a positive pressure of population aging on inflation, and next, we describe the main economic arguments which justify the opposite.
Because excess demand drives inflation up and excess supply leads to a decrease in inflation, when aging is considered to be responsible for the creation of excess demand, it is argued that aging is inflationary. In the economy, excess demand can arise for several reasons.
Firstly, according to the life-cycle hypothesis (Ando & Modigliani, Citation1963), individuals use inter-temporal reallocations of the typically hump-shaped pattern of income to smooth consumption over the lifetime. Consequently, their savings are below consumption during younger years, and again so after retirement, and they peak during the middle-age categories. If the aging process is in a phase when net savers become less abundant, that is to say, when the reduction in the young categories is insufficient to offset the reduction of middle-aged workers together with the increase in the share of retirees, the propensity to save in the economy decreases, which corresponds to an increase in the propensity to consume (Aksoy, Basso, Grasl, & Smith, Citation2015; Bruér, Citation2002; Juselius & Takáts, Citation2016; Lindh & Malmberg, Citation1998, Citation2000). Excess demand is generated in cases when frictions impede interest rates from automatically adjusting to equalise investment to savings.
Secondly, even if the share of older workers has not yet started to decrease, these workers tend to earn wages above their productivity levels (llmakunnas and Maliranta Citation2005; Lazear, Citation1979, Citation1981), and this enables them to consume more than they produce (Skirbekk, Citation2004), which contributes to excess demand.
Thirdly, excess demand can be a result of a tighter labor market, where the aging process is already reducing the proportion of the working-age population. Consequently, this scarcity of labor can lead to an increase in wages by more than the respective productivity gains (Serow, Citation1982), which then creates an increase in consumption demand, as well as an increase in labor costs and supply side inflation (Spengler, Citation1972).
The fourth reason for supply being unable to accompany demand is the general reduction in the productivity growth of the economy as a result of a change in those industries that become more important. Service industries, where productivity gains are frequently more difficult to achieve, are more stimulated by aging than manufacturing is (Spengler, Citation1972).
Finally, the increase in public expenditures like pensions and healthcare, together with a reduction in labor income tax revenue if the working-age population is already shrinking, can possibly create or enlarge fiscal deficits and public debt. High debt levels create incentives to use inflation as a means to reduce the real debt, which consequently creates inflationary pressures if it is monetized, or is expected to be monetized (Anderson, Botman, & Hunt, Citation2014).
Although all the above-mentioned mechanisms are inflationary forces exerted by population aging, these forces can be neutralized by other opposing effects. In the first place, it is possible that aging does not reduce aggregate savings in the economy, owing to the fact that families can afford to save more, as a consequence of having less children, and also because workers increase their savings to prepare for longer retirement periods (Fedotenkov, Citation2016), or because people do not dissave that much when they retire (Poterba, Citation1994). Additionally, a higher propensity to consume by a larger category of retirees may not really stimulate demand if their purchasing power is low (Faik, Citation2012). Furthermore, expectations can play a role, even before demographic changes justify the onset of an economic slowdown. Because aging societies are associated with lower economic growth prospects – due to a reduced growth (eventually negative growth) in the labor supply, together with the potentially lower productivity levels which are associated with older workers (Fujita & Fujiwara, Citation2016) and also a sectoral shift in consumption patterns (Katagiri, Citation2012) – the forward-looking actors in the economy accordingly reduce aggregate demand (Shirakawa, Citation2012). In particular, the expected real return on investments decreases, which generates a lower demand for private investment (Carvalho, Ferrero, & Nechio, Citation2016; Eichengreen, Citation2015) and a lower natural interest rate.Footnote1 If monetary authorities fail to lower real interest rates accordingly, deflationary pressure will then develop (Katagiri, Citation2012). The rise in fiscal deficits and debt, rather than creating inflationary pressure, can justify the need for fiscal consolidation, which in turn reinforces lower growth prospects (Anderson et al., Citation2014).
All the above-mentioned cases represent motives for the inoperativeness of the excess demand effect, which is compatible with the so-called secular stagnation hypothesis (Hansen, Citation1939; Summers, Citation2016) that emphasizes the negative effect on the growth prospects of aged economies.
Therefore, in theoretical terms, the two views – that aging is inflationary and that aging is disinflationary – are both reasonable. The problem is that population aging affects many variables in many ways, and consequently, the result depends on the relative size of the changes and also on the consideration of feedback mechanisms and of the policy responses to these changes. That is why, for example, it is possible to cite a decrease in the growth of labor supply as a reason for inflationary pressure, which leads to an increase in aggregate demand – with a rise in real wages – and a decrease in aggregate supply, but it is also possible to argue that this is as a reason for disinflationary, or even deflationaryFootnote2 pressure, reducing growth prospects, with a consequent negative impact on aggregate demand. If both demand and supply decrease, the consequent effect on prices must be a result of the relative forces, which is not obvious a priori.
2.2. The empirical relationships between demographics and pressure on inflation
On the empirical side, it is possible to analyse the effect of population aging by looking at different demographic indicators: single value indicators (for example, average age, life expectancy, or dependency ratiosFootnote3), or age distributions (for example, the shares of different age groups). According to the arguments that an advanced stage of population aging has an inflationary effect, a decrease in the share of the working-age population – particularly that of middle-aged individuals – should be inflationary, as well as the increase in the share of retirees. Although the decrease in the share of youth (dependents or young workers) should drive inflation down, this effect would probably be smaller than the other effects when population aging is at a mature stage. This should also correspond to an inflationary force which is associated with an increase in the dependency ratios. If the opposite results are obtained, then the advance of population aging should have a disinflationary effect.
, in the Appendix, summarizes some of the most relevant empirical studies, the sample and methods that were used, and also their main results. It is possible to see that most of the studies find that an increase in the share of middle-aged people decreases inflation (Aksoy et al., Citation2015; Andrews, Oberoi, Wirjanto, & Zhou, Citation2016; Broniatowska, Citation2017; Bruér, Citation2002; Farvaque, Héricourt, & Lagadec, Citation2010; Juselius & Takáts, Citation2015, Citation2016, Citation2018; Lindh, Citation2004; Lindh & Malmberg, Citation1998, Citation2000; McMillan & Baesel, Citation1990). Only Bobeica et al. (Citation2017) find a positive long-run relationship between the growth of the share of working-age population and inflation.
When analyzing the effect of having a higher proportion of older individuals, there is a higher heterogeneity of conclusions. Yoon, Kim, and Lee (Citation2018), Gajewski (Citation2015), and Broniatowska (Citation2017) find that older individuals have a disinflationary role, while McMillan and Baesel (Citation1990), Juselius and Takáts (Citation2015, Citation2016, Citation2018), and Aksoy et al. (Citation2015) find that they have an inflationary role. Several studies divide the group of older individuals into the young-old and the older-old, where the former are inflationary and the latter are disinflationary if anything (Andrews et al., Citation2016; Bruér, Citation2002; Farvaque et al., Citation2010; Juselius & Takáts, Citation2016; Lindh, Citation2004; Lindh & Malmberg, Citation1998, Citation2000).
In terms of methodology, the study that is closer to ours is Bobeica et al. (Citation2017). However, we are interested in a potentially different effect of the young-old and of the older-old on inflation, so we use age categories that allow us to observe that difference, in case it exists. Bobeica et al. (Citation2017) choose to look only at the effect of the proportion of working-age population. Also, they employed the Johansen cointegration test for individual time series to study the relationship between demographic change and inflation in the euro-area countries. As noted by Pedroni (Citation2004) among others, when the cross-sectional dimension is large, theory suggests that cointegration tests are more powerful when applied to pooled time series panels than to individual time series, so we apply the tests to each country individually, but also to pooled time series panels. On the other hand, some panel cointegration tests allow for heterogeneity across cross-sections.
3. Empirical specifications
3.1. Data and variables
Our data covers the period from 1961 to 2014 (54 years of annual observations) for 24 OECD countries: Australia (AU), Austria (AT), Belgium (BE), Canada (CA), Denmark (DK), Finland (FI), France (FR), Germany (DE), Greece (GR), Iceland (IS), Ireland (IE), Italy (IT), Japan (JP), South Korea (KR), Luxembourg (LU), the Netherlands (NL), New Zealand (NZ), Norway (NO), Portugal (PT), Spain (ES), Sweden (SE), Switzerland (CH), the United Kingdom (UK), and the United States of America (US).
Our variable of interest is the yearly inflation rate measured as the annual percentage change in the consumer price index (INFL). We gathered data on inflation for most countries from the World Development Indicators database. Data for Germany were taken from Worldwide Inflation Data, and for the United Kingdom, from the World Economic Outlook (IMF dataset).
Demographic data were obtained from the 2015 Revision of World Population Prospects (United Nations, Citation2015). We considered the growth rates of 5 age categories that approximately match the different phases of life from the life cycle perspective: share of children and youth under 20 years old (P19-), share of young adults from 20 to 34 years old (P20-34), share of middle-aged people from 35 to 64 (P35-64), share of young-old people (P65-74), and share of older-old people (P75+).
M2 growth data, defined as being the average annual growth rate in money and quasi money, were based on WDI database and extended in terms of time coverage, by using the IMF International Financial Statistics, the Economic Research Division of Federal Reserve Bank of St. Louis, Data Market, the National Bank of Greece and the Knoema data platform. GDP growth corresponds to the annual percentage growth rate of GDP converted at Geary Khamis PPPs,Footnote4 which were obtained from The Conference Board Total Economy Database (TED). Exchange rates are the price of the US dollar in national currencies, taken from the OECD database. Labor costs were obtained from the AMECO database (European Commission).
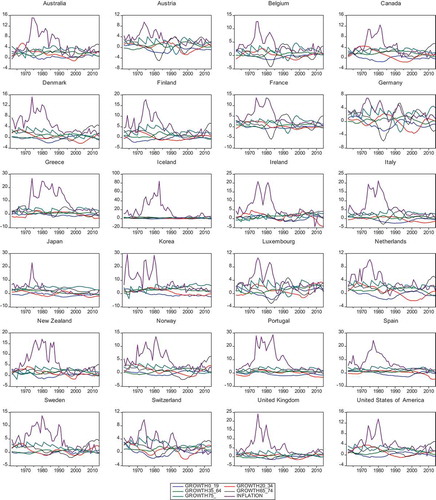
depicts the evolution of inflation and the growth rates of each age share for each country. All countries experienced substantially higher inflation rates during the first half of the sample period than during the second half. The pattern of changes in the weights of different age categories varies considerably by country, but it is common to observe a negative growth rate in the youngest shares during a sizeable part of the period. Also common is the decrease in the growth rate of the share of middle-aged people in recent years, frequently turning negative.
Figure 1. Inflation and population growths (P19-, P20-34, P35-64, P65-74 and P75+) time series in the period 1961–2014.
3.2. Methodology: panel unit root and panel cointegration
We are interested in testing the long-run relationship between inflation and the age structure of population, given that demographic changes are slow-moving processes. This is possible using cointegration techniques. We overcome the low power of many cointegration tests using time series data, by applying them to panel data. Before applying this methodology, we must first test the stationarity properties of the data and the order of integration of the variables.
3.2.1. Panel unit root tests
We use the three-step procedure of Levin, Lin, and Chu (Citation2002) to implement the panel test. They recommend using their panel unit root test for panels of moderate size. Maddala and Wu (Citation1999) and Choi (Citation2001) propose an alternative approach to panel unit root tests based on a Fisher-type test, which combines the p-values from unit root tests for each cross-section to test for a unit root in the panel. We computed both the asymptotic χ2 and standard normal cumulative statistics using ADF and PP individual unit root tests.
reports the estimates of the probabilities for both the individual and panel unit root tests for inflation and population growth (P19-, P20-34, P35-64, P65-74 and P75+). We performed all unit root tests with a constant intercept and trend in the test equation, except for inflation, which included an individual intercept only.
Table 1. Individual (ADF) and panel (LLC, ADF and PP) unit root tests.
Based on the ADF unit root tests for individual cross-sections, the null hypothesis of a unit root for inflation is not rejected at the 1% level for all countries in the sample, and it is also not rejected for the demographic variables for most countries. The P75+ seems to be stationary for FI, LU, IE, JP, PT, and the UK at the 5% level. Based on the panel unit root tests, the PP statistic also supports the null hypothesis at the 1% level of a common unit root for INFL and demographic variables P19-, P20-34, P35-64, and P65-74 in the country panel. Based on the ADF test, we reject the null hypothesis that the panel demographic series P65-74 and P75+ exhibit a unit root (or are nonstationary) at the 1% level.
3.2.2. Testing for panel cointegration
We apply the group and panel ADF and PP statistics of the Pedroni panel cointegration test (Pedroni, Citation1999, Citation2004) and the Kao panel cointegration test (Kao, Citation1999; Kao & Chiang, Citation2000) to the residuals of the pooled regressions. The Pedroni and Kao tests are based on the Engle & Granger (Citation1987) framework.
Both cointegration tests (Pedroni and Kao) include an individual intercept (no trend) in the test regressions. provides the results. Both panel statistics (ADF and PP) reject the null hypothesis of no cointegration for all panels at the 5% level (except the panel ADF-statistic for panel INFL and P65-74), and the Kao statistic suggests rejecting the null hypothesis of no cointegration for all panels at the 5% level.
Table 2. Pedroni and Kao panel cointegration tests.
Following Johansen’s (Citation1995) methodology, Maddala and Wu (Citation1999) proposed a Fisher-type test for cointegration in panel data by combining tests from individual cross-sections. In our study, we apply Maddala and Wu’s (Citation1999) approach to examine the existence of cointegration relationships for the whole panel and for each individual country.
presents the trace and the maximum eigenvalue statistics for the Johansen Fisher panel cointegration test for entire panels. The test strongly rejects the null hypothesis of zero cointegrating vectors at the 5% level in the panel, except for the INFL and P65-74 panel cointegration. In short, we can conclude that two panel cointegration tests (Pedroni and Johansen Fisher tests) provide evidence of a long-run equilibrium function between panel series INFL and P19-, INFL and P20-34, INFL and P35-64, and INFL and P75+.
Table 3. Johansen panel cointegration tests: number of cointegrating relationships.
3.2.3. Panel estimation
We estimate an unbalanced panel least squares model assuming the presence of cross-section heteroskedasticity (see Baltagi, Citation2008, for further discussion) for inflation (INFL) using population age share growth (P19-, P20-34, P35-64, P65-74, P75+), GDP growth (GDP_GROWTH), M2 growth (M2_GROWTH), exchange rate growth (EXCHRATE_GROWTH), labor costs (LABOR_COSTS) and three time-dummies for 1975 (DUM_1975), 1980 (DUM_1980) and 2009 (DUM_2009), associated with deep recessions, as explanatory variables. The specification of the panel equation is as follows:
where is the overall constant,
and
represent cross-section and period-specific effects,
is the vector of slope parameters,
is the vector of current and lagged values of exogenous variables and
is the disturbance term.
We compute robust standard estimates using the white period as the coefficient covariance method (Arellano, Citation1987; White, Citation1980). We perform an F-test using the residual sums of squares and a likelihood ratio Chi-square to test the joint significance of the cross-section effects. Additionally, we perform a redundant variable test to examine the redundancy of demographic variables in each panel equation. reports the results.
Table 4. Panel least squares estimates for the entire panel of countries. Dependent variable: inflation.
From the estimated panel equations, we conclude that P20-34, P65-74 and P75+ have a positive significant impact on inflation, whereas P35-64 have negative significant effects on inflation. However, the population share growth of middle-age (P35-64), young-old (P65-74), and older-old (P75+) only affect inflation after two or three years. The inflationary effect of the 65–74 age category was an expected result. On the one hand, the regression coefficient is significant only at the 10% level and, on the other hand, cointegration tests with inflation did not allow for a completely unequivocal conclusion.
The other exogenous variables (including the recession dummy variables) are also statistically significant at the conventional significance levels and have signs consistent with economic theory. The p-value associated with the cross-section F-statistic values strongly rejects the null hypothesis of no cross-section effects. For all panel equations, we reject the null hypothesis that including the demographic variables is redundant in the unrestricted specifications.
Although most of the countries have individual demographic effects similar to the effects obtained for the panel, there are some exceptions. For example, the strong result of an inflationary age category P20-34 is not valid for Sweden. The negative effect of P35-64 is not observed for Japan, Korea, and Portugal.
4. Discussion and conclusion
The association of population aging with deflationary pressure, or at least disinflationary pressure, has gained prevalence in the public debate. Nevertheless, there are multiple channels through which population aging can influence inflation, some of which have opposite or ambiguous effects, which results in the need for empirical research to discover whether the change in the structure of the population associated with aging really does have a significant effect on inflation, and if so, in which direction.
This study addresses the empirical problem using a panel cointegration analysis. We show that the existence of long-term cointegration relationships between inflation and the growth rates of the younger and middle-age categories is generally confirmed, whereas our results differ regarding the relation between inflation and the older age categories. In particular, some of our tests did not reject the hypothesis of no cointegration between the P65-74 age category and inflation. The panel least squares estimates are particularly interesting in that they supply information about the sign of the effects of the changes in the age categories on inflation. We reveal the clear inflationary pressure of an increase in the proportion of the younger category of working-age population and the existence of inflationary pressure with a time lag also in the case of the older categories. We also find that growth in the 35–64 age category creates disinflationary pressure, with a certain time lag.
These results are in agreement with the view that an advanced stage of population aging, where working-age categories are decreasing in importance and the older categories gain weight, is inflationary. They also provide suggestive support to the life cycle hypothesis, which leads to the prediction that the population aged between 20 and 34, who typically starts a family and buys a house and other durables, by consuming more than they produce should be inflationary, whereas the middle-aged population, which is typified by high savers who consume a smaller share of their incomes, should create disinflationary pressure. The inflationary role of the older individuals is also consistent with the life cycle hypothesis.
The other justifications for the positive impact of aging on inflation also predict that an increase in the share of individuals in retirement-age is inflationary, but they do not explain why young workers are also inflationary. We find no evidence of a political-economic effect, neither of a demographically motivated secular stagnation effect, on inflation.
The inflationary pressure of the older-old is a result that is more solid than the inflationary effect of the young-old, because the coefficient of the oldest age group in the panel estimation has a higher significance level and also because the existence of a long-run correlation with inflation looks undisputable. The propensity to consume is higher for the older-old, who are much more likely to dissave, due to the fact that health expenditures and social care expenditures tend to become a significantly larger part of their income.
The signs of the age coefficients are generally preserved across countries in each of the panel regression models, although there are some exceptions. It is outside the scope of this work to discuss the source of these deviations from the general pattern, although it is possible that cultural factors or differences in the protection level of welfare states or in financial systems exert an influence.
In conclusion, this study shows the existence of a clear relation between demographic structure and inflation which is a positive result, not only because it helps clarify the forces that drive long-term inflation, but also because demographic variables are easier to forecast than most economic variables. The variables included in the reaction function used in the conduct of monetary policy should be reassessed in the light of demographic developments. Considering this, what can we identify as being the effect of population aging on inflation according to our results? It is necessary to understand the dynamics of aging in the economy and which age groups are changing more. For example, a faster reduction in the proportion of youths acts as a disinflationary element, as does a more rapid increase in the proportion of middle-aged people, whereas if population aging is marked by an accentuated increase in the older ages – particularly the group of over 75 year olds – and there is already a reduction in the middle-aged groups, then the effect is inflationary. It should be taken into account that the extension of the retirement age in many OECD countries may contribute to gradual changes in the contribution of the 30–64 and 65–74 age groups to both negative and positive effects on inflation.
Disclosure statement
No potential conflict of interest was reported by the authors.
Additional information
Funding
Notes on contributors
Paula C. A. M. de Albuquerque
Paula C. A. M. de Albuquerque holds a PhD degree in Economics and she is professor at ISEG, the school of Economics and Management of the University of Lisbon. She is a member of SOCIUS – Research Centre in Economic and Organizational Sociology – and of CSG – Research in Social Sciences and Management. Her main research interest is Population Ageing and she published several articles in academic journals as well as chapters in books, in this field. She has also been acting as referee of international peer review journals. She is responsible for the organization of the International Workshop on the Socio-Economics of Ageing, a scientific event that takes place every two years, whose first edition was in 2009.
Jorge Caiado
Jorge Caiado has a Ph.D. in Applied Mathematics to Economics and Management. He is a Professor of Econometrics and Forecasting Methods at the Lisbon School of Economics and Management (ISEG) and Researcher at the Centre for Applied Mathematics and Economics. His research in econometrics, finance, time series analysis, forecasting methods and statistical software has led to numerous publications in scientific journals and books. He is serving as econometric and statistical consultant and trainer for numerous companies and organizations including central banks, commercial and investment banks, bureau of statistics, bureau of economic analysis, transportation and logistics companies, health companies and insurance companies. He is also co-founder and partner of GlobalSolver.
Andreia Pereira
Andreia Pereira, currently working at Servdebt as Financial Analyst, has over six years of experience dealing with investments in distressed assets. Andreia holds a master’s degree in Monetary and Financial Economics from Lisbon School of Economics and Management (ISEG) and a post-graduation course in Corporate Finance from Nova SBE.
Notes
1 The natural rate of interest is the real interest rate consistent with full employment of resources and the absence of price pressure.
2 Some studies, particularly those that focus on Japan, choose “deflationary pressure” as the opposite of “inflationary pressure”, while others use “disinflationary pressure”, and still others use both terms. “Disinflationary” is a more general term, referring to the effect of reduction of the inflation rate, which includes the possibility of a reduction to negative levels, or deflation.
3 Dependency ratios compare the number of people considered of nonworking age (youth and/or older people) with the working-age population.
4 A hypothetical unit of currency that has the same purchasing power parity as the U.S. dollar for a given year, in this case 1990.
References
- Aksoy, Y., Basso, H., Grasl, T., & Smith, R. (2015, January) Demographic structure and macroeconomic trends (Birkbeck Working Paper No. 1501).
- Anderson, D., Botman, D., & Hunt, B. (2014) Is Japan’s population aging deflationary? (IMF Working Paper No. 14/139). International Monetary Fund.
- Ando, A., & Modigliani, F. (1963). The ”life cycle” hypothesis of saving: Aggregate implications and tests. The American Economic Review, 53(1), 55–84.
- Andrews, D., Oberoi, J., Wirjanto, T., & Zhou, C. (2016) Investigating the link between population aging and deflation. Society of Actuaries research report. Retrieved from https://www.soa.org/Research/Research-Projects/Finance-Investment/2016-investigating-population-aging-deflating.aspx
- Arellano, M. (1987). Computing robust standard errors for within-groups estimators. Oxford Bulletin of Economics and Statistics, 49, 431–434.
- Baltagi, B. H. (2008). Econometric analysis of panel data (4th ed.). West Sussex: John Wiley & Sons.
- Bobeica, E., Lis, E., Nickel, C., & Sun, Y. (2017) Demographics and inflation (ECB Working Paper Series No. 2006).
- Broniatowska, P. (2017). Population aging and inflation. Journal of Population Aging, 1–15. doi:10.1007/s12062-017-9209-z
- Bruér, M. (2002). Can demography improve inflation forecasts? The case of Sweden. Working Paper Series No. 4. Uppsala University, Department of Economics.
- Bullard, J., Garriga, C., & Waller, C. (2012). Demographics, redistribution, and optimal Inflation. Federal Reserve Bank of St. Louis Review, 94(6), 419–439.
- Carvalho, C., Ferrero, A., & Nechio, F. (2016). Demographics and real interest rates: Inspecting the mechanism. European Economic Review, 88(September), 208–226.
- Choi, I. (2001). Unit root tests for panel data. Journal of International Money and Finance, 20(2), 249–272.
- Davis, E. (2005). Challenges posed by aging to financial and monetary stability. The Geneva Papers, 30(4), 542–564.
- Eichengreen, B. (2015). Secular stagnation: The long view. American Economic Review, 105(5), 66–70.
- Engle, R., & Granger, C. (1987). Co-integration and error correction: Representation, estimation, and testing. Econometrica, 55(2), 251–276.
- Faik, J. (2012) Impacts of an aging society on macroeconomics and income inequality – The case of Germany since the 1980s (Society for the Study of Economic Inequality Working Papers Series No 2012-272).
- Farvaque, E., Héricourt, J., & Lagadec, G. (2010). Central bank independence and aging. Applied Economics Letters, 17(12), 1167–1171.
- Fedotenkov, I. (2016) Population aging and inflation with endogenous money creation. Lietuvos Bankas WP 23/2016
- Fujita, S., & Fujiwara, I. (2016) Declining trends in the real interest rate and inflation: The role of aging (FRB of Philadelphia Working Paper No. 16-29).
- Fujiwara, I., Hori, S., & Waki, Y. (2019) Generational war on inflation: Optimal inflation rates for the young and the old (RIETI Discussion Paper Series 19-E-021).
- Gajewski, P. (2015). Is aging deflationary? Some evidence from OECD countries. Applied Economics Letters, 22(11), 916–919.
- Hansen, A. (1939). Economic progress and declining population growth. American Economic Review, 29(1), 1–15.
- Ilmakunnas, P., & Maliranta, M. (2005). Technology, labour characteristics and wage‐productivity gaps. Oxford Bulletin of Economics and Statistics, 67(5), 623–645.
- Johansen, S. (1995). Likelihood-based inference in cointegrated vector autoregressive models. Oxford: Oxford University Press.
- Juselius, M., & Takáts, E. (2015) Can demography affect inflation and monetary policy? ( BIS Working Papers No. 485). Bank for International Settlements.
- Juselius, M., & Takáts, E. (2016) The age-structure–inflation puzzle (Bank of Finland Research Discussion Paper 4/2016).
- Juselius, M., & Takáts, E. (2018) The enduring link between demography and inflation (BIS Working Papers No. 722). Bank for International Settlements.
- Kao, C. (1999). Spurious regression and residual-based tests for cointegration in panel data. Journal of Econometrics, 90(1), 1–44.
- Kao, C., & Chiang, M. (2000). On the estimation and inference of a cointegrated regression in panel data. Advances of Econometrics, 15, 7–51.
- Katagiri, M. (2012) Economic consequences of population aging in Japan: Effects through changes in demand structure (Institute for Monetary and Economic Studies (IMES) Discussion Paper Series 12-E-03). Bank of Japan.
- Katagiri, M., Konishi, H., & Ueda, K. (2014) Aging and deflation from a fiscal perspective (Waseda Institute of Political Economy (WINPEC) Working Paper Series No. E1413). Waseda University.
- Lazear, E. (1979). Why is there mandatory retirement? The Journal of Political Economy, 87(6), 1261–1284.
- Lazear, E. (1981). Agency, earnings profiles, productivity, and hours restrictions. American Economic Review, 71(4), 606–620.
- Levin, A., Lin, C., & Chu, C. (2002). Unit root tests in panel data: Asymptotic and finite-sample properties. Journal of Econometrics, 108(1), 1–24.
- Lindh, T. (2004). Medium-term forecasts of potential GDP and Inflation using age structure information. Journal of Forecasting, 23(1), 19–49.
- Lindh, T., & Malmberg, B. (1998). Age structure and inflation – A Wicksellian interpretation of the OECD data. Journal of Economic Behavior & Organization, 36(1), 19–37.
- Lindh, T., & Malmberg, B. (2000). Can age structure forecast inflation trends? Journal of Economics and Business, 52(1–2), 31–49.
- Maddala, G., & Wu, S. (1999). A comparative study of unit root tests with panel data and a new simple test. Oxford Bulletin of Economics and Statistics, 61(S1), 631–652.
- McMillan, H., & Baesel, J. (1990). The macroeconomic impact of the baby boom generation. Journal of Macroeconomics, 12(2), 167–195.
- Pedroni, P. (1999). Critical values for cointegration tests in heterogeneous panels with multiple regressors. Oxford Bulletin of Economics and Statistics, 61(s1), 653–670.
- Pedroni, P. (2004). Panel cointegration: Asymptotic and finite sample properties of pooled time series tests with an application to PPP hypothesis. Econometric Theory, 20(3), 597–625.
- Poterba, J. (1994). Introduction. In J. Poterba (Ed.), International comparisons of household saving (pp. 1–10). Chicago: Chicago University Press.
- Serow, W. (1982). On demographic aging, inflation, and real wages: Some evidence from the Netherlands. Atlantic Economic Journal, 10(2), 23–30.
- Shirakawa, M. (2012). Demographic changes and macroeconomic performance: Japanese experiences. Monetary and Economic Studies, 30(November), 19–38.
- Skirbekk, V. (2004). Age and individual productivity: A literature survey. In G. Feichtinger (Ed.),Vienna yearbook of population research (pp. 133–153). Vienna: Verlag der Österreichischen Akademie der Wissenschaften.
- Spengler, J. (1972). Prospective population change and price level tendencies. Southern Economic Journal, 38(4), 459–467.
- Summers, L. (2016). The age of secular stagnation: What it is and what to do about it. Foreign Affairs, 95(2), 2–9.
- United Nations. (2015). World population prospects: The 2015 revision. New York: Department of Economic and Social Affairs, Population Division.
- White, H. (1980). A heteroskedasticity-consistent covariance matrix estimator and a direct test for heteroskedasticity. Econometrica, 48(4), 817–838.
- Yoon, J., Kim, J., & Lee, J. (2018). Impact of demographic changes on inflation and the macroeconomy. KDI Journal of Economic Policy, 40(1), 1–30.
Appendix
Table A1. Econometric models (not simulation-based) relating to demographics and inflation.