
 ?Mathematical formulae have been encoded as MathML and are displayed in this HTML version using MathJax in order to improve their display. Uncheck the box to turn MathJax off. This feature requires Javascript. Click on a formula to zoom.
ABSTRACT
Uncertainty affects employers’ decisions about their workforce as well as capital. We exploit differences in how firms change the size of their workforce when uncertainty increases. Using data from the Wage Dynamic Network Survey for 25 European countries, we first construct, unlike the usual aggregate indicators, a set of uncertainty indicators exploiting each firm’s microeconomic environment. We combine variability from the country, sector and size of the firm. Secondly, we investigate the effect of uncertainty on a firm’s strategies to adjust labour through hiring and firing. The results reveal that firms reduce hiring and recur to individual layoffs more frequently when uncertainty increases. An increase of one standard deviation in the uncertainty indicator is associated with an increase in the probability of having frozen hiring by from 9% to 16% of a standard deviation. We also find more significant effects when firms face credit constraints and labour adjustment costs are higher.
1. Introduction
The study of the effects of uncertainty on economic performance has been renewed since the Great Recession, in both theoretical and empirical research. Recent episodes hitting the international economy, such as Brexit and the current COVID-19 pandemic, have contributed to highlighting the importance of understanding the economic effects of uncertainty (Altig et al., Citation2020). After all, uncertainty shocks are one of the most important factors behind fluctuations in the growth of real GDP .Footnote1 Several channels might explain how uncertainty affects economic activity, causing economic activity to slow down and to contract by freezing investment through “wait and see” episodes. As for investment, uncertainty might also have consequences on firms’ allocation of labour and, consequently, on the labour market.Footnote2 Consequently, uncertainty might also reduce hiring and job creation and might increase quits and layoffs. Studying its effects on firms’ labour decisions is especially important in countries where the unemployment rate responds more intensely to changes in aggregate demand.
The effects of uncertainty have been generally addressed from a macroeconomic standpoint. However, decisions made by firms facing an uncertain environment should also be considered from a more disaggregated perspective. If firms react in a specific way towards a changing environment, then we will understand how they will adjust their labour strategies and in what way the impact of an increase in the volatility to which the firm is exposed will definitely affect its particular activity. This way we will be able to understand whether firms from specific countries, industries and with specific characteristics (such as large or small) are more sensitive to reducing hiring or increasing firing when uncertainty increases. Constructing an indicator of the particular volatility that the firm faces in its specific environment and with its particular characteristics will lead us to design strategies to cope with the negative effects that this might have. It will also help us to know more about the sources of uncertainty that affect a firm and understand how firms adjust their labour workforce and what other mechanisms they commonly use when uncertainty increases. It will also help to complement the abundant literature on the macroeconomic effects of uncertainty with information about the microeconomic effects.
This paper exploits novel data on European companies in 25 countries to design, for the first time, a new indicator of uncertainty taking into account specific firms’ characteristics and close environment. We construct the uncertainty indicators as the standard deviations of subjective responses made by firms to perceive variations in activity by categories conforming to crossing the country, sector and size of the firm. Specifically, we compute the degree of disagreement about questions about changes in demand and activity that the firms have perceived, using standard deviations. This allows us to proxy the realized volatility that the firm has faced in its close environment, and not only the macroeconomic uncertainty. We are also able to identify the source of the uncertainty shock (if it has to do with the country conditions, with the sector in which the firm operates, or with the type of firm). Then, we study whether this perceived volatility affects a firm’s decisions about the labour adjustment mechanisms followed by the firm. We also study what type of adjustment mechanism is used by the firm to cope with the effect of an increase in uncertainty and if it is different for countries with stricter employment protection legislations.Footnote3 Finally, we also compare these results with an additional exercise regarding the impact of specific uncertainty shocks over a few years on a sample of firms in a few countries that responded this question, which also permits disentangling the effects of an increase in volatility potentially due to other macroeconomic asymmetric shocks or policies.
Our contribution to the previous evidence is based on two dimensions. Firstly, we propose a new set of disaggregated uncertainty indicators, exploiting information at many levels: 25 countries, 5 sectors, and 4 different sizes of the firm. It better captures the microeconomic environment that the firm is facing, unlike more aggregated macroeconomic indicators. Secondly, we investigate the role of uncertainty in the labour market decisions made by firms. Uncertainty might lead to a reduction of labour stock. If adjustment costs are important or the firm faces credit constraints, it might be optimal for firms to no longer adjust their employees but to wait. Therefore, in those countries with a higher level of employment protection (where firms face higher costs for labour adjustments), firms might be more reluctant to layoff or fire when uncertainty increases but they also might be more reluctant to hire workers.
The main results of this paper reveal that firms tend to reduce hiring and increase the adjustment of labour demand with more frequency when uncertainty is higher. An increase of one standard deviation in uncertainty increases the probability of having frozen hiring by around 9% to 16% of a standard deviation during the period 2010–2013. Furthermore, other labour strategies have been also used by firms, such as altering the labour workforce or not renewing temporary contracts: while the probability of recurring to individual layoffs seems also clear, the non-renewal of temporary contracts seems to be just the opposite, with no significant effect when uncertainty is higher. Finally, significant effects have also been observed for financially constrained firms and in countries with a stricter employment legislation, that have higher labour adjustment costs. In these cases, we find that freezing hiring responds with more intensity to increases in uncertainty so that firms are more likely to reduce hiring when adjustment costs are higher.
The remainder of this paper is as follows. Section 2 presents a review of the previous evidence about the effects of uncertainty in the literature. Section 3 describes the construction of the uncertainty indicators, with its disaggregation in several dimensions. Section 4 explains the data used to construct the indicators and used in the empirical part. Section 5 presents the estimated model and its main results, together with several robustness checks. Finally, Section 6 summarizes the main conclusions of the paper.
2. Uncertainty and its effects on a firm’s decisions
Increases in uncertainty and its effects on the economy constitute significant concerns in the study of economic fluctuations. Born, Breuer, and Elstner (Citation2018) found that up to 10% of the drop in the gross domestic product of the US and up to 0.6 percentage points of the increased unemployment rates in 2009 through 2011 are explained by macroeconomic and financial uncertainty. As explained in Caldara, Fuentes-Albero, Gilchrist, and Zakrajsek (Citation2016), with the depth and duration of the 2008–2009 financial crisis in the world economy, traditional sources of business cycle fluctuations have become more hesitant. As a consequence, recent evidence has focused on a combination of financial or uncertainty shocks as factors driving economic activity (Bloom, Citation2009; Bloom, Floetotto, Jaimovich, Saporta-Eksten, & Terry, Citation2013; Christiano, Motto, & Rostagno, Citation2014; Gilchrist, Sim, & Zakrajsek, Citation2014).
Several mechanisms might explain the downturn in activity as a consequence of increasing uncertainty. Jurado, Ludvigson, and Ng (Citation2015) mentioned the existence of three different effects of an increase in uncertainty: a “real options” effect, due to the reduction of hiring, investment or consumption; the “precautionary effect” when agents are risk averse, and a “financial frictions” effect if a higher uncertainty causes an increase in financial constraints. The classical literature pointed out that increases in uncertainty causes firms to temporarily pause their investment and hiring, which in the medium term produces a rapid drop and rebound in output and employment (Bloom, Citation2009). Bachmann and Bayer (Citation2013) and Stokey (Citation2013) have both found that uncertainty about a one-time change in a policy induces the firm to temporarily stop investing. Mecikovsky and Meier (Citation2014), using microdata from US establishments, observed that unexpected increases in uncertainty move firms to freeze investment and labour policies, adopting a progressively larger wait-and-see policy. If companies freeze and remain inactive in response to increased uncertainty, real economic activity contracts. As a consequence, wait-and-see policies reduce capital through depreciation of the existing capital stock and thereby lowers the demand for labour, which implies more layoffs and less hiring, and when it is related to financial markets, the effect is largest and more persistent. In two recent papers, Binding and Dibiasi (Citation2017) and Dibiasi, Abberger, Siegenthaler, and Sturm (Citation2018) also show, using a natural experiment after a change in the exchange rate in Switzerland, that uncertainty negatively affected investment in equipment and machinery through a real-option channel during 2009–2015. However, it positively affected expenditures in R&D through a growth-option channel. Arellano, Bai, and Kehoe (Citation2016) argued that an increase in uncertainty induces firms to downsize investment to avoid default. When firms are exposed to idiosyncratic shocks during the production process, hiring inputs are risky.
Uncertainty also plays an important role in labour market dynamics. Kandoussi and Langot (Citation2020) show that uncertainty shocks plays a major role in fluctuations in US unemployment, explaining 25% of the variance in unemployment and 20% of the variance in the job finding rate. As uncertainty is also considered by firms as a shock, our paper is also related to the literature trying to explain labour adjustments as a response to shocks. Mathä, Millard, Rõõm, Wintr, and Wyszyński (Citation2019) found that firms responding to negative shocks were most likely to reduce employment, hourly wages and hours worked, regardless of the source of the shock. These authors also show that, as firms choose the cheapest way to adjust labour costs, strict employment protection legislation make it less likely that firms reduce wages when facing negative shocks.
Credit constraints are also a significant factor in the transmission of uncertainty and volatility to firms’ activity. In the case that a firm has to fulfill financial obligations, it can also experience a costly default. In this situation, an increase in uncertainty due to an increase in the volatility of idiosyncratic productivity shocks induces firms to lower the probability of a default by reducing costs, which means definitely that the firm reduces its hiring of inputs. Therefore, in the presence of credit constraints, firms are more reluctant to hire and more cautious about taking labour decisions because of the rising costs of debt (Bonciani & Van Roye, Citation2015; Christiano et al., Citation2014; Gilchrist et al., Citation2014). Choi, Furceri, Huang, and Loungani (Citation2018) find that the impact of uncertainty on industry-level productivity growth is greater when industries have a higher dependance on external financing. During recessions, financing constraints are more important and firms switch the composition of investment, being more exposed to liquidity risks, as also predicted by Aghion, Angeletos, Banerjee, and Manova (Citation2010).
Second-wave effects are also observed empirically. Uncertainty also weakens the efficacy of both monetary and fiscal policy. Bloom, Bond, and Van Reenen (Citation2007) found that the responsiveness of firms to any given policy stimulus may be much weaker in periods of high uncertainty, which implies that the effectiveness of public policies might also be affected by episodes of increased uncertainty.
3. Database and uncertainty indicator
3.1. Database
We use data from the Wage Dynamics Network (WDN) Survey. During 2014, the national central banks of 25 European countries conducted a survey of firms about changes in their economic environment, labour decisions, wage adjustment and price-setting mechanisms. This survey was the third wave of the project coordinated by the ESCB Wage Dynamics Network. The database consists of an internationally comparable and harmonized survey of firms with one or more employees. Questions mainly refer to firms’ decisions about labour, wage and price strategies during the whole period 2010–2013. Only cross-sectional data at the firm-level is available for most of the questions. In the data, there are some questions referring to the year in which negative shocks affected demand, uncertainty or firm access to financing. However, these questions are only available for some of the countries of the database, namely, the Czech Republic, Estonia, Greece, Luxembourg, Poland, and Portugal.
Most of the information of the WDN Survey is qualitative, which implies that most of the variables are categorical. Nevertheless, there is also quantitative information about the general characteristics of the firm (country, size, industry, structure of ownership, age of the firm), the composition of its workforce (percentage of permanent workers, part-time or full-time workers, collective bargaining coverage, occupational groups) and some cost-cutting strategies (percentage of wage-cuts or percentage of workers affected by wage freezes).
In spite of its limitations, mainly due to the qualitative nature of some information and its having no time-varying variables, the WDN Survey gives rise to a large number of questions related to the perception of the changes in the level of demand and volatility of the firms, together with questions related to the financial conditions, labour adjustments and decisions taken. It is also a remarkable database with homogeneous and comparable information for 25 countries and firms of different characteristics.
The resulting sample used in this paper contains 23,539 firms with more than 5 employees, from 25 countries. presents the main descriptive statistics of the sample and the main variables and controls, together with the set of uncertainty indicators. We have introduced into the analysis variables related to the general characteristics, mechanisms for adapting to changes in economic activity (labour decisions, price decisions) and qualitative information about the firms’ performance. We have used employment weights in the subsequent analysis, since they adjust for the unequal probability of a firm’s ending up in the final sample and ensuring that the final sample also represents the employees in the population. However, we have carried out a robustness analysis using basic sampling weights and also importance weights of the WDN Survey as an alternative to control for the percentage of responses of the questionnaire.
Table 1. Descriptive statistics
a. The dependent variable of each specification are referred to the probability that the firm has recurred to freezing labour workforce (freeze), altering labour workforce (alterlabour), not renewing temporary contracts (nonrenew) or experienced financial constrains (financonstr) during the period 2010–2013.
b. Regarding controls, the variable “Decreasing level demand” specifies the proportion of firms that perceive a decrease in level demand. Likewise, “Decreasing external financing”, “Decreasing customers’ paying” and “Decreasing availability supplies” includes the proportion of firms of the sample that face a decrease of each type. Other controls, as “Mainly domestic”, “Mainly foreign”, “Parent company”, “Subsidiary/affiliate”, “Firm collective agreement”, “Other collective agreement” and “Severe foreign competition” also show the proportion of companies
Finally, we have carried out several robustness exercises for a group of countries (Estonia, Lithuania, Latvia, Slovenia, Slovakia, Hungary, Bulgaria, and Romania) with comparable information from the second wave of the WDN Survey. Furthermore, we have also estimated the model for a subsample of firms from Italy, Portugal and Spain, since labour market institutions are more similar and Employment Protection Legislation (EPL) is stricter in these countries, as we will explain in Section 4.4.
3.2. An indicator to measure uncertainty
Uncertainty is not an observable concept, which may result in several limitations when estimating its effects. While there is no single opinion on how to measure it, different proxies have been proposed in the literature.Footnote4 Traditionally, uncertainty has been addressed as a forecasting indicator from a time-varying perspective. Studying shocks to a firm’s risks makes it easier to understand bust–boom cycles. Uncertainty has aggregate effects that have been used to forecast economic activity, using single indicators by country (Bachmann, Elstner, & Sims, Citation2013; D’Amico & Orphanides, Citation2008; Ghirelli, Gil, Pérez, & Urtasun, Citation2021).
However, there is an increasing literature pointing out the challenges of using macroeconomic indicators in the analysis of the effects of uncertainty.Footnote5 Previous evidence has provided country-specific indicators of time-varying uncertainty with several measures, mainly aggregated and purely macroeconomic. Nevertheless, a more disaggregated indicator of uncertainty may capture heterogeneous effects on economic activity. Thus, it would be desirable to include sector-specific information to complement the country-specific indicators.
Our contribution relies on calculating disaggregate uncertainty indicators exploiting the environment of the firm with respect to its country, sector and size. To that end, we exploit the firms’ qualitative responses to compute uncertainty indicators () by country, sector and size of the firm, based on the degree of disagreement to “backward-looking” questions through the standard deviations of responses to questions referred to changes in their demand and in their activity. We might associate this variability with that coming from the realized volatility that the firm has faced.
The indicator is then computed as the standard deviation of the responses to the question, as follows:
where refers to the category of the firm defined by the country, sector and size of the firm,
refers to the observed values of the responses of each firm
in the specific category,
denotes the mean value for the firms belonging to the same category, and
denotes the size of the category. This indicator corresponds with the standard deviation of the responses of the firms in the same category (the average of the squared deviations about the mean of the responses in the same category). We consider 500 categories resulting from a total of 25 countries, 5 different sectors (Manufacturing, Construction, Trade, Business services and Public sector services), and 4 different firm sizes (5–19 employees, 20–49 employees, 50–199 employees and more than 200 employees).
The advantages of this indicator are varied. On the one hand, our indicator is easily comparable, not only between different countries, but also between different sectors and between several characteristics of the firm. A demand shock in a certain sector could be similar among countries with different levels of uncertainty. The analysis has hitherto considered this fact as a country shock, but our disaggregation may contribute to increase the level of variability and to use the properties available from similar firms in different countries. On the other hand, the main caveat of this new indicator is that we can not count on a time-varying indicator with the data available so far. A possible avenue of future work would be to merge uncertainty indicators with a firm-level database with time-varying information since 2013.
The WDN Survey uses a set of questions showing the perception of the economic environment. In order to focus on the analysis of the uncertainty coming from the firms’ demand, we have chosen the following questions to construct the uncertainty indicator:
Name of the question: : How did the following factors for your main product/service affect your firm’s activity during 2010–2013?
. The level of demand
. Access to external financing through the usual financial channels
. Customers’ ability to pay and meet contractual terms
. Availability of supplies from the usual suppliers
Name of the question: . How did the following factors for your main product/service evolve during 2010–2013?
. Domestic demand
. Foreign demand
. Domestic prices
. Foreign prices
The responses to each one of these questions are grouped into five different answers: strong decrease, moderate decrease, unchanged, moderate increase, strong increase. Our uncertainty indicator is constructed using the standard deviation of the responses within the category that corresponds with the country, sector and size of the firm. Consequently, we obtain the standard deviation capturing the dispersion of the responses from inside a group of companies that are divided according to these three different sources. This indicator easily gives us an idea of the degree of dispersion of companies that belong to the same sector, the same country and are similar in size. This allows us to capture the real heterogeneity at a more disaggregated level, permitting the inclusion of the variability of a firm that belongs to these categories. We use several uncertainty indicators, depending on the question used for constructing the standard deviation of the responses.Footnote6
Finally, there are some caveats to consider. First of all, our indicator is constructed based on backward-looking information and on the realized volatility of qualitative perceptions of the performance of the firm. Realized volatility is not new in the empirical evidence used for the analysis of uncertainty. Baker, Bloom, and Davis (Citation2016) have previously used realized volatility as an alternative measure of uncertainty. Furthermore, the traditional literature has considered forward-looking indicators because they estimate implied volatility. However, Choi et al. (Citation2018) also used the realized volatility of aggregate stock market returns and pointed out that the difference is minor at the annual frequency considered.
Secondly, to capture the uncertainty, we exploit the degree of disagreement in responses to several questions regarding demand changes and activity of the firm. One of the more popular measures provided in the analysis of uncertainty is the degree of disagreement between forecasters. As explained in Lahiri and Sheng (Citation2010), when disagreement is taken to indicate uncertainty, the underlying assumption is that this inter-personal dispersion measure is an acceptable proxy for the average dispersion of intra-personal predictive probabilities held by individual experts. Consequently, disagreement between respondents is usually measured through the standard deviation.Footnote7
3.3. How volatility/uncertainty shocks correlate with the uncertainty indicator
As we have previously pointed out, the classical literature has constructed a set of proxies to measure uncertainty. Nevertheless, Jurado et al. (Citation2015) showed that some of the classical proxies used in the analysis to measure uncertainty have some peculiarities that deserve further attention. Even in the case where uncertainty remains constant, stock market volatility can be time-varying because leverage changes or sentiment or risk aversion fluctuate. Cross-sectional dispersion also can hide heterogeneity in the cyclicality of firm’s performance not due to pure uncertainty. Thus, it is important to clarify the link between our uncertainty indicator and real economic uncertainty.
The first way to check the robustness of our uncertainty indicator is to compare it with one of the usual indicators, the Economic Policy Uncertainty (EPU) indicator and nd European News Based Index of Uncertainty, elaborated by Baker et al. (Citation2016). of the Appendix shows the correlation between the EPU and our uncertainty indicator for Question . As we can see, the indicator correlates positively and significantly for the most important countries of the EU.
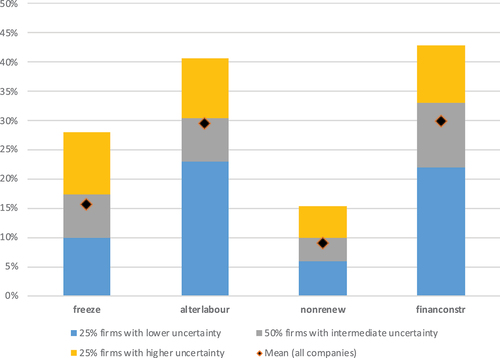
Figure 1. Percentage of firms having used any of the mechanisms by level of uncertainty.
Firms may be exposed to external shocks during their activity. The WDN Survey offers an extra set of questions related to the possibility that the firm has experienced a negative uncertainty shock. This information is only available for a sample of 8 countries (Czech Republic, Estonia, Greece, Luxembourg, Poland, Portugal). The questionnaire asks if the firm has perceived a negative volatility/uncertainty shock during each one of the years of the period 2010–2013 (Question ). This information is extremely valuable if we want to understand if the uncertainty indicator reflects the variability in the response of each firm to their environment.
For a first stage estimation, we have estimated if having experienced a negative shock of volatility/uncertainty might have affected the probability that the level of demand and the credit availability of the firm have decreased during the same period. Then we estimated the effect of the shock on the labour adjusting mechanisms, as we will see in the following section.
Table A1 of the Appendix shows the results of the estimation of the effect of having experienced an uncertainty shock on a decrease of demand level (column 1) and on a decrease of credit availability (column 2). The results confirm a significant negative impact of an uncertainty shock on demand. Being exposed to an uncertainty shock in any of the years in between 2010 and 2013 significantly increases the probability of having experienced a decrease in the level of demand during these years and a decrease in the probability of accessing credit. After considering this, firms might consider adjusting labour costs by adjusting capital or labour workforce, which is what we will try to understand in the following section.
3.4. Empirical analysis
To identify the correlation between the uncertainty indicator explained in Section 3 and the firm’s adjustment strategies we use a probit model. We estimate the impact of uncertainty on the probability of occurrence of several proxies of economic activity (). We try to measure if a higher uncertainty affects the probability that the firm has used some of the following adjustment mechanisms: freeze hiring (
), alter labour workforce (
), non-renewed temporary employment (
) and if there are credit constraints (
). In the descriptive part of the paper, we also include the possibility that the firm has adjusted prices more frequently.
The equation we want to estimate is
where is the firm,
represents the uncertainty indicator at the
category (composed by the country, sector and size of the firm),Footnote8 to which the firm
belongs, and
refers to a set of controls of firm’s characteristics observed (autonomy, composition of the workforce, age, degree of competition in foreign markets, behavior of demand, credit and supply, collective bargaining and share of foreign markets). Each firm belongs to one of six sectors defined in the data (manufacturing; electricity, gas, water; construction; trade; business services, and financial intermediation) and size is defined for four categories (5–19 employees, 20–49 employees, 50–199 employees, and 200 employees and more employees).
Table 2. Marginal effects of the main estimation
Table 3. Marginal effects of the estimation for more rigid EPL countries
Still, estimate the equation by firm level using our set of uncertainty indicators as , explained in detailed in Section 3. Employment and sampling weights provided by the WDN Survey are alternatively used in the estimation.
Firstly, we have grouped firms according to the degree of uncertainty in two groups: those with a lower level (p25) and those with a higher level (p75). As it is shown in , there are clear differences on the probability of using each mechanism depending on the degree of uncertainty they perceive. If a firm competes in an environment with a higher level of uncertainty, its probability of using some of these mechanisms increases significantly. In some cases, such as decisions to freeze hiring, this probability doubles in an environment with more uncertainty compared to when the firm is surrounded by an environment with a low level of uncertainty.Footnote9 This probability is also higher in those firms affected by more uncertainty than in the mean of the distribution of all firms, whereas the differences are much lower than those for the probability of a firm’s using a mechanism when it is in an environment with little uncertainty.
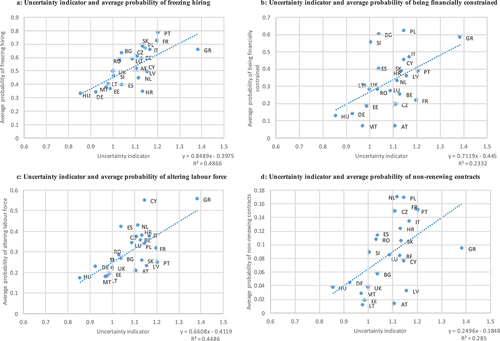
Secondly, we have illustrated the simple correlation between the dependent variables and the uncertainty indicator by country in ( to
). The uncertainty indicator is positively correlated with the probability of using an adjustment mechanism. We can also see that some countries, such as Greece, Portugal, France, Cyprus and Poland, have high levels of uncertainty and a high probability of using these adjustment mechanisms, while there are others, such as Hungary, Germany, Estonia, Latvia, Malta and the UK, with a low uncertainty and low probability of using these mechanisms.
Figure 2. (A) Uncertainty indicator and average probability of freezing hiring. (B) Uncertainty indicator and average probability of being financially constrained.(C) Uncertainty indicator and average probability of altering labour force.(D) Uncertainty indicator and average probability of non-renewing contracts.
Nevertheless, a further and detailed analysis requires to be done due to the lack of control for several of the variables affecting the adjustment mechanisms, as well as potential composition effects. The correlations could simply have arisen because in certain environments with more adjustments, the variation between firms is also higher and the firms had more disperse perceptions of the situation as more volatile.
4. Results and discussion
4.1. The causal relationship between uncertainty and labour adjustment
shows the marginal effects resulting from the estimation of a probability model for each of the dependent variables specified in EquationEquation (1)(1)
(1) . Controlling for activity and including several dummies representing characteristics of the firm as well as fixed effects, uncertainty still causes firms to increase the probability of adjusting their labour workforce. As stated in columns 1 and 2 of , a higher degree of uncertainty affected positively and significantly the probability that the firm would have frozen hiring or altered the size of its labour force during 2010–2013. Firms tend to reduce hiring and increase the adjustment of labour demand when uncertainty is higher. An increase of one point in uncertainty increases the probability of having frozen hiring by something between 21% and 39% during the period 2010–2013, depending on the source of the uncertainty (according to the questions used to construct the indicator). This result might also be expressed in normalized terms. Specifically, an increase of one standard deviation in uncertainty is associated with an increase of 9% [=(0.21*0.1565)/0.3637] to 16% [=(0.39*0.1565)/0.3637] of one standard deviation in the probability of having frozen hiring. Furthermore, other labour strategies have also been taken by firms, such as altering the labour workforce: the greater the uncertainty, the higher the probability of recurring to individual layoffs. An increase of one point in uncertainty increases the probability of using individual layoffs by between 0.8% and 13%.
a. All countries included.
b. U_c2_6a is the uncertainty indicator constructed from question c2_6a, which is referred to how the firm perceives the evolution of the domestic demand during 2010–2013. Similarly, U_c2_1a refers to the uncertainty indicator constructed from how the firm perceives that the level of demand affected the firm´s activity during 2010–2013. The dependent variables of each specification are referred to the probability that the firm has recurred to freezing labour workforce (freeze), altering labour workforce (alterlabour), not renewing temporary contracts (nonrenew) or experienced financial constrains (financonstr) during the period 2010–2013. Each specification has been estimated alternatively using one uncertainty indicator or the other.
c. Regressors include controls for the age of the firm, the composition of labour force, if the firm competes in foreign markets, type of collective bargaining and the share in foreign markets.
d. ***,**,* over an estimate denote that the estimate is statistically different from zero at the 99th, 95th and 90th confidence level, respectively.
A practical example might help to illustrate these results. Small firms (5–19 employees) operating in trade in Portugal have an uncertainty indicator of 1.12. If we exposed such a firm to the level of uncertainty experiences by a firm in the UK in the same sector and of the same size, namely an indicator of 2.12, the probability that the Portuguese firm would have frozen their hiring during that period would have move from their current average probability (50%) to a higher one, between 60% (=0.5 + 0.5*0.21) and 67.5% (=0.5 + 0.5*0.35). Similarly, if we consider the probability of altering labour that Portuguese small firms operating in trade had during this period (0.5%), but consider the level of uncertainty that UK firms had, then a Portuguese firm would have had a probability of altering labour between 0.6% to 0.67%.
If now consider Question , related to the level of demand of domestic products/services (, first row), an increase by one additional point in the uncertainty indicator increases the probability of having frozen hiring by 25%, increases the probability of altering the labour force of the firm by 6.5% and increases the probability that the firm might be financially constrained by 21.3%. Apparently, an increase in uncertainty seems to have an insignificant impact on the probability of not renewing temporary contracts. Only the effect of uncertainty that comes from foreign demand (, second row, using Question
), seems to affect the renewal of temporary contracts, by increasing its probability by 15% for each point of increase in uncertainty.
While the effect of uncertainty on hiring freezes and recurring to individual layoffs (altering labour) seems clear, it is probable that the firm faces an increase in uncertainty by recurring to temporary contracts with lower adjustment costs. This might explain why the effect on the non-renewal of contracts is not significant or close to zero in most of the cases shown in . The mechanism through which uncertainty affects credit constraints could be different. Uncertainty might not significantly affect directly the probability of being financially constrained, which could explain why only the marginal effect related to the indicator used in the first row of is significant. However, it might affect more intensively the labour adjustments when the firm is financially constrained. We study this effect in the following section by introducing interactions in the estimation, and we also address together a detailed analysis for firms in some of the countries of the sample with stricter legislation regarding hiring or firing.
4.2. For what type of firm is uncertainty more significant?
In this section we would like to determine if there are any differences regarding the source of uncertainty and if uncertainty differs in the way it affects different firms. Firstly, as we have previously pointed out, uncertainty is more damaging when credit constraints have arisen, and so we might think that uncertainty causes more problems for financially constrained firms at the same time as financially constrained firms use more labour adjustments than other firms (Bodnr et al., Citation2017). The size of the firm seems to have a significant impact on how firms alter their labour force and cope with the effects of an increase in uncertainty. It seems understandable that the effects of uncertainty are not the same for small firms as for large firms.
Secondly, we would also like to explore whether the adjustment mechanisms are equally used by firms placed in different countries, as we know that Employment Protection Legislation (EPL) is not everywhere as flexible as in some of the main countries of the EU. Previous evidence has shown that EPL is stricter in some European countries (Italy, Portugal, Spain). In 2008, these countries were some of the countries with the most restrictive protection of permanent workers against individual and collective dismissal, higher than the average of the OECD countries. After several reforms, protection has slightly decreased, but it still remains very high. Stricter legislation could affect a firm’s response to uncertainty, in terms of the mechanisms it will use to adjust its labour workforce. In countries where EPL is stricter, the gap between the costs of fair dismissals and unfair dismissals is larger, which makes labour courts’ intervention more critical to the determination of the “effective” firing costs (Jimeno, Martínez-Matute, & Mora-Sanguinetti, Citation2020), and so firing costs could be higher in the end. This fact definitely makes it more difficult to dismiss a worker and could even make the firm more reluctant to hire (Flanagan, Citation1988). Employers also use fixed-term and other kinds of temporary contracts (amounting to around 25% of the employees) to buffer against negative shocks leading to downsizing of their labour force due to the significant gap of firing costs between permanent and temporary contracts (Costain, Jimeno, & Thomas, Citation2010). Because a higher level of uncertainty seems to have a significant impact on the labour adjustments taken by firms, it would be desirable to test to what extent this effect may be more important when EPL is stricter.
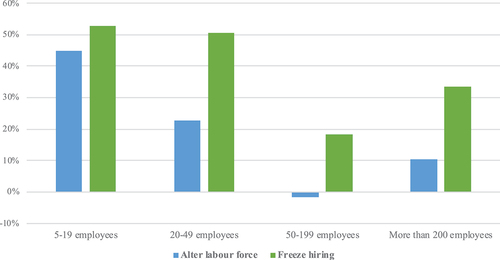
To that end, we have introduced a set of interactions between several dummy variables for controlling for the size of the firm and for credit constraints, given by the specification
where is a dummy depending on whether the firm is (=1) or is not (=0) financially constrained, and a categorical variable for its size (5 to 19 employees, 20 to 49, 50 to 199 or more than 200 employees). The results are shown in (depending on whether the firm is credit constrained) and (depending on the firm size). Financially constrained firms suffer a higher impact when uncertainty increases, but the impact is specially significant analysing the probability of a hiring freeze, being 10% higher than for a non financially-constrained firm for each point of increase in the uncertainty indicator. On the other hand, uncertainty might affect smaller firms more. shows how the hiring and firing decisions of small firms (5–19 employees) are more significantly affected than those of large firms. A small firm increases its probability of freezing hiring more than 50% when uncertainty increases one point, but that effect decreases to be around 18% for a large company of 50 to 199 employees. This also happens when comparing decisions about altering labour. Small companies might increase more than 41% their probability of altering labour if uncertainty increases by one point, whereas large companies might be affected only by around 25%.
Figure 3. Probability of altering labour or freezing hiring as a result of an increase in uncertainty depending on if the firm is credit constrained.
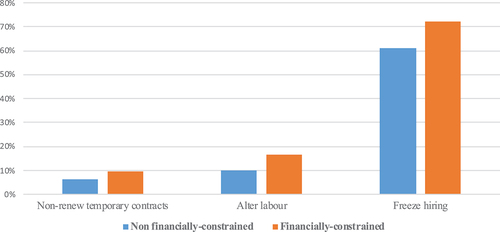
Figure 4. Probability of altering labour or freezing hiring as a result of an increase in uncertainty depending on the size of the firm.
shows the results only for firms from Portugal, Italy and Spain. In these countries, uncertainty has more significant effects than in the rest of the European countries on the probability of a hiring freeze, while it does not affect (or even affects negatively) any of the other mechanisms (non-renewal of temporary contracts or altering the labour force). An increase by one point increases the probability of a hiring freeze by between 63% and 90%. The effect on financially constrained firms is not significant anymore.
a. Countries considered in the estimation: Italy, Portugal and Spain.
b. U_c2_6a is the uncertainty indicator constructed from question c2_6a, which is referred to how the firm perceives the evolution of the domestic demand during 2010–2013. Similarly, U_c2_1a refers to the uncertainty indicator constructed from how the firm perceives that the level of demand affected the firm´s activity during 2010–2013. The dependent variables of each specification are referred to the probability that the firm has recurred to freezing labour workforce (freeze), altering labour workforce (alterlabour), not renewing temporary contracts (nonrenew) or experienced financial constrains (financonstr) during the period 2010–2013. Each specification has been estimated alternatively using one uncertainty indicator or the other.
c. Regressors include controls for the age of the firm, the composition of labour force, if the firm competes in foreign markets, type of collective bargaining and the share in foreign markets.
d. ***,**,* over an estimate denote that the estimate is statistically different from zero at the 99th, 95th and 90th confidence level, respectively.
4.3. Does uncertainty affect employment at the firm-level in the long run?
One of the limitations of the previous estimation is that we estimate probit models only using information from the WDN Survey. While this survey makes it possible to compare this information across 25 countries, it only provides qualitative data on the labour decisions of employers during the period 2010–2013, which might be affected by simultaneous information about the evolution of demand during the same period. One might think that a shock on uncertainty during 2010–2013 could even affect labour decisions during the subsequent period. To check this possibility, we use information from the SABI dataset up to 2016. The SABI database provides information on Spanish and Portuguese companies from the Business Registry from 1994. It covers a large number of companies, representing more than 90% of the companies presenting their accounts officially. For those companies, we have yearly information on the number of employees, international presence, sector, revenues, profits, costs and sales, among other variables.
Uncertainty indicators can easily be merged with the quantitative information provided by SABI at the firm level to see if the results are consistent and if decisions on labour response to uncertainty have long-lasting effects. We have assigned to each company its own uncertainty indicator depending on its size, sector and country (Spain or Portugal) according to the WDN indicators. We have tested the effect of the uncertainty indicators on the employment level and employment growth for the period 2013–2016, controlling for the firm’s international presence and revenues. presents the results of estimating the effect of the uncertainty indicators on the logarithm of employment and on the employment growth rate for more than 50,000 companies from SABI. The results of the estimation reveal that companies exposed to a higher degree of uncertainty show a significant decrease in their employment level and a significantly slower increase of employment growth rate for these two countries, which is in line with previous results.
Table 4. Panel estimation of uncertainty impact on firms employment
4.4. Robustness analysis
We suggest two additional robustness ckecks. Firstly, firms from different countries may have different perceptions of what a moderate or strong change in their level of demand is.Footnote10 To address possible misinterpretations of the questionnaire, we propose an alternative version of the uncertainty indicator, grouping the responses into only three different categories: increase, unchanged or decrease in demand.
We again exploit the firm’s qualitative responses for computing uncertainty indicators by country, sector and size of the firm, but the uncertainty indicator is now computed, following Bachmann et al. (Citation2013) by
where refers to the alternative version of the uncertainty indicator, following the criteria of Bachmann et al. (Citation2013),
is the category (according to country, sector and size cells) as considered before, and
denotes the weighted fraction of firms considering that the level of demand increased or decreased (either strongly or moderately) during the period 2010–2013 within the category
. The percentage of firms responding that the level of demand increased during the period 2010–2013 is denoted by
and the percentage of firms responding that the level of demand decreased during the period 2010–2013 is denoted by
.
The results are shown in Table A2 of the Appendix. Using both responses to Questions and
, uncertainty correlates significantly and positively with the labour adjustment mechanisms, which indicates that the analysis performed in the previous section is robust to the introduction of alternative disaggregated measures of uncertainty capturing disagreements about the demand and activity of the firms.
Secondly, Table A3 shows an alternative estimation of the impact of an uncertainty shock on labour decisions for a group of countries (Estonia, Czech Republic, Greece, Luxembourg, Poland and Portugal). We have replicated the same analysis as that of the empirical section but, in this case, using the uncertainty shock variable instead of the uncertainty indicator. As we have mentioned, the shock variable corresponds with a question only available in the questionnaires of these eight countries. The question asks whether the company has found a volatility/uncertainty shock of demand during 2010, 2011, 2012 or in 2013 or has not reported a negative shock (Question ). Additionally, this alternative method permits checking two issues. First, it allows us to analyse the individual response to uncertainty that each firm perceives (not as when using the uncertainty indicator aggregated at the category level based on variation of responses of multiple firms). Secondly, it also permits disentangling the effects of an increase in volatility potentially due to other macroeconomic shocks or policies over time, allowing a time-varying specific question to be asked of the firm.
The results confirm a significant negative impact of an uncertainty shock on labour decisions for these countries, with different effects depending on the year of the shock. The uncertainty shock of 2012 had a significant negative effect on the probability of having frozen hiring, whereas the uncertainty shock of 2013 significantly affected the probability of altering labour.
4.5. Magnitudes of the estimates
The results point out the importance of the effects of uncertainty on employment. The implications of these effects can be also measured. To provide some sort of benchmark, we can translate the coefficients that resulted from the estimation, to calculate how the proportion of using an adjusting mechanism would have been in case the uncertainty had increased.
If we place the focus on the results from , first row (using Question for constructing the uncertainty indicator), we see that an increase of uncertainty also increased the probability of freezing hiring. We can illustrate this with an example: in Portugal, 78% of the companies on average froze hiring during 2010–2013, but an increase of one point in the uncertainty indicator would have led this being 97% instead, which is equivalent to an increase of a 24% of Portuguese firms increasing the adjustment of their hiring decisions. In normalized terms, an increase of one standard deviation in the uncertainty indicator would have led up to an increase of 10% of one standard deviation of Portuguese firms increasing their hiring adjustment. In the case of altering labour, the proportion of companies having applied this adjustment would have risen from 24.7% to 26.3% on average if uncertainty, as measured with our indicator, had increased one point. In Portugal, 38.4% of the firms suffered financial constraints in the period 2010–2013. In this case, with an increase of one point in uncertainty, the percentage of firms experiencing financial troubles would have risen to 46.6% (a 21% higher compared with a situation in which uncertainty would have remained constant). Finally, 15% of firms reported not having renewed temporary workers. In this case, this percentage would have remained practically identical in case uncertainty had increased, as the coefficient is really low and not significantly different from zero.
We can also quantify the effects considering the estimation of employment using SABI data matched with the uncertainty indicators obtained from the WDN Survey. On average, following the estimates in (first row, column 3), an increase of one point in the uncertainty indicator (using the question ) would have led to an employment growth rate in 2016 of only 6% (=0.57*0.108) whereas in the case that uncertainty had remains the same the employment would have grown by 10.8% in Spain. In the case of Portugal, the employment that year would have grown by only 5.2% (=0.57*0.92) instead of by the actual 9.2% on average using the SABI sample.
a. Only Spain and Portugal are included in the estimation.
b. The dependent variables are the logarithm of the yearly firm-specific number of employees (columns 1 and 2) or the year on year firm-specific employment growth during the period 2009–2016.
c. The uncertainty indicator is designed using alternatively questions c2_6a and c2_1a of WDN Survey data and has been merged at the country, size and sector level with SABI data. An uncertainty indicator is assigned to each firm of SABI data depending on which country, size and sector they correspond.
d. The additional controls (shown) are the logarigthm of the revenues of the firm that year, a dummy variable if the firm exports or imports, controls for the size, sector and country of the firm and time dummies. Standard errors are clustered at the city level.
e. ***,**,* over an estimate denote that the estimate is statistically different from zero at the 99th, 95th and 90th confidence level, respectively.
5. Concluding remarks
It is well known that uncertainty affects economic activity. Whereas the effect of uncertainty on investment and firms’ capital decisions is well established in the literature, less attention has been given to labour decisions. In this paper, we constructed a group of uncertainty indicators exploiting firms’ variability in each country, sector and depending on their size by means of a set of varied questions regarding firms’ perceptions of demand. Our aim was to measure the effect of uncertainty on labour decisions at a more disaggregated level.
Using a set of uncertainty indicators for 25 European countries, we have been able to prove that uncertainty affected positively and significantly the probability of having adjusted the labour workforce during 2010–2013. Firms tended to reduce hiring and increase firing more when uncertainty was higher. An increase by one point in the uncertainty indicator increases the probability of having frozen hiring by something in between 21% and 39% during the period 2010–2013. Altering the labour workforce by using individual layoffs was also significantly affected by increases in uncertainty.
Significant differences by country have also been found: countries with higher labour adjustment costs exhibit a more significant effect of uncertainty on labour adjustment decisions, both in hiring and firing. We have also found that the impact of uncertainty is especially important in the case of financially constrained firms. Finally, it is important to remark that whereas the effect of uncertainty on the probability of recurring to individual layoffs seems clear, there has not been found a significant effect on the probability of non-renewal of temporary contracts by firms when uncertainty is higher. Probably this seems to show that firms might recur to temporary contracts with more intensity as an escape mechanism to avoid stricter legislation about layoffs or higher costs in the case of a significant decrease in their demand.
Supplemental Material
Download MS Word (30.8 KB)Acknowledgments
We thank Ana Lamo, Andreas Dibiasi, Mario Izquierdo and Sergio Puente for their useful comments, and the participants at the meeting of conjunctural experts of four NCBs, the research seminar of the Banco de España, the Universidad Autónoma de Madrid, the XXI Applied Economics Meeting, the Conference “Economic Challenges of Enlarged Europe”, EcoMod 2018, and the Workshop on Labor Market Policies and Dynamics at Turin, Italy (2020).
Disclosure statement
The views expressed in this manuscript are those of the authors and do not necessarily represent those of the Banco de España or the Eurosystem.
Supplementary material
Supplemental data for this article can be accessed here
Notes
1 Macroeconomic uncertainty has significantly contributed to these fluctuations in the euro area, after the lagged contribution of past growth in real GDP, as shown in European Central Bank (Citation2016). The average contribution of an uncertainty shock to fluctuations in the real GDP is 20%, only behind the lagged real GDP (27%), but before other factors such as world demand (6%), real private consumption, the savings rate, and real investment (each of these three last factors contribute around 5%.)
2 Using data from the third wave of the Wage Dynamic Network Survey, around 65% of the companies in the European Union consider uncertainty as the most important obstacle in hiring new workers, before others, such as wages, the costs of firing or hiring, access to credit, and the cost of other inputs. Uncertainty is even more important in small and medium companies, which is the most predominant size of European businesses.
3 Recent evidence has also shown that the degree of labour protection plays a crucial role in the propagation of uncertainty shocks. See Dibiasi and Sarferaz (Citation2021) for an analysis with macroeconomic indicators).
4 Financial market information, key words found in newspaper articles, surveys of forecasters, private households, and firms, and macroeconomic trends have been used to estimate the impact of uncertainty on economic activity. These proxies have been grouped into different types of uncertainty, such as political, financial and forecast uncertainty. But there is still a certain degree of disagreement about the caveats and limitations of all these variables. For that reason, it is important to continue relying on indicators of uncertainty with large datasets, that permit and obtain robust estimations of its effects.
5 For instance, Binding and Dibiasi (Citation2017) suggested the necessity of using disaggregated data in research on the relationship between uncertainty and investment.
6 To simplify the results that will be shown in the following section, we have only estimated the uncertainty coming from domestic or foreign demand and prices, which is the main aim of this paper, and we do not show the results of estimating the effects of uncertainty from Questions and
, because they refer to other issues and can be affected by other different factors simultaneously, which would go beyond our analysis here. However, considering it is interesting to see the dispersion of responses, we keep the descriptive statistics related with these variables.
7 For instance, European Central Bank (Citation2016) constructs the unweighted average of the standard deviations of point forecasts of forecasters for different variables in order to construct a measure of forecast disagreement in the euro area.
8 While main results from show uncertainty using all the indicators described, some of the charts only show uncertainty using our main indicator (from Question ) to simplify the explanation. Alternative charts have been used with the other main indicator (from Question
) with similar results
9 A -test for equal means proves that there is a difference between the probabilities for these two groups of firms
10 We think that whereas a firm in Germany may have a different perception of what a “strong increase” is from that of a firm in Italy or Spain, there is no doubt about whether something is an increase or a decrease, even for different firms from different countries.
Related Research Data
References
- Aghion, P., Angeletos, G., Banerjee, A., & Manova, K. (2010). Volatility and growth: Credit constraints and the composition of investment. Journal of Monetary Economics, 57(3), 246–265.
- Altig, D., Baker, S., Barrero, J. M., Bloom, N., Bunn, P., Chen, S., … Mihaylov, E. (2020). Economic uncertainty before and during the covid-19 pandemic. Journal of Public Economics, 191, 104274.
- Arellano, C., Bai, J., & Kehoe, P. J. (2016). Financial frictions and fluctuations in volatility. NBER Working Paper 22990.
- Bachmann, R., & Bayer, C. (2013). ‘Wait-and-See’ business cycles? Journal of Monetary Economics, 60(6), 704–719.
- Bachmann, R., Elstner, S., & Sims, E. R. (2013). Uncertainty and economic activity: Evidence from business survey data. American Economic Journal: Macroeconomics, 5(2), 217–249.
- Baker, S. R., Bloom, N., & Davis, S. J. (2016). Measuring economic policy uncertainty. The Quarterly Journal of Economics, 131(4), 1593–1636.
- Binding, G., & Dibiasi, A. (2017). Exchange rate uncertainty and firm investment plans. Evidence from Swiss survey data. Journal of Macroeconomics, 51, 1–27.
- Bloom, N., Bond, S., & Van Reenen, J. (2007). Uncertainty and investment dynamics. Review of Economic Studies, 74(2), 391–415.
- Bloom, N., Floetotto, M., Jaimovich, N., Saporta-Eksten, I., & Terry, S. J. (2013). Really uncertain business cycles. CEP Discussion Paper No. 1195.
- Bloom, N. (2009). The impact of uncertainty shocks. Econometrica, 77(3), 623–685.
- Bodnr, K., Fadejeva, L., Hoeberichts, M., Izquierdo, M., Jadeau, C., & Viviano, E. (2017). Credit shocks and the European Labour Market, Bank of Spain Working Papers, No. 1747.
- Bonciani, D., & Van Roye, D. (2015). Uncertainty shocks, banking frictions and economic activity, European Central Bank Working Paper Series, No. 1825.
- Born, B., Breuer, S., & Elstner, S. (2018). Uncertainty and the great recession. Oxford Bulletin of Economic and Statistics, 80(5), 0305–9049.
- Caldara, D., Fuentes-Albero, C., Gilchrist, S., & Zakrajsek, E. (2016). The macroeconomic impact of financial and uncertainty shocks. International Finance Discussion Papers 1166.
- Choi, S., Furceri, D., Huang, Y., & Loungani, P. (2018). Aggregate uncertainty and sectoral productivity growth: The role of credit constraints. Journal of International Money and Finance, 88, 314–330.
- Christiano, L. J., Motto, R., & Rostagno, M. (2014). Risk shocks. American Economic Review, 104(1), 27–65.
- Costain, J., Jimeno, J. F., & Thomas, C. (2010). Employment fluctuations in a dual labor market. Bank of Spain Working Paper 1013.
- D’Amico, S., & Orphanides, A. (2008). Uncertainty and disagreement in Economic Forecasting. In 2008-56 Finance and Economics Discussion Series Divisions of Research & Statistics and Monetary Affairs Federal Reserve Board (pp. 2008–2056). Washington, D.C: Federal Reserve Board.
- Dibiasi, A., Abberger, K., Siegenthaler, M., & Sturm, J. (2018). The effects of policy uncertainty on investment: Evidence from the unexpected acceptance of a far-reaching referendum in Switzerland. European Economic Review, 104, 38–67.
- Dibiasi, A., & Sarferaz, S. (2021). Measuring macroeconomic uncertainty: The labor channel of uncertainty from a cross-country perspective, mimeo . doi:10.13140/RG.2.2.21580.33923
- European Central Bank. (2016). The impact of uncertainty on activity in the euro area. ECB Economic Bulletin, 8, 55–74, Dec. 2016.
- Flanagan, R. J. (1988). Unemployment as a hiring problem. OECD Economic Studies, (11), 123–154.
- Ghirelli, C., Gil, M., Pérez, J. J., & Urtasun, A. (2021). Measuring economic and economic policy uncertainty and their macroeconomic effects: The case of Spain. Empirical Economics, 60(2), 869–892.
- Gilchrist, S., Sim, J. W., & Zakrajsek, E. (2014). Uncertainty, financial frictions, and investment dynamics. NBER Working Papers 20038, National Bureau of Economic Research.
- Jimeno, J. F., Martínez-Matute, M., & Mora-Sanguinetti, J. S. (2020). Employment protection legislation, labour courts and effective firing costs. IZA Journal of Labor Economics, 9(1), 1.
- Jurado, K., Ludvigson, S. C., & Ng, S. (2015). Measuring uncertainty. American Economic Review, 105(3), 1177–1216.
- Kandoussi, M., & Langot, F. (2020). Uncertainty shocks and unemployment dynamics. IZA Discussion Paper, no. 13438.
- Lahiri, K., & Sheng, X. (2010). Measuring forecast uncertainty by disagreement: The missing link. Journal of Applied Econometrics, 25(4), 514–538.
- Mathä, T. Y., Millard, S., Rõõm, T., Wintr, L., & Wyszyński, R. (2019). Shocks and labour cost adjustment: Evidence from a survey of European firms. Working Paper Series 2269, European Central Bank.
- Mecikovsky, A., & Meier, M. (2014). Do plants freeze upon uncertainty shocks?, EconStor Preprints. Germany: ZBW – German National Library of Economics.
- Stokey, N. L. (2013). Wait-and-See: investment options under policy uncertainty. NBER Working Paper, No. 19630.