
 ?Mathematical formulae have been encoded as MathML and are displayed in this HTML version using MathJax in order to improve their display. Uncheck the box to turn MathJax off. This feature requires Javascript. Click on a formula to zoom.
ABSTRACT
The risk attitude plays an important role in analyzing decision making under uncertainty. It is essential to confirm whether the risk aversion parameter in a certain situation, called “domain,” can be applied to other situations. Using a dataset on hospitalization insurance policies in Japan, this study tests whether individuals’ risk preferences remain consistent across domains. Based on the assumption of expected utility maximizer, we derive a plausible distribution of the degree of risk aversion. We find that degree of risk aversion is consistent between hospitalization benefits and additional insurance for specific diseases. Contrarily, the degree of risk aversion from hospitalization benefits has a negative relationship with that based on a survey question on the self-assessment of general preferences. This result indicates that the imputation of risk aversion from the literature would distort research results markedly if characteristics of the domains targeted by both previous research and this study differ.
1. Introduction
The degree of risk aversion plays an important role when analyzing decision making under risk and uncertainty. It affects many decisions such as occupation, portfolio, insurance, and health behaviors. In principle, researchers treat risk preferences as context-invariant, which means that an individual has a specific utility function defined over final wealth. In other words, an individual’s risk preference parameter should be stable, independent of any decision-making scenarios, namely the “domains” he/she faces.Footnote1,Footnote2 Specific examples of domains include insurance contracts, selection of financial assets, and general lotteries. If the estimated parameters meet the above principle, then those parameters have internal validity. Moreover, if the parameter estimated in a certain domain has predictive power for actual risky behaviors, then external validity is satisfied in this case.Footnote3
Contrarily, if the above principle is not fulfilled, then the following problem arises. For example, when performing calibration, researchers often use the estimated risk aversion obtained from previous research. If the internal and external validity is not satisfied, then using the degree of risk aversion obtained from previous studies targeting different domains could provide meaningless conclusions. Thus, the internal and external validity of the risk aversion determines the credibility of the research results.
In summary, there is insufficient consensus as to whether the internal and external validity of an individual’s risk aversion is satisfied. The purpose of this study is to determine whether internal and external validity are satisfied by focusing on multiple domains with different characteristics based on the assumption that individuals act to maximize expected utility.
Hence, using micro-level data with rich information on hospitalization insurance policies in Japan, we estimate the degree of individual risk aversion based on information on hospitalization benefits. Next, we compare the estimated values with those based on two other domains; namely, (a) individuals’ subscription to additional medical insurance policies and (b) answers to a question on the self-assessment of general preferences towards risk. We find a consistent relationship with the former domain but not with the latter. These results suggest that external validity exists among domains with high similarity in relation to medical insurance. However, internal validity among domains with less similarity does not exist. That is, this study strongly accentuates the importance of paying close attention to the similarity of domains when utilizing risk aversion estimates from previous studies.
The remainder of the paper is organized as follows. Section 2 reviews the relevant existing studies. Section 3 describes the model of individual choice for various hospitalization benefits as well as the calibration method used in this study. Section 4 outlines the data. Section 5 presents the estimated results. Finally, Section 6 concludes.
2. A brief summary of the related literature
Given that a growing body of literature aims to verify the internal and external validity of risk aversion estimates, we first review studies on internal validity and, then, review studies on external validity.
2.1. Internal validity
Many studies verify that in laboratory experiments such as lottery choices, differences in the design of the experiment, such as the setting of lotteries and the payoff amount, affect the estimation result of an individual’s degree of risk aversion (Attanasi, Georgantzis, Rotondi and Vigani, Citation2018; Bauermeister, Hermann, and Musshoff. Citation2018; Binswanger, Citation1980; Csermely and Rabas, Citation2016; Eckel and Grossman, Citation2008; Ioannou and Sadeh, Citation2016; Reynaud and Counture Citation2012; Walelign, Nielsen, Jiao, and Jacobsen, Citation2019; Wik, Kebede, Bergland, and Holden, Citation2004). The results for validity are mixed. According to Anderson and Mellor (Citation2009), who survey studies applying a within-subjects design, the degree of risk aversion of the same individual estimated for multiple domains can be inconsistent.Footnote4
Contrarily, Dohmen et al. (Citation2011), who compare a subject’s risk preference derived from lottery choice in a laboratory with that derived from questions on self-reported willingness to accept risk, find that willingness to accept risk is a significant predictor of risk-taking behavior in the laboratory. Moreover, Tausch and Zumbuehl (Citation2018) investigate the relationship between self-stated willingness to take risk and exogenous economic information. They find that people have inconsistent risk aversion when exposed to various economic news.
Furthermore, some studies verify internal validity using field data. Barseghyan, Prince, and Teitelbaum (Citation2011) reject the hypothesis that households have stable risk preferences when choosing automobile and home insurance policies. Einav, Finkelstein, Pascu, and Cullen (Citation2012) show that only 30% of individuals behave consistently regarding risk aversion when presented with five domains for employer-provided insurance and 401(k) portfolio choices. Gürdal Kuzubaş and Saltoğlu (Citation2017) find a positive correlation between measurement methods of risk attitude using a large non-student sample.
2.2. External validity
Another stream of literature aims to verify external validity. Wolf and Pohlman (Citation1983), using hypothetical and actual bid data, find that Treasury Bill dealers are more risk averse in the actual investment context than in a hypothetical context. Fellner and Maciejovsky (Citation2007) show that the coefficients of risk aversion from lottery choices are systematically correlated with market behaviors. Menapace, Colson, and Raffaelli (Citation2016) focus on farmers’ attitudes toward risk and show that self-assessment questions cannot significantly explain actual behavior when purchasing crop insurance. However, they also report that large stakes gambling tasks with a specific framing can statistically and significantly explain farmers’ actual behavior in this setting. This result suggests that some hypothetical questions are consistent with actual behavior, whereas others are not.
Additionally, Fujii and Inakura (Citation2019) examine the gap in risk aversion between hypothetical and actual choices in medical insurance, and report that the gap varies depending on respondents’ anxiety about future medical expenses, their level of financial literacy, and other personal attributes such as age and occupation. Sharma and Schoengold (Citation2016) compare the risk preferences of crop producers derived from actual on-farm production with choices from a simple lottery and find that revealed risk preferences derived from actual production decisions correlate with stated risk preferences derived from lottery selection.
Leon and Pfeifer (Citation2017) analyze the relationship between individual religion and risk aversion, finding that the higher the willingness to take risks in financial matters, the higher the probability of holding stocks, fixed interest securities, and life insurance. In other words, the result imply that there is not necessarily a linear relationship between an individual’s degree of risk aversion and the degree of volatility of the assets held.
3. Model and calibration method
Following Einav et al. (Citation2012), we analyze the behavior of individual with respect to choosing hospitalization insurance coverage
under relative risk aversion
. This model assumes that all individuals are utility maximizers who have a single concave utility function over wealth. In this model, individuals pay insurance premium
for option j. Option 0 means no insurance premium is paid; instead, high medical expenses are incurred.
Thus, individual evaluates expected utility
as
where is the expectation of random treatment cost
,
indicates individual
’s invariant vNM utility function,
signifies individual
’s income,
denotes the out-of-pocket expenditure associated with cost realization
under coverage
, and
represents the premium associated with coverage
. Consistent with many previous studies (Mehra and Prescott (Citation1986) and Geweke (Citation2001)), we employ the CRRA utility function defined by
Here, is the coefficient associated with individual
's level of risk aversion.
We assume that individual faces loss
with probability
and no loss with probability
. The subscript
represents age, indicating that individuals’ probability of being hospitalized (and incurring the respective hospitalization costs) depends on their age. Therefore, individual
’s expectations can be represented as
We also calibrate the estimates of relative risk aversion parameter . First, EquationEquation (3)
(3)
(3) is estimated for individual
for all options from 0 to
at
. Since
can take any value between -∞ and +∞, EquationEquation (3)
(3)
(3) is calculated for each option while gradually shifting the value of
. Moreover, since individuals are assumed to maximize their expected utility, if individual
chooses option
, it means that EquationEquation (3)
(3)
(3) under
is the maximum value relative to those calculated from the other options. That is, there exists a
that maximizes EquationEquation (3)
(3)
(3) under
for individual
; here,
represents the value of risk aversion for individual
. Hence, when individuals with the same attributes choose different insurance options, this is reflected by a difference in
.
4. Data
4.1. Overview
This study uses the Survey on Life Protection in 2016 (hereafter, SLP), compiled by the Japan Institute of Life Insurance to measure individuals’ risk aversion.
The survey outline is as follows. First, the content of the question relates to individuals’ lifestyles (such as level of savings and private insurance policies held against various future risks).Footnote5 Since this survey is not a household survey but rather an individual one, the information on income and private insurance policies is ideal for application on an individual basis. Moreover, the content of the survey is diverse and includes questions on hospitalization experience, hospitalization expenses, confidence in the public social security system, and preferences for risk or return trade-offs. Second, subjects are men and women aged 18–69 years old across Japan selected by using the stratified two-stage random sampling method. The number of respondents is 4,056. However, respondents with a positive labor income are targeted because our decision model presumes that they choose coverage options by themselves.
presents the summary statistics of the subjects analyzed. Both men and women have an average age of 46, and approximately 80% hold private insurance. Educational background, employment type, and personal income differ by sex as follows. The proportion of male university graduates is about 20 percentage points higher than that of women. About half of the female respondents work in irregular employment as compared to less than 10% for men. Personal annual income is 4.8 million Japanese yen (JPY) for men and JPY 2.1 million for women on average.Footnote6
Table 1. Descriptive statistics
4.2. Insurance premium for hospitalization benefits
Insurance products are typically sold as packages; individual insurance policies provide protection against various risks, including death, specific illnesses, hospitalization, nursing care, and other negative outcomes.Footnote7 For example, it is possible to add medical insurance to an insurance policy that covers the insured individual’s death. Conversely, it is possible to add death insurance to a medical insurance policy. Hence, to determine the amount that individuals are willing to pay for insurance against hospitalization, it is necessary to specify the proportion of the premium allocated to death benefits, hospitalization benefits, and other riders.
In the SLP, rich information on individuals’ insurance policies is available (total amount of annual insurance premiums, risks covered, and benefit amounts). shows the summary statistics for this information for respondents with positive insurance premiums (excluding respondents that pay their insurance premiums in a lump sum). The average annual premium is JPY 174,390. For daily hospitalization benefits, we established three categories: Option 0 (uninsured), Option 1 (less than JPY 10,000), and Option 2 (over JPY 10,000). Altogether, 46.1% of respondents are categorized as Option 1 (average benefit = JPY 5,260) and 48.5% as Option 2 (average benefit = JPY 13,260). The remainder (5.4%) are uninsured. The average death insurance payout is about JPY 9.8 million. Further, 26.1% hold annuity insurance, and more than 40% held policies that included riders for cancer and other diseases. In contrast to these relatively high percentages, only 9.9% of respondents held special policies that give them nursing care insurance.Footnote8
Table 2. Summary statistics of insurance policies
We next estimate the insurance premiums paid to hold Options 1 and 2.Footnote9 First, we perform an ordinary least squares regression, using the annual insurance premium as the dependent variable. The independent variables are the policy statuses for the different types of insurance. This regression equation is modeled as follows.
Given the above, and
represent the annual insurance premiums for Options 1 and 2, respectively. Column (1) in shows the estimation results. Since insurance premiums are partially determined by age and sex, we add age and sex as predictors in column (2). The estimated coefficient of Option 1 in column (2) is 2.876, and that of Option 2 is 8.201, which means that a respondent who holds Option 1 pays JPY 28,760 per year for hospitalization benefits as compared to JPY 82,010 per year for Option 2. We use the estimated premiums shown in column (2) as
in Equationequations (1)
(1)
(1) and (Equation3
(3)
(3) ).
Table 3. Determinants of total premiums
4.3. Probability of hospitalization and out-of-pocket costs due to hospitalization
Regarding the hospitalization probability, , and out-of-pocket costs,
, in Equationequation (3)
(3)
(3) , we use the information on hospitalization experience within the past five years taken from the SLP. For hospitalization probability, two calculation methods are adopted (): (i) the probability of hospitalization is assumed to be constant across ages (14.9%), and (ii) the probability of hospitalization is assumed to vary by age.
Figure 1. Percentage of respondents who have experience of hospitalization
Next, out-of-pocket costs are derived as follows. The SLP asks questions about latest hospitalization experience within the past five years with respect to (i) the direct expenses paid to hospitals and indirect expenses (meals, daily necessities, transportation) and (ii) hospitalization days. Direct expenses here are calculated as total costs minus the hospitalization benefits paid from the public health insurance system, including the high-cost medical expense benefit. As shown in , the average values of (i) and (ii) are JPY 219,000 (approximately USD 2,000) and 17.8 days, respectively. Then, the average of (i)/(ii) is JPY 19,800 (approximately USD 180). That is, daily hospitalization costs are JPY 19,800 plus the lost income per day calculated from the individual’s personal annual income.
Table 4. Hospitalization expenses and number of hospital days
Finally, we use the average number of hospital days for respondents aged 20–69 years old (20.4 days), calculated from the Patient Survey (2014) of the Ministry of Health, Labour and Welfare in Japan. Therefore, out-of-pocket costs for individual i under Option j (j = 0, 1, 2) are calculated as ((19.8 + Lost income per day i benefit j)
20.4). That is, the difference between individuals’ out-of-pocket hospitalization costs arises from the difference between their income and the benefits from their insurance policy. In the next section, this study estimates individuals’ relative risk aversion rate by assuming that they aim to maximize expected utility.
5. Empirical results
5.1. Estimating  for hospitalization risk
Based on the calibration method described in Section 3, we estimate respondents’ relative risk aversion. (a) and (b) present the estimated results for the cases where the hospitalization probability is fixed and vary across ages, respectively. (a) indicates that the higher annual income, the higher is the estimated value of
. For example, if individuals’ income is below JPY one million (represented as “I” in the table) and they hold Option 1, and their
is estimated to be 0.9. Contrarily, individuals whose income exceeds JPY 10 million (“VII” in the table) and who hold Option 1 have a
value of 10.7. Moreover, if the income level is the same, the higher the option chosen, the higher the estimated value of
. shows that the rate of hospitalization increases as age rises. Therefore, even with the same income and insurance coverage, the lower the respondent’s age, the higher the estimated value of
in . For example, when holding Option 2 with an annual income of 4.8 million, which is the average value for men mentioned in the Data section (“IV” in the table), respondents’
in their 20s is estimated to be 14.9 as compared to 4.5 in their 60s.
Table 5. Estimated relative risk aversion coefficients by income and insurance options (a) Fixed hospitalization probability (b) Variable hospitalization probability
Figure 2. for each insurance option by age.
We next merge the estimated for selected respondents (workers from 20–69 years old; see ). The differences in income, insurance policy, and age that cause different hospitalization probabilities bring about a variation in
. Column (a) and (b) of shows the summary statistics for the case where the probability of hospitalization is fixed (variable) across age groups. also shows the kernel density for
. The average values are 5.29 in column (a) and 6.22 in column (b), with medians of 4.80 and 5.75, respectively. These values are largely consistent with previous studies of risk aversion in Japan. For example, Yoshikawa (Citation2003), using time series data on a household’s risky asset holding rate, finds that the estimated value in 2003 is between 1.96 and 3.07. Kamiya and Moridaira (Citation2007), focusing on death insurance in Japan, estimate participants’ level of risk aversion to be between 0.3 and 2.3.
Table 6. Basic statistics for
Figure 3. Kernel density plot of .Note: Probability of hospitalization is fixed across age groups for (a) and variable for (b).
5.2. Comparing risk aversion across domains
This study compares the estimated with those derived from the other two domains. First, Domain (a) is based on individuals’ membership of additional medical insurance policies (known as riders). Therefore, this comparison verifies whether the estimated degree of risk aversion,
, has external validity or not. As shown in , the proportions of the sample subscribing to cancer insurance, other disease-specific insurance, and nursing care insurance are 47.5%, 43.1%, and 9.9%, respectively. As individuals holding these riders pay additional premiums, their degree of risk aversion is expected to be higher. Moreover, the benefits paid from a rider are not included in the hospitalization benefit amount used to estimate
. That is, hospitalization benefits and rider benefits are exclusive.
shows the consistency between and the degree of risk aversion inferred from Domain (a). The dependent variable is
obtained in Section 5.1. Columns (1) and (3) represent those cases where the probability of hospitalization is fixed and variable, respectively. The coefficient estimates of the dummy variables for holding cancer insurance and disease-specific insurance are positive and statistically significant in all cases (see columns (1) to (4)). For example, the coefficient of holding cancer insurance in column (1) is estimated to be 0.851. This result means that relative risk aversion is 0.851 higher for those who hold cancer insurance than for those who do not if other conditions are fixed. Therefore, the
estimated from the hospitalization insurance benefit and the degree of risk aversion for Domain (a) is consistent, and this result can mean that
has external validity.
Table 7. Consistency between for hospitalization benefits and additional riders
Domain (b) relates to general risk aversion. More specifically, participants were asked to respond to the following question: “Do you prefer Option A or Option B? A: High profits with a possibility of loss. B: Low profits without a possibility of loss.” Participants were asked to select Option A, Option B, “near” Option A, “near” Option B, or “I do not know.” shows that participants largely gravitated toward the option that can be interpreted as the most risk averse (i.e., Option B). Moreover, there is no difference in the distribution of responses between the case that is limited to employees and the case of all samples of the SLP.
Figure 4. Response to the general question about risk aversion.
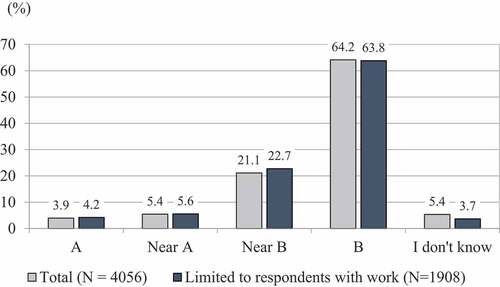
Again, each individual’s obtained in Section 5.1 is taken as the dependent variable, and the answer to the question of general risk aversion is added as an independent variable. This formulation examines the internal validity as to whether the difference in the method of measuring the degree of risk aversion leads to inconsistency. We treated Options “A” and “near A” as the base case; hence, the coefficients associated with the three other options indicate a deviation from the base case. Therefore, if the coefficient of “Near B” or “B” is positive and significant, there is consistency between the degree of risk aversion inferred from the question on general risk aversion and those estimated in Section 5.1. However, the estimated result shows the opposite. In , the coefficients of “Near B” and “B” are estimated as negative in columns (1) and (3). This finding means that individuals who answer “B” tend to have a lower
than those who select “A” or “near A.” That is, respondents considered to be more risk averse from the general question on risk tend to have lower
values. Therefore, internal validity is not satisfied.
Table 8. Consistency between for hospitalization benefits and general risk aversion
6. Conclusion
We first discuss the value of obtained from calibration, and state the contribution of this study on the external and internal validity of the estimated risk aversion.
Based on the assumption that individuals act to maximize expected utility, we derive a plausible distribution of by calibration, whose median values is about 5. Moreover, focusing on the relationship between age and risk aversion, it was observed in this study that the value of risk aversion decreases as age increases, given other conditions as constant. This means that older people are more risk-loving than young people. It seems to be counter-intuitive, but the following interpretation is possible.Footnote10 First, the age dummy in this study should be interpreted as a cohort effect rather than an age effect. In Japan, there is a clear intergenerational gap in social security benefits, and it is possible that young people (that is, younger cohorts) might be making risk averse choices regarding the health domain of hospitalized medical insurance. Since the data used in this study are cross-sectioned, age and cohort effects could not be identified. Verification using panel data or pseudo panel data can be investigated in future studies. Furthermore, an extension to multi-attribute utility functions (such as Crainich, Eeckhoudt, and Le Courtois (Citation2017) and Attema, l’Haridon, and van de Kuilen (Citation2019)) gives scope for further studies.
The contribution of this study is as follows. By using a dataset with rich information on hospitalization insurance policies in Japan, we test whether individuals’ risk preferences satisfy internal and external validity. We find that individuals’ degree of risk aversion is consistent between the domains of hospitalization benefits and additional insurance for specific diseases. This result indicates external validity exists among domains with similar properties. On the contrary, and the answer to the question of general risk aversion have a negative correlation. Therefore, internal validity is not observed between domains with different properties. That is, no internal validity was observed between the hypothetical question of the general attitude to risk and
as calculated from the real world of life insurance choices.
In summary, the above two results for external and internal validity highlight the importance of domain similarity. Einav et al. (Citation2012), using a large dataset containing information on employee’s medical insurance policies and 401(k) choices, found that each employee’s degree of risk aversion was consistent within multiple medical insurance policies but inconsistent between medical insurance policies and 401(k) choices. The results of Einav et al. (Citation2012), as well as those presented herein, indicate that individuals’ degree of risk aversion for multiple domains with similar properties can be substituted, whereas they cannot be substituted for domains with different properties. This point is important, especially, when calibrating the economic model with a risk aversion, including relative risk aversion obtained from previous research. If the characteristics of the domains targeted by this study and previous studies differ, the imputation of risk aversion obtained in previous studies would distort the results of the literature markedly.
Finally, we discuss some future research directions. Individuals’ choices depend not only on decision-makers’ risk preferences but also on their subjective expectations about various outcome probabilities. We assumed that subjective expectations, namely the probability of a disease requiring hospitalization in our study, were constant among respondents of the same age. This assumption gives scope for future research to verify the consistency of the risk preferences among domains by using a model that can treat the subjective probability of each outcome endogenously.
Disclosure statement
No potential conflict of interest was reported by the author(s).
Correction Statement
This article has been republished with minor changes. These changes do not impact the academic content of the article.
Additional information
Funding
Notes on contributors
Yoichiro Fujii
Yoichiro Fujii has been associate professor at Meiji University since 2019. He received Ph.D in Economics from University of Tsukuba in 2010. His research fields are decision analysis under uncertainty and insurance economics.
Noriko Inakura
Noriko Inakura has been associate professor at Shikoku University since 2020. She received Ph.D in Economics from University of Tsukuba in 2009. Her research fields are consumption and health economics.
Notes
1 The data for this research were provided by (1) the Japan Institute of Life Insurance and (2) the Social Science Japan Data Archive, Center for Social Research and Data Archives, Institute of Social Science, The University of Tokyo. We are grateful to both organizations for providing the data. We also thank Yoshiro Tsutsui, Yoshihiko Suzawa, Shinji Takenaka, and the participants of the Asia-Pacific Risk and Insurance Annual Meeting 2017 held at Poznań University. This work was supported by JSPS Kakenhi Grant Number 17K03637(Fujii), 19K23223 (Inakura) and 21K01393 (Fujii).
2 Domain in this paper does not refer to the mathematical term “domain.”
3 Schildberg-Hörisch (Citation2018) surveys a wide range of studies and organizes the measurement and definition methods of preference stablity. Banks, Bassoli, and Mammi (Citation2020); Görlitz and Tamm (Citation2020); and Innocenti, Clark, McGill, and Cuñado (Citation2019) indicate that various life events such as childbirth, illness, and vicarious experiences affect risk attitudes.
4 A within-subjects design is an approach to elicit risk preferences for the same subject by using more than one method.
5 Although all residents in Japan are obliged to join both a public medical insurance and a public pension plan under the universal coverage system, a large percentage of the people have contracts with private life insurance companies for medical insurance and personal pensions. According to Swiss Re (Citation2018), Japan’s life premium volume in 2017 is the world’s third largest after the United States and China.
6 If converted at the most recent rate of JPY 110 to US$ 1, then JPY 4.8 million would correspond to about US$ 44,000.
7 Some of these specific illnesses include cancer, acute myocardial infarction, and stroke. If insured individuals become ill from these diseases, they can receive sums of money equivalent to the amount distributed in the event of the insured individual’s death.
8 If the insured becomes bedridden to the point of requiring care, the insurance may pay out a lump sum or an annuity.
9 Premium information for options 1 and 2 is not available, so it is necessary to estimate these premiums from the total annual premium and the insurance coverage.
10 The study of Dohmen, Falk, Golsteyn, Huffman, and Sunde (Citation2017) shows that the younger the age, the more risk averse.
References
- Anderson, L. R., & Mellor, J. M. (2009). Are risk preferences stable?: Comparing an experimental measure with a validated survey-based measure. Journal of Risk and Uncertainty, 39(2), 137–160.
- Attanasi, G., Georgantzis, N., Rotondi, V., & Vigani, D. (2018). Lottery- and survey-based risk attitudes linked through a multichoice elicitation task. Theory and Decision, 84(3), 341–372.
- Attema, A. E., l’Haridon, O., & van de Kuilen, G. (2019). Measuring multivariate risk preferences in the health domain. Journal of Health Economics, 64, 15–24.
- Banks, J., Bassoli, E., & Mammi, I. (2020). Changing attitudes to risk at older ages: the role of health and other life events. Journal of Economic Psychology, 79, 102208.
- Barseghyan, L., Prince, J., & Teitelbaum, J. C. (2011). Are risk preferences stable across contexts? American Economic Review, 101(2), 591–631.
- Bauermeister, G. F., Hermann, D., & Musshoff, O. (2018). Consistency of determined risk attitudes and probability weightings across different elicitation methods. Theory and Decision, 84(4), 627–644.
- Binswanger, H. P. (1980). Attitudes toward risk: experimental measurement in Rural India. American Journal of Agricultural Economics, 62(3), 395–407.
- Crainich, D., Eeckhoudt, L., & Le Courtois, O. (2017). Health and portfolio choices: A diffidence approach. European Journal of Operational Research, 259(1), 273–279.
- Csermely, T., & Rabas, A. (2016). How to reveal people’s preferences: Comparing time consistency and predictive power of multiple price list risk elicitation methods. Journal of Risk and Uncertainty, 53(2–3), 107–136.
- Dohmen, T., Falk, A., Golsteyn, B. H. H., Huffman, D., & Sunde, U. (2017). Risk attitudes across the life course. Economic Journal, 127(605), 95–116.
- Dohmen, T., Falk, A., Huffman, D., Sunde, U., Schupp, J., & Wagner, G. G. (2011). Individual risk attitudes: Measurement, determinants, and behavioral consequences. Journal of the European Economic Association, 9(3), 522–550.
- Eckel, C. C., & Grossman, P. J. (2008). Forecasting risk attitudes: An experimental study using actual and forecast gamble choices. Journal of Economic Behavior & Organization, 68(1), 1–17.
- Einav, L., Finkelstein, A., Pascu, I., & Cullen, M. R. (2012). How general are risk preferences? Choices under uncertainty in different domains. American Economic Review, 102(6), 2606–2638.
- Fellner, G., & Maciejovsky, B. (2007). Risk attitude and market behavior: Evidence from experimental asset markets. Journal of Economic Psychology, 28(3), 338–350.
- Fujii, Y., & Inakura, N. (2019). Factors widening the gap between hypothetical and actual choices: empirical evidence from the japanese medical insurance market. Forthcoming in Asia-Pacific Journal of Risk and Insurance, 13(2), 20180026, e2153–3792.
- Geweke, J. (2001). A note on some limitations of CRRA utility. Economics Letters, 71(3), 341–345.
- Görlitz, K., & Tamm, M. (2020). Parenthood, risk attitudes and risky behavior. Journal of Economic Psychology, 79, 102189.
- Gürdal, M. Y., Kuzubaş, T. U., & Saltoğlu, B. (2017). Measures of individual risk attitudes and portfolio choice: Evidence from pension participants. Journal of Economic Psychology, 62, 186–203.
- Innocenti, S., Clark, G. L., McGill, S., & Cuñado, J. (2019). The Effect of Past Health Events on Intentions to Purchase Insurance: Evidence from 11 Countries. Journal of Economic Psychology, 74, 102204.
- Ioannou, C. A., & Sadeh, J. (2016). Time preferences and risk aversion: Tests on domain difference. Journal of Risk and Uncertainty, 53(1), 29–54.
- Japan Institute of Life Insurance. 2016. Survey on Life Protection.
- Kamiya, S., & Moridaira, S. (2007). Seimeihoken jyuyou kara mita kiken kaihido suitei (in Japanese) [estimation of risk aversion from Japanese Life Insurance Market]. In A. Kogure (Ed.), Risuku no Kagaku – Kinyuu to Hoken (pp. 73–98). Tokyo: Asakura Shoten.
- León, A. K., & Pfeifer, C. (2017). Religious activity, risk-taking preferences and financial behaviour: Empirical evidence from German survey data. Journal of Behavioral and Experimental Economics, 69(C), 99–107.
- Mehra, P., & Prescott, E. C. (1986). The equity premium: A puzzle. Journal of Monetary Economics, 15(2), 145–161.
- Menapace, L., Colson, G., & Raffaelli, R. (2016). A comparison of hypothetical risk attitude elicitation instruments for explaining farmer crop insurance purchases. European Review of Agricultural Economics, 43(1), 113–135.
- Ministry of Health, Labour and Welfare. 2014. Patient Survey.
- Reynaud, A., & Couture, S. (2012). Stability of risk preference measures: results from a feld experiment on French farmers. Theory and Decision, 73(2), 203–221.
- Schildberg-Hörisch, H. (2018). Are risk preferences stable? Journal of Economic Perspectives, 32(2), 135–154.
- Sharma, S., & Schoengold, K. (2016). Do hypothetical choices indicate true risk preferences?: A comparison of stated and revealed data on decisions over risky outcomes. Cornhusker Economics, 728 .
- Swiss Re (2018) World insurance in 2017: Solid, but mature life markets weigh on growth. Retrieved 29 September 2020. https://www.swissre.com/institute/research/sigma-research/sigma-2018-03.html
- Tausch, F., & Zumbuehl, M. (2018). Stability of risk attitudes and media coverage of economic news. Journal of Economic Behaviour and Organization, 150, 295–310.
- von Hippel, P. T., Scarpino, S. V., & Holas, I. (2016). Robust estimation of inequality from binned incomes. Sociological Methodology, 46(1), 212–251.
- Walelign, S. Z., Nielsen, M. R., Jiao, X., & Jacobsen, J. B. (2019). Is households’ risk attitude robust to different experimental payoffs? Applied Economics Letters, 26(8), 703–706.
- Wik, M., Kebede, T. A., Bergland, O., & Holden, S. T. (2004). On the measurement of risk aversion from experimental data. Applied Economics, 36(21), 2443–2451.
- Wolf, C., & Pohlman, L. (1983). The recovery of risk preferences from actual choices. Econometrica, 51(3), 843–850.
- Yoshikawa, T. (2003). Nihon ni okeru kakei no soutaiteki kikenkaihido no suii: 1970-2002 (in Japanese) [estimation of relative risk aversion in Japan]. Keizai Kenkyu, Seijo University, 163, 73–87.