
ABSTRACT
This paper aims to ascertain the determinants by which individuals decide to use credit cards as a payment method rather than cash; that is, to understand changes in socioeconomic factors on the long-term use of alternatives to cash. Using the data from the waves (2002–2017) of the Spanish Survey of Household Finances (SSHF) and a panel data estimation (static and dynamic), we identify education, age, income and wealth as the main drivers of credit cards as a payment method. We disentangle the effect of age and the cohort effect. We check for nonlinearity problems and card use persistence. A secondary aim is to establish, using a controlled experiment, some of the financial consequences of being a cashless economy.
KEYWORDS:
1. Introduction
The idea of a cashless economy appeared long before the feasibility of cashless instruments (Bátiz-Lazo, Haigh and Stearns, Citation2016). The concept of a cashless economy has become a topic of collective concern, increasingly researched worldwide since 2016. In recent years, European economies have tended to move to a cashless society. The main drivers changing the payment method used are digitalization, financial inclusion and the change in the retail environment from offline to online channels. Evidence from Sweden (only 8% of payment volume in cash in 2020) and the Netherlands, Finland and the United Kingdom shows potential for becoming cash-free economies in a few years. A cashless economy has important positive implications for a society, such as the reduction in the shadow economy due to greater transparency or the decrease in transaction costs. Rogoff and Rogoff (Citation2017) concludes that there are benefits from less use of cash since it discourages tax evasion, illegal immigration and crime and enables governments and central banks to handle economic crises more effectively. In the past, the state, through the issuance of banknotes, played a fundamental role in safeguarding monetary inclusion for its citizens. The nature of cash indeed guarantees universal access to a basic means of payment for everyone. However, Rogoff and Rogoff (Citation2017) states the risk of financial exclusion in a cashless economy, that is, the inability to access appropriate financial services, of some groups. If cash disappears, financial exclusion might be one of the major problems regarding a cashless society, especially in nondeveloped countries. Kodan and Chhikara (Citation2011) posited that an indicator of financial inclusion is the easy access of needy people to banking services available in appropriate forms. People who are physically and mentally separated from modern technologies, unbanked individuals, persons with mental health and physical disabilities can suffer from financial exclusion. Bayero (Citation2015) and Rogoff and Rogoff (Citation2017) encourage the development of policies ensuring financial inclusion for all. Monetary exclusion in a cashless economy is due to a flawed regulatory design in which private operators are de facto put in control of a fundamental social good (Lupo-Pasini, Citation2020). In Sweden, a country close to becoming a cashless economy, citizens were rebelling against a cashless society. The association of Pensioners Fighting to Keep Legal Tender in Sweden collected more than one hundred thousand signatures to convince politicians that Sweden needed to take action to avoid problems of financial exclusion due to the disappearance of cash (Arvidsson, Citation2019).
Spain is an economy still far from becoming cashless. In 2016, cash payments, in terms of value, represented between 62–68% of total payments (Esselink & Hernández, Citation2017). However, in recent years, credit and debit cards have experienced a growth path. First, according to a study from Visa Spain (Esselink & Hernández, Citation2017), half of the purchases were made by card in 2017. Second, the European Central Bank’s (Citation2019) findings show that Spaniards made more than eight thousand million card transactions in 2018. In addition, the current situation of the pandemic is pushing the adoption of a cashless paradigm.
On the one hand, the literature has found different factors affecting the adoption of a new technology (Albort-Morant, Sanchís-Pedregosa, & Paredes Paredes, Citation2021). In this framework, there is a scarcity of papers focused on demographic factors (moderating effects) as determinants to explain the acceptance of the technology. Therefore, with respect to cashless payment methods, the authors consider sociodemographic variables to be key determinants of payment instrument usage decisions (Arango, Huynh, & Sabetti, Citation2015; Carow & Staten, Citation1999; Goczeka & Witkowski, Citation2015; Kim & DeVaney, Citation2001).
In this paper, we focus on sociodemographic variables, which are, to some extent, overlooked in the literature. These are factors affecting the acceptance of the technology and are key factors for in payment instrument usage decisions. These variables are the main drivers explaining the transition from stages of cash payment dominance to noncash payment dominance (Thomas, Citation2013). Understanding the reasons for choosing a particular method of payment is important to recognise the trend to become a cashless society in Spain. Therefore, the main aim of this paper is to provide additional evidence for which factors are determinants of a cashless economy. This research aims to understand which factors among socioeconomic variables (including wealth) influence the proportion of total expenditure made by card (as the alternative to cash). How are these factors evolving to ease the adoption of a cash-free economy? That is, the purpose is to understand changes in socioeconomic factors on the long-term use of alternatives to cash. A secondary aim is to establish, using a controlled experiment, some of the financial consequences of being a cashless economy. For the main aim, we use data from the six waves of the Spanish Survey of Household Finances (SSHF) collected by the Spanish Bank and the Spanish Statistics Bureau. With this dataset, we estimate panel data models (for the whole period). We estimate static and dynamic panel data models, and we check for nonlinearity problems and cash use persistence. For the secondary aim, as we have stated, we run a controlled experiment. The main results show education, age, income and wealth as the main drivers of the choice of cash. We disentangle age and cohort effects. We relate these results with results in previous literature. Finally, the experiment shows that a cashless economy will pay less attention to the costs of the product, which can be translated into greater financial illusion and greater indebtedness of families.
The paper is structured as follows. First we introduce the background. Previous studies have learned which factors might influence expenditures in cash. In this sense, we divide this section into three points: stages from cash to noncash payment dominance, theoretical background and empirical background to understand previous results regarding the importance of socioeconomic factors in explaining the methods of payments. Therefore, we run the analysis using data collected by the Bank of Spain. Running panel data models allows us to reach the main aim. At this point we do a robustness check. Finally, we present the experiment and its results. The paper ends with some concluding remarks.
2. Literature review
2.1. From cash to cashless. Stages
Following the criteria of the European Central Bank (European Central Bank, Citation2010), we can encompass all the payment instruments in two large groups: cash payments and noncash payments. According to Baubeau (Citation2016), cash is a conventional means of anonymous payment. It is a legal tender, so, recognized by a legal system to be valid for fulfilling financial obligations. It is easy to use, and it does not require the need for an intermediary. It is also considered safe in case of crises since consumers can have better control of their budgets. However, it is also an insecure instrument due to the ease of being stolen (World Cash Report, Citation2020). According to the European Central Bank (Citation2010), noncash instruments imply a bank’s authorization to transfer the funds (either paper-based, such as a check, or electronic, such as cards or cryptocurrencies). Both cash and cashless methods have advantages and disadvantages. On the one hand, notes are easy to handle, anonymous, reliable, and widely accepted. On the other hand, cashless methods are more convenient for large transactions and reduce floating costs, as transfers are achieved instantaneously, and they are easier to track for tax collection or law enforcement (Baubeau, Citation2016).
The term cashless society comes from the combination of the disappearance of cash and technological advances towards the dematerialization of money (Baubeau, Citation2016). To date, the UK and Sweden are two of the developed economies that have adopted cashless payments most swiftly.
There are generally four main stages that economies experience during transitions from cash payment dominance to noncash solutions. Thomas (Citation2013) classified each stage as follows: inception, transitioning, tipping point, and advanced. The inception stage appears in developing economies, with cash-based payments accounting for more than ninety percent of the transactions. The lack of available financial infrastructure or adequate social attributes are at the root of this situation. The second stage (transitioning) represents a mixed usage of paper and electronic payments occurring both in developing and developed countries; where in developing economies, cashless transactions are mainly driven by growing middle class transactions, while in developed countries, cashless transactions occur in response to cultural aspects. The tipping point stage arrives when nonpaper transactions account for twenty-nine to forty-five percent of all transactions. However, the final decision to conduct a change in payment method lies with individuals and again reinforcing the importance of sociocultural attributes. In the advanced stage along with developed infrastructure and a high financial inclusion level, individuals intensively accept and use the alternative method of payments. The first shift from the inception to the transitioning stage occurs with large payments made by governments, large employers, and aid distributors to pay electronically, creating changes in the cash flow pattern and the need for the development of financial infrastructure (BFA & Better Than Cash Alliance, Citation2015). The main challenges to undertake in the first stage include investments in payment system infrastructure, regulatory frameworks to build ecosystems, endurance of reliable digital payment experience, and recipient education (Klapper & Singer, Citation2017). The second shift (from transitioning to turning point) happens with increased opportunities for individuals to transfer or spend money digitally (BFA & Better Than Cash Alliance, Citation2015). Electronic payment service suppliers may face obstacles from regulatory issues, such as licensing requirements, new procedures for new forms of financial services, inadequate infrastructure, and underdeveloped distribution channels (World Economic Forum, Citation2018). The third shift involves the transition from a turning point to an advanced stage, when small and everyday purchases are made electronically (BFA & Better Than Cash Alliance, Citation2015). At this point, the demand and supply sides have easy access at low cost to alternative payment methods. The highest concerns for European consumers are fraud and control over payment (MasterCard, Citation2017). If the first two shifts are mainly driven by the need for secure and transparent payments, the last shift is generally driven by the community to enhance convenience and lower costs of transactions.
2.2. Theoretical models
Many studies have been conducted on theoretical models in information systems to determine the factors that influence the adoption of an innovation or technology by individuals (such as credit cards or mobile payments). The theory of reasoned action (TRA) looks at the beliefs within an individual to explain adoption behaviour (Morris & Dillon, Citation1997). TRA behaviour is predicted by an individual’s intention to engage in a given behaviour. Intention in turn is predicted by two factors: the individual’s attitude towards behaviour and subjective norms (Ajzen & Fishbein, Citation1975). In this context, researchers have widely used well-established and robust intention and behaviour models such as the theory of planned behaviour (TPB) (Ajzen, Citation1991). The TPB is essentially an extension to TRA with an additional belief, perceived behavioural control, to explain behavioural intention. Therefore, the TPB assumes three independent determinants of intention: attitude towards the behaviour, subjective norms and perceived behavioural control.
According to the Technology Acceptance Model (TAM), someone using the technology is directly or indirectly affected by three major components: perceived ease of use, perceived usefulness and computer usage (Davis, Citation1985). Davis identified “usage” as an indication of technology acceptance. TAM was modified by Venkatesh and Davis (Citation2000), and the new model was called TAM2. TAM2 included the following variables: usage, intention to use, perceived usefulness, experience, social influence processes (subjective norms, voluntariness and image), and cognitive instrumental processes (job relevance, output quality, result demonstrability and perceived ease of use). Finally, the unified theory of acceptance and use of technology (UTAUT) (Venkatesh, Morris, Davis, & Davis, Citation2003) is a model that aims to explain the acceptance of the technology based on eight theories of technology acceptance. Constructs in UTAUT are performance expectancy, effort expectancy, social influence, facilitating conditions and behavioural intentions. The UTAUT integrates the technology acceptance domain into one theory with “behavioural intention” and “actual usage behaviour” as the main dependent variables. This theory provides new labelling to the original constructs of perceived usefulness and ease of use into performance expectancy and effort expectancy, which are more contemporary for modern technologies.
Empirical studies (Asastani, Kusumawardhana, & Warnars, Citation2018; Ooi & Tan, Citation2016; Thakur, Citation2013) commonly use an online questionnaire measuring each indicator on a Likert-type scale ranging from (1) “strongly disagree” to (5) “strongly agree. Then, we estimate a structural model in which every construct is an endogenous variable. However, little attention has been given to the moderating effects of demographic factors such as age, income and education level. For instance, there is evidence that new remote banking solutions are accessed differently according to the sociodemographic characteristics of users (Blut, Wang, & Schoefer, Citation2016; Malaquias & Hwang, Citation2019). These variables are easily observed, and their temporal pattern is crucial to determine the success of the adoption of an innovation. Additionally, as we have noticed, these variables are relevant to explain the transition from cash payment dominance to noncash payment dominance.
2.3. Socioeconomic factors affecting the adoption of cashless methods
As we have seen, theoretical and empirical literature have found different factors affecting the adoption of a new technology (Albort-Morant et al., Citation2021). In this literature, socioeconomic factors have been considered moderating factors to determine the adoption of an innovation (such as cashless methods). However, in the empirical literature that explains the determinants of choosing among payment methods, socioeconomic factors have been studied in depth.
With respect to education, Kim and DeVaney (Citation2001) show a positive effect of education on expenditures with a credit card. Therefore, a higher level of education increases the amount of outstanding balance. This result is reinforced by other papers that reveal similar results. Goczeka and Witkowski (Citation2015), Bounie and Francois (Citation2006), Carow and Staten (Citation1999) and Arango et al. (Citation2015) show that more educated people are more likely to use electronic methods of payment or cards. Finally, Gómez-González, Jaramillo-Echeverri and Meisel Roca (Citation2016) state that the higher the education level someone has, the higher the probability of using a deposit account is. Although this last study does not examine the likelihood of cashless instrument usage directly, a deposit account is needed to pay when using a noncash method of payment.
Income and the value of real assets also seem to be relevant factors to study the propensity of noncash instrument adoption. The results from Kim and DeVaney (Citation2001), Mantel (Citation2001) and Carow and Staten (Citation1999) coincide; the higher the income is, the higher the likelihood of adopting a cashless method of payment is. Additionally, this result is backed up with the outcome of Gómez-González et al. (Citation2016), which shows that people with higher income are more likely to ask for a deposit account. Kim and DeVaney (Citation2001) also include the value of assets as a determinant, which results in a positive effect on credit card expenditure.
Regarding age, Goczeka and Witkowski (Citation2015) results show that people between 40 and 49 years old are more likely to pay by card, while Mantel’s (Citation2001) paper points out that older people are more likely to pay bills electronically. In contrast, Carow and Staten (Citation1999) paper proves that younger people have a higher probability of paying by card than with cash.
Some authors also include variables such as the place of residence and the number of children. Goczeka and Witkowski (Citation2015) detect that having none or just one child increases the probability of paying by card. Furthermore, the results show that people living in urban areas are more likely to pay by card. Moreover, the results of Gómez-González et al. (Citation2016) reinforce these findings.
Finally, the literature cannot find an apparent effect on gender over the propensity to adopt a cashless tool of payment (Arango et al., Citation2015; Bounie & Francois, Citation2006; Chen & Nath, Citation2008; Mantel, Citation2001). Additionally, some authors also included employment status as a relevant determinant; however, they found opposite results (Arango et al., Citation2015; Gómez-González et al., Citation2016).
3. Data
Most of the analysis is undertaken by using a dataset from the Spanish Survey of Household Finances (SSHF) collected by the Bank of Spain. The main objective of this survey is to obtain detailed information about the income, assets, debts, and expenditures of Spanish households. The survey has been collected through a computer-assisted personal interview (CAPI) since 2002, and it has been gathered every three years while the fieldwork lasted approximately six months. The sample is nationally representative. The Bank of Spain assures representativeness by choosing a random sample but considering some strata regarding income.Footnote1
The surveys let us know the evolution of financial attributes of some households since some participants completed the survey edition after edition. Specifically, 16,211 participants answered only once, 9,946 participants answered twice, 5,309 answered three times, 3,245 answered four times and 1,497 answered five times (see ). Year by year, SSHF included 5,143 observations from 2002, 5,962 observations from 2005, 6,197 observations from 2008, 6,106 observations from 2011, 6,120 observations from 2014 and 6,680 observations from 2017. We use aggregated data merging the SSHF databases to run the panel data analysis. At this point, one could be worried about attrition problems. The pool of individuals changes wave by wave. That is, we have individuals who abandon the sample after being in one, two, three or four waves. As a result, the pool of individuals drops significantly between those with long histories and those with short histories. However, individuals drop out randomly. In this sense, Table A.1 shows that the characteristics of the subsample of individuals of only one history are very similar to those of the whole subsample. Additionally, Table A.2 of the appendix shows that the estimation models of the whole sample and the subsample with only one history behave similarly.
Table 1. Participants of the panel
Finally, we use Section 1 (demographic characteristics), Section 2 (real assets), Secton 4 (financial assets) and Section 8 (means of payment) of the survey. However, we also include other variables created by variables from other sections of the survey. The variable net wealth was created using questions of Section 3 (debts). Additionally, the income variable was generated through variables from Sections 6 (employment status and related income) and 7 (income from real and financial assets).
Our interest is the analysis of characteristics affecting noncash payments. To this end, we computed, as a percentage, the card payments over the total expenditures, including expenditures on cards and cash, to use it as one of the dependent variables of our models. We want to evaluate whether the explanatory variables (gender, age, education level, income and net wealth) exhibit effects on it. In terms of descriptive analysis, shows that the average percentage of payments by card increased in every new wave, considering that, in 2002, the average was 16.42% and continued to grow year after year, ending up at 33.74% of total expenditures made by card in 2017. Second, and supporting the results found in the other explained variable, the monthly average number of transactions by card also increased. The average number of purchases by card also grew from 8.22 (2002) to 18.08 (2017).
Table 2. Evolution in time of the average proportion of card payments and the monthly average number of card transactions
With respect to explanatory variables, on average, males spend more by card than females. Next, we see that participants with a higher education level, on average, pay more by card than participants with a lower education level. However, people with a medium level of education make more transactions by card than people with higher education, which means that more educated people spend more per transaction. We observe that the average participant in the survey is 59 years old. In addition, the household’s average income of the sample is 52.202€, and the average net wealth is 1.014.646€, which contains the value of real and financial assets while subtracting the net debt.Footnote2
4. Results
4.1. Baseline model
For the estimation model, we include the 36,208 observations collected from 2002 to 2017. We use age, education, income and wealth as explanatory variables. Our dependent variable is the proportion of card payments (in euros) with respect to total payments. We have an unbalanced panel since we only have observations at intervals of time. Fixed-effects models are widely used for modelling panel data to reduce the unobserved heterogeneity in cross-sectional models. The entity fixed effects regression controls unobserved variables that differ from one individual to another but remain constant over time. Therefore, this model accounts for heterogeneous household preferences. Conversely, the time fixed effects model controls for unobserved variables that remain the same across entities but change over time.Footnote3
In , we can observe the results of our panel data analysis. In both models (entity and entity and time fixed effects), all variables are statistically significant. Overall, we observe the same signs and significances as expected. The outcome shows that the higher the level of education is, the higher the percentage of expenditures made by card. Moreover, the model’s evolution shows that having a higher level of education impacts spending made by card more. The same positive effects are also found for income and net wealth. In contrast, age negatively affects the dependent variable. In this case, age coefficients decrease over time, which makes us think whether younger people increasingly make more payments by card or older people make less payments by card. These results reinforce the findings of authors such as Kim and DeVaney (Citation2001), Carow and Staten (Citation1999) and Gómez-González et al. (Citation2016), who found a positive effect of income and education and a negative effect of age on the adoption of a cashless method.Footnote4
Table 3. Results of entity fixed-effects and entity and time fixed-effects models
4.2. Cohort effects
The previous effect found of the age variable as a determinant of credit card payment use can be the result of a cohort effect. To disentangle the age effect and the cohort effect, we include a set of cohort dummy variables that indicates whether the individual belongs to the cohort born during the 1920s, 1930s, 1940, 1950s, 1960s, 1970s or 1980s in the previous panel data estimations. With these variables, we plan to disentangle which part of the age effect is a pure age effect and which part is a “cohort effect”. The results are shown in .Footnote5
Table 4. Results of entity fixed-effects and entity and time fixed-effects models
All the coefficients behave similarly with the exception of age. We can see that the effect of age changes its sign; that is, as a cohort becomes older, the proportion of payments by card is higher. Additionally, the set of cohort variables is significant and shows a pattern by which the older the cohort (20s, 30s …), the lower the proportion of payment by card. When we only control for the heterogeneity of individuals (entity fixed effect model), people from their twenties have 61% lower proportion of payments done by card than people born in the nineties. These percentage points are reduced for the youngest cohorts. In the case of people born in the eighties, the difference is not statistically significant. In the model with entity and time fixed effects, the effect is lower and only statistically significant for cohorts in their twenties, thirties and forties.
5. Robustness check
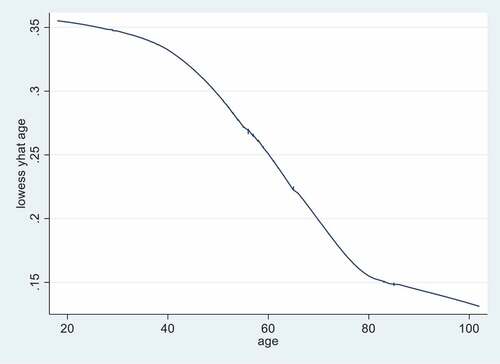
Previous estimations do not address the nonlinear features associated with adoption processes (such as U or S curves). To take this into account, we first show – – the relationship among the proportion of card payments and the main quantitative explanatory variable: age.Footnote6 shows a nonlinear relationship between two variables. shows the relationship of age and the proportion of card payments after the estimation, that is, with the fitted values. This relationship is almost linear. This change can be motivated by two factors: the linearity of the model and the fact that the relationship may be changed after controlling for the rest of the variables. Therefore, to try to disentangle both factors, we have added to the models in the square of the age (). The relationship shown in can be captured by adding age squared. Together, age and age squared can describe a monotonic relationship with one inflection point. If the expected relationship is even more complex, it is possible to add a cubic term. The results show that age maintains its positive sign, but squared age shows a negative sign (both statistically significant). The interpretation is that the effect of age is positive but decreasing.Footnote7 The other parameters behave similar to .
Figure 1. Relationship among ages and the proportion of card payments.
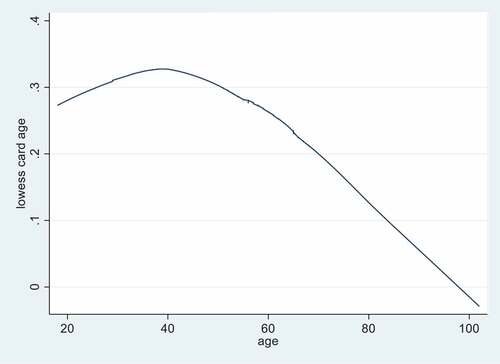
Figure 2. Relationship among ages and the fitted values of the model in.
An additional check is related to the temporal nature of the data. Previous empirical strategies do not account for habit persistence in the use of cash. This fact can be incorporated in a dynamic version of the panel data model. This type of model has been developed with the purpose of incorporating into the estimation the causal relationships that are generated within the model. The most commonly used method is through instrumental variables expressed as lags of the endogenous variable . One of them is the Arellano and Bond estimator (Arellano & Bond, Citation1991), known as the difference generalized method of moments (difference GMM), since it uses the differences of the lags as instruments. With the objective of dealing with panels with a small period of time (as in our case) and therefore with a reduced number of instruments, estimators were developed that included the lags in levels of the variables as instruments (Arellano & Bover, Citation1995). In this case, the model fits a linear dynamic panel-data model where the unobserved panel-level effects are correlated with the lags of the dependent variable, known as the Arellano–Bond estimator. This estimator is designed for datasets with many panels and few periods, and it requires that there be no autocorrelation in the idiosyncratic errors. An estimator similar to the latter is the one developed by Roodman (Citation2009). computes this estimation.Footnote8 We can see that lags of the proportion of card payments are insignificant with the exception of the first lag in the estimation of entity fixed effects, indicating, in this case, positive persistence in the proportion of card payments made by the individual. However, in the estimation with entity and time fixed effects, persistence does not exist. The results for the rest of the variables remains stable. That is, habit persistence in the use of cash or card seems to be captured by the time fixed effects and cohort variables.
Table 5. Results of entity fixed-effects and entity and time fixed-effects models adding squared age
Table 6. Results of dynamic panel data estimations
6. Experiment
Once we evaluate the determinants of the long-term use of card payments (as an alternative to cash), we can address a secondary aim of the paper: the financial consequences of households using cards or mobile devices rather than cash as payment methods. We answer this question by using a controlled experiment. Initially, three means of payment will be compared: cash, card and mobile devices. The assumption is that more importance is attached to the costs of a product when consumers use cash and to a product’s benefits when it is paid by credit card (Chatterjee & Rose, Citation2012). In our case, we introduce a new payment method: mobile payment. Although mobile payments use a credit card, it is based on the concept that the mobile device produces greater intensity in the importance of benefits. That is, each payment method has different consequences for consumers.
6.1. Methodology and design
A total of 150 university students participated in the experiment, and all of them received a small economic incentive that aimed to promote proper performance. University students are usually a very common group in economic experiments since they meet two requirements: maturity and flexibility (Giusti & Raya, Citation2019).
Students are randomly assigned to three groups: cash, card, or mobile device status. They are then informed that they will participate in a word game. This word game is adapted from Chatterjee and Rose (Citation2012) and consists of building sentences from six of the seven words that are listed. For those in the status of a card, a word related to this payment method is included and so on for each of the media (for example, “book we will read a VISA today”; where the solution is “today we will read a book” or “book we will read an ATM today”, where the solution is “today we will read a book”, and with the mobile, “book we will read an ApplePay today”, with the same solution). This seventh word constitutes the “priming” effect of each group. The cash payment group is the control group, and the two credit card payment groups (direct or mobile) are the experimental groups.
After the task of composing the sentences, participants are shown an image of an iPhone X, and then three benefits, related to the product attribute and three costs of a financial nature, are shown alternately. One is displayed per screen. For example, [1] a quick charge that allows 52% of the battery to be recovered in approximately 33 minutes; [2] the price of the device with less storage is close to € 999.99; [3] a 12Mpx triple camera with wide angle, ultra wide angle and telephoto lens; [4] Out-of-warranty repair costs are € 465.76; and so on until reaching three benefits and three costs.
Then, the participants define a reserve price for the product, and then they are shown the characteristics of the iPhone that they have previously seen in a true or false format; that is, for each characteristic, the participants had to make true/false judgements (for example, charge quick recovery of 54% of the battery in approximately 33 minutes: false). The errors that individuals make will be calculated, and the model to be estimated will be defined. The dependent variable is the error in a question. It is assumed that there will be systematic differences in the error rates of the consumers of the credit card, mobile and cash groups. In particular, those of the first and second groups will have a higher error rate for costs and a lower rate for benefits compared with those of the cash group, whose results should be opposite.
6.2. Experiment results
We estimate a regression model for the error. A dummy variable was created for each response to a benefit and cost, where 0 means that the answer was correct and 1 that it was incorrect; therefore, there was a response error. The effective control group was taken as a reference. The results are shown in . It can be observed that in the case of benefits, the coefficients are negative, with the exception of error 1 (“12 Mpx Triple camera … ”). Compared to the cash group, the card and mobile group have a lower error in benefits. The coefficient for the costs also behaves according to expectations since all the coefficients are positive. In the case of cards, one benefit and one cost are statistically significant. In the case of mobile payments, except for one cost, all are statistically significant.
Table 7. Results of controlled experiment
By means of conclusion, in , we present the results of the models estimated for the total error in benefits and costs. Again, in the case of benefits, the coefficients are negative, which translates into a lower margin of error, and in costs, the coefficients are positive, which translates into a greater margin of error. In the case of the group with a mobile device payment method, the results end up being significant. With respect to the paper of Chatterjee and Rose (Citation2012), mobile payment methods have replaced cards as the primary payment method, which generates error in the estimation of costs. If all the households of a country tend to underestimate costs due to the payment method used (card or mobile payment), the risk for excessive indebtedness increases.
Table 8. Total benefits and costs model
7. Conclusions
The main aim of this paper is to understand which factors among socioeconomic variables (including wealth) influence the proportion of total expenditures made by card (as the alternative of cash). Sociodemographic variables are, to some extent, ignored in the literature of factors affecting the acceptance of the technology but are key factors in the literature for payment instrument usage decisions. These variables are the main drivers explaining the transition from stages of cash payment dominance to noncash payment dominance. As a result of this research, we can draw some conclusions about the determinants of the long-term use of card payments. We found common key factors associated with the adoption of card instruments. Variables such as the level of education, income and wealth have a positive effect on the proportion of card expenditure. In contrast, age exhibits a negative relationship, meaning that the older people are, the lower their card expenditure will be. However, this effect turns positive when we control for different cohorts; that is, the older the cohort is, the lower the proportion of card payments is. Once controlled for cohorts, the effect of age is positive but decreases with age. Dynamic estimation shows that once controlled for cohort and introduced time fixed effects, there is no persistence in the use of cash or card.
As a result, as older cohorts die, the way to a cashless economy will become unimpeded, since in the paper we have reported that age favours cashless payments and there is no cash persistence. In addition, the current situation originating from COVID-19 also attempts to be pushing many markets towards a cashless paradigm due to the call of the World Health Organization asking for the usage of contactless payment methods, implicitly cashless methods, to reduce the spread of the pandemic (Accenture, Citation2020). We need to highlight that our study only considers the change in consumer behaviour, which shows that people are increasingly using cashless instruments. Nonetheless, such change also requires the willingness of institutions, such as governments and central banks, to make cash disappear and create an integrated standard system. Moreover, other changes should be made, such as giving inclusive financial access to cashless methods of payment (Bayero, Citation2015) or increasing trust in banks to avoid the fear of future bank defaults (Achord et al., Citation2017).
What implications would ensue from a cashless economy? A cashless society results in positive and negative impacts on the whole community. First, cash contributes to the hidden economy and evasion of taxation by enabling privacy in transactions (Goczeka & Witkowski, Citation2015). According to Immordino and Flaviano (Citation2018), ten more card transactions per capita per year reduce the VAT gap over the GDP by between 8% and 20%. In addition, the usage of cards for cash withdrawals positively affects tax evasion. Therefore, the phenomenon of a cashless society would easily give the government the ability to track transactions to fight against fraud and tax evasion. Connected to that, Achord et al. (Citation2017) also defend that the reduction of cash would hinder unregistered jobs. However, since the eruption of cryptocurrencies, they have become a common way to evade tax and fraud (Jafari, Vo-Huu, Jabiyev, Mera, & Mirzazade Farkhani, Citation2018). While cryptocurrencies have many potential benefits, including faster and more efficient settlement of payments, regulatory concerns centre around their use in illegal trade (drugs, hacks and thefts, illegal pornography, and, even, murder-for-hire), potential to fund terrorism, launder money, and avoid capital controls. Foley, Karlsen, and Putniņš (Citation2019) found that approximately one-quarter of Bitcoin users are involved in illegal activity. The paper estimates that approximately $76 billion of illegal activity per year involves Bitcoin (46% of Bitcoin transactions), which is close to the scale of the U.S. and European markets for illegal drugs. Thus, although a cashless economy would contribute to hindering the shadow economy, it will not eradicate it. Second, a cashless economy gives greater power to financial entities, allowing them to reach and collect useful data for firms and governments.
Third, a cashless economy could influence purchase habits. A secondary aim is to establish, using a controlled experiment, some of the financial consequences of a cashless economy. In line with Chatterjee and Rose (Citation2012), we have found that using cards for mobile payment methods emphasizes product benefits. In contrast, the choice of cash payment increases attention on the acquisition and usage costs of the product. Hence, the card and mobile methods create the illusion that the expenditure is seen in terms of the benefits obtained from the product instead of its cost.
We also faced some limitations during the analysis. Data from the SSHF do not provide us with a variable of choice between cash and cashless instruments of payment, including tools such as cards, mobile payments, and instant payments. Additionally, we had no information about some transaction characteristics, technical skills or other sociodemographic variables. Adding this information will improve the goodness of fit of the estimated models. Additionally, as we have focused on the importance of the moderating effects (sociodemographic variables) on cashless method adoption, we have not studied endogenous constructs of the theoretical models (for example, in the case of UTAUT: performance expectancy, effort expectancy, social influence, facilitating conditions and behavioural intentions). Finally, we use as determinants some dummy variables. Although this is a common practice, adoption or usage is not as simple as is a dummy variable. We call on future research to enrich these variables and make the case for other studies to consider other robust measurements.
These limitations lead to further extensions of our research. Additionally, to convince the public of the positive outcomes of a cashless society, it would be interesting to explain the evolution of fraud and tax evasion in terms of the preference of cashless instruments over cash. Finally, the same study could be replicated in different countries from different stages of cash dominance. By observing the differences between them, we can analyse the determinants of becoming a cashless society of potential economies, a very present concern in international markets. However, this could only be possible in other developed economies where there is availability of data and good financial institutions.
Acknowledgments
The authors thank the Spanish Ministry of Competitiveness (ECO2016-78816R) for financing.
Disclosure statement
No potential conflict of interest was reported by the author(s).
Additional information
Funding
Notes on contributors
Josep Maria Raya
Josep Maria Raya is a Professor of the Tecnocampus (Universitat Pompeu Fabra). He has a PhD degree in Economics since 2005. He is the Chair of ”Habitatge i Futur” of APCE-UPF His main topics of research are: housing economics and tourism economics. He has published in more than 30 Journals of the JCR, some of them in top field Journals. He has won a prize for the best paper published among 2014-2016 in SERIES. He has been cited more than 1,300 times (google citations).
Claudia Vargas
Claudia Vargas is Double Degree graduated in Marketing and Business in Tecnocampus (Universitat Pompeu Fabra). She worked as a Research Assistant in Tecnocampus (Universitat Pompeu Fabra). Currently works as an analyst in Atmira. This paper was part of her Final Degree Project.
Notes
1 Surveys to study households’ financial attributes, tend to display an asymmetrical distribution. The Bank of Spain decided to overrepresent wealthy households to guarantee a large enough sample to drive conclusions about wealthy families.
2 Table A.1 presents the definition of the variables and the sample mean.
3 Even though there was the possibility to use random effects instead of fixed effects, the Hausman test showed that the fixed-effects model was better than the random effects model (chi-square 261.02***). We reject null hypothesis that both estimations are equal. The results show that the coefficients of the fixed-effects model are consistent and efficient, whereas the coefficients of the random-effects model are inconsistent but efficient. Additionally, we have tested the importance of the time parameters (F(5,19,973) = 32.93***). We reject the null hypothesis that time effects are not important. Finally, we compute a Wald test in order to test for heteroscedasticity. We reject the null hypothesis of homocedasticity (chi-square = 9*1037***). As a result, a robust standard error estimation is computed.
4 We have estimated cross-sectional models. The results were similar. The only difference is that the coefficients in panel data estimations are lower than in the cross-sectional models. That is, taking into account heterogeneity, the effect of the explanatory variables have decreased. The results can be obtained by request to authors.
5 Again, the Hausman test (chi-square:197.59) states fixed effects as the best estimation.
6 This analysis can be easily reproduced for income and wealth variables.
7 In fact, if we add a cubic term of age, this term is not statistically significant.
8 Simply adding lags of the dependent variable to the fixed effects estimation do not significantly change results. Additionally, an Arellano Bond serial correlation test was computed. The results do not reject the null hypothesis of no autocorrelation. Additionally, the Sargan test does not reject the null hypothesis and shows that the instruments are valid.
9 The author computed the variable by dividing the monthly spending by card by the total expenditures, which means the sum of the expenditures on card and the expenses by cash.
10 Income from the previous year.
References
- Accenture. (2020). The top 8 ways Covid-19 will impact payments. Accenture.
- Achord, S., Chan, J., Collier, I., Nardani, S., & Rochemont, S. (2017). A cashless society: Benefits, risks and issues (Interim paper). Institute and Faculty of Actuaries
- Ajzen, I. (1991). The theory of planned behavior. Organizational Behavior and Human Decision Processes, 50(2), 179–211.
- Ajzen, I., & Fishbein, M. (1975). A Bayesian analysis of attribution processes. Psychological Bulletin, 82(2), 261.
- Albort-Morant, G., Sanchís-Pedregosa, C., & Paredes Paredes, J. R. (2021). Online banking adoption in Spanish cities and towns. Finding differences through TAM application. Economic Research-Ekonomska Istraživanja. 1–19. doi:10.1080/1331677X.2021.1945477
- Arango, C., Huynh, K., & Sabetti, L. (2015). Consumer payment choice: Merchant card acceptance versus pricing incentives. Journal of Banking & Finance, 55, 130–141.
- Arellano, M., & Bond, S. (1991). Some tests of specification for panel data: Monte Carlo evidence and an application to employment equations. The Review of Economic Studies, 58(2), 277–297.
- Arellano, M., & Bover, O. (1995). Another look at the instrumental variable estimation of error-components models. Journal of Econometrics, 68(1), 29–51.
- Arvidsson, N. (2019). Building a cashless society: The Swedish route to the future of cash payments. London UK: Springer Open.
- Asastani, H. L., Kusumawardhana, V. H., & Warnars, H. L. H. S. (2018). Factors affecting the usage of mobile commerce using technology acceptance model (TAM) and unified theory of acceptance and use of technology (UTAUT). In 2018 Indonesian association for pattern recognition international conference (INAPR), Jakarta, Indonesia. (pp. 322–328). IEEE.
- Bátiz-Lazo, B., Haigh, T., & Stearns, D. L. (2016). Origins of the Modern Concept of a Cashless Society, 1950s–1970s. In The Book of Payments (pp. 95–106). London: Palgrave Macmillan.
- Baubeau, P. (2016). Dematerialization and the cashless society: A look backward, a look sideward. In B. Bátiz-Lazo & L. Efthymiou (Eds.), The book of payments (pp. 85–94). Palgrave Macmillan UK.
- Bayero, M. A. (2015). Effects of cashless economy policy on financial inclusion in Nigeria: An exploratory study. Procedia - Social and Behavioral Sciences, 172, 49–56.
- BFA & Better Than Cash Alliance (2015). The Journey Towards “Cash Lite“. New York, USA.
- Blut, M., Wang, C., & Schoefer, K. (2016). Factors influencing the acceptance of self-service technologies: A meta-analysis. Journal of Service Research, 19(4), 396–416.
- Bounie, D., & Francois, A. (2006). Cash, check or bank card? The effects of transaction characteristics on the use of payment instruments. Telecom Paris Economics and Social Sciences Working Paper No. ESS-06-05.
- Carow, K. A., & Staten, M. E. (1999). Debit, credit, or cash: Survey evidence on gasoline purchases. Journal of Economics and Business, 51(5), 409–421.
- Chatterjee, P., & Rose, R. L. (2012). Do payment mechanisms change the way consumers perceive products? Journal of Consumer Research, 38(6), 1129–1139.
- Chen, L., & Nath, R. (2008). Determinants of mobile payments: An empirical analysis. Journal of International Technology and Information Management, 17(1), 9–20.
- Davis, F. D. (1985). A technology acceptance model for empirically testing new end-user information systems: Theory and results (Doctoral dissertation, Massachusetts Institute of Technology).
- Esselink, H., & Hernández, L. (2017). The use of cash by households in the euro area. ECB Occasional Paper. European Central Bank.
- European Central Bank. (2010). The payment system. Payments, securities and derivatives, and the role of the Eurosystem (pp. 25). Brussels.
- European Central Bank. (2019). EU member states with the most cashless payment transactions in 2018 (in millions).
- Foley, S., Karlsen, J. R., & Putniņš, T. J. (2019). Sex, drugs, and bitcoin: How much illegal activity is financed through cryptocurrencies? The Review of Financial Studies, 32(5), 1798–1853.
- Giusti, G., & Raya, J. M. (2019). The effect of crime perception and information format on tourists’ willingness/intention to travel. Journal of Destination Marketing & Management, 11, 101–107.
- Goczeka, Ł., & Witkowski, B. (2015). Determinants of card payments. Applied Economics, 48(16), 1530–1543.
- Gómez-González, J. E., Jaramillo-Echeverri, J., & Meisel-Roca, A. (2016). El uso de efectivo y tarjetas débito y crédito en Colombia. Borradores de Economía; No. 950.
- Immordino, G., & Russo, F. F. (2018). Cashless payments and tax evasion. European Journal of Political Economy, 55, 36–43.
- Jafari, S., Vo-Huu, T., Jabiyev, B., Mera, A., & Mirzazade Farkhani, R. (2018). Cryptocurrency: A challenge to legal system. SSRN Electronic Journal. doi:10.2139/ssrn.3172489
- Kim, H., & DeVaney, S. A. (2001). The determinants of outstanding balances among credit card revolvers. Financial Counseling and Planning, 12(1), 67–77.
- Klapper, L., & Singer, D. (2017). The opportunities and challenges of digitizing government-to-person payments. The World Bank Research Observer, 32(2), 211–226.
- Kodan, A. S., & Chhikara, K. S. (2011). Status of financial inclusion in Haryana: An evidence of commercial banks. Management and Labour Studies, 36(3), 247–267.
- Lupo-Pasini, F. (2020). Is it a wonderful life? Cashless societies and monetary exclusion. Eview of Banking and Financial Law, L(40), 155.
- Malaquias, R. F., & Hwang, Y. (2019). Mobile banking use: A comparative study with Brazilian and US participants. International Journal of Information Management, 44, 132–140.
- Mantel, B. (2001). Why do consumers pay bills electronically? An empirical analysis. Economic Perspectives, 25(4), 32–48.
- MasterCard. (2017). Masterindex 2017. Pan-European e-commerce and new payment trends. In S. T. More (Ed.). New York, USA: Scholar Press Limited.
- Morris, M. G., & Dillon, A. (1997). How user perceptions influence software use. IEEE Software, 14(4), 58–65.
- Ooi, K. B., & Tan, G. W. H. (2016). Mobile technology acceptance model: An investigation using mobile users to explore smartphone credit card. Expert Systems with Applications, 59, 33–46.
- Rogoff, K., & Rogoff, K. S. (2017). The curse of cash. New York, USA: Princeton University Press.
- Roodman, D. (2009). How to do xtabond2: An introduction to difference and system GMM in Stata. The Stata Journal, 9(1), 86–136.
- Thakur, R. (2013). Customer adoption of mobile payment services by professionals across two cities in India: An empirical study using modified technology acceptance model. Business Perspectives and Research, 1(2), 17–30.
- Thomas, H. (2013). Measuring progress toward a Cashless Society, mastercard.
- Venkatesh, V., & Davis, F. D. (2000). A theoretical extension of the technology acceptance model: Four longitudinal field studies. Management Science, 46(2), 186–204.
- Venkatesh, V., Morris, M. G., Davis, G. B., & Davis, F. D. (2003). User acceptance of information technology: Toward a unified view, 27(3), 425–478. MIS quarterly.
- World Cash Report (2020). McKinsey & Company.
- World Economic Forum. (2018). Addressing E-Payment Challenges in Global ECommerce. Davos, Switzerland.