
 ?Mathematical formulae have been encoded as MathML and are displayed in this HTML version using MathJax in order to improve their display. Uncheck the box to turn MathJax off. This feature requires Javascript. Click on a formula to zoom.
ABSTRACT
The study aims to explore the spatial association network characteristics of biased green innovation in the manufacturing sector and its core drivers. This study constructs a Malmquist-Luenberger decomposition index model to identify the input and output biases of green technological innovation (GIIM and GIOM) in the manufacturing industry. This study uses a modified gravity model and social network analysis method to conduct a robust assessment of GIIM spatial association network of 30 provinces in China from 2012 to 2021. The results show: (1) The GIIM association network structure is stable and has good accessibility, with close connections between provinces and blocks, and significant spillover effects between provinces. (2) The regional network shows a “core-periphery” spatial variation, with the core area expanding and the peripheral area shrinking. (3) The digital transformation characteristics of the network components and the intensity of environmental regulation have a significant impact on GIIM.
1. Introduction
The manufacturing sector has been instrumental to China’s economic expansion, contributing nearly 30% to the nation’s GDP in 2021, a notable proportion compared to other major global economies, as reported by the National Bureau of Statistics. Despite this success, the sector casts a long shadow of environmental concerns. It is a major consumer of energy and a major emitter of carbon, accounting for over 30% of China’s total energy consumption and approximately 35% of its total carbon emissions as of 2020. These statistics underscore the urgent need for a sustainable shift (W. Chen et al., Citation2017; Qin et al., Citation2021). In alignment with the “Made in China 2025” strategy, green development has been identified as a foundational principle for the manufacturing industry, advocating for the widespread implementation of green manufacturing practices to facilitate the industry’s ecological transformation (Wübbeke et al., Citation2016).
At the heart of this transformative agenda is green technological innovation (Yuan & Xiang, Citation2018), which, through the adoption of eco-friendly production technologies, has the potential to significantly curb energy consumption and pollution. Such innovations not only promise enhanced energy efficiency and cost reductions but also bolster the long-term competitiveness of the manufacturing sector (Herring & Roy, Citation2007). In the context of a developing nation like China, the pivot towards green innovation is key, promising environmental improvement while also carving out novel market and growth avenues (Baloch et al., Citation2021). The transition to green technological innovation necessitates a departure from traditional resource-intensive methods to those that prioritize technology and intelligent inputs. Innovation with an environmental bias is essential in steering this change. He and Wang’s (Citation2015) research corroborates that innovation with such a bias can improve corporate environmental performance and foster sustainable development (He & Wang, Citation2015). In today’s climate, directing innovation resources toward the development and implementation of green technologies is imperative for the green economic transformation of China.
Moreover, the innovation of green technology in the manufacturing sector is embedded within a dynamic spatial network, influenced by an interplay of policy, market, technology, and environmental factors (Malecki & Edward, Citation2008). A firm’s innovative endeavours are significantly shaped by its regional innovation ecosystem (Audretsch et al., Citation2022; Radziwon et al., Citation2022). With advancements in information and digital technologies, traditional geographical limitations are becoming less pronounced, leading to a complex network of cross-regional spatial interactions within China. This study hypothesizes that green innovation in China’s manufacturing sector is not only contingent upon the direction of green technology innovation bias but is also characterized by a pronounced spatial dependency.
To sum up, this research endeavours to dissect the inclination towards green technological innovation within the manufacturing realm, elucidating its spatial network dynamics and identifying the catalysts behind it. By clarifying these aspects, we seek to provide a clearer picture of the opportunities and challenges confronting China’s manufacturing sector on its path to a green future.
The structure of the study is as follows: Section 2 provides a comprehensive literature review, contextualizing our study within the existing body of work on bias in technological innovation and the networks within innovation spaces. Section 3 outlines the research methodology and delineates the data sources utilized. Section 4 presents the core analytical findings along with pertinent discussion, which focuses on the spatial correlation of input-biased green innovation in the manufacturing sector. Section 5 conducts an empirical analysis of drivers. Finally, Section 6 summarizes the primary conclusions, discussions and offers corresponding policy recommendations.
2. Literature review
2.1. Research related to biased technological innovation
David and van de Klundert (Citation1965) study was a seminal work in gauging the trajectory of technological progress, using the CES production function to evaluate the factor bias of technology (David & van de Klundert, Citation1965). Later, Klump in 2012 employed the standardized supply-side system approach to quantify the orientation of technological innovations (Klump et al., Citation2012). However, as the complexity of input factors grew, the fixed elasticity substitution of the CES function fell out of favor, with the Translog production function becoming the preferred tool for scholars to measure the directionality of technological progress. For example, Karanfil and Yeddir-Tamsamani (Citation2010) utilized the Translog production function to assess energy-focused technological innovations in France, pinpointing energy prices as the key determinant of directional bias (Karanfil & Yeddir-Tamsamani, Citation2010). Subsequent research, starting with Fare et al., began incorporating nonparametric methods to measure directional bias (Färe et al., Citation1997). This involved analyzing shifts in the production frontier over time that are non-proportional, leading to alterations in the marginal output ratios of various factors. A common technique is the DEA-Malmquist index method, which evaluates technological progress from both input and output dimensions, examining the influence of its directional components on total factor productivity (P.-C. Chen & Yu, Citation2014; Färe et al., Citation1997; Peng et al., Citation2019; Weber & Domazlicky, Citation1999). The Malmquist index method mitigates the subjective bias that can arise from production function assumptions and reveals the impact of the orientation of technological innovation on different inputs.
Yet, when it comes to green technological innovation, it’s imperative to acknowledge the variety of input factors and the potential for environmentally detrimental outputs. Chinese researchers, like Yang et al. (Citation2019), have innovated by integrating the SBM directional distance function with the Malmquist-Luenberger index, formulating a novel methodology to gauge green technological progress.
Building upon this foundation, our study factors in non-desired outputs and undertakes a comprehensive decomposition of the Malmquist-Luenberger index. This allows us to measure the intergroup bias of green technological innovation within the context of resource and environmental impacts, examining both the inputs and the outputs. This multidimensional approach provides a more nuanced understanding of the green innovation trajectory, reflecting the intricate balance between economic progress and environmental stewardship.
2.2. Research related to innovation networks
The field of spatial network analysis emerged from Castells’ Space of Flows theory, which posits that society is a spatial form constituted by the flows of various elements (Castells & Cardoso, Citation2006). Building on this, the globalization and world cities research network has deepened the study of spatial networks by linking elements such as infrastructure and corporate organization with spatial data (Derudder & Taylor, Citation2021). Scholars like Rogers (Citation2004) and Feldman (Citation2016) have further enriched this domain by introducing innovation into spatial network studies, uncovering the significant impact of network structures on the diffusion of innovation. For instance, Huggins et al. (Citation2023) examined the relationship between the regional concentration and dispersion of innovative agents within specific industries and their capacity for innovation. Research on the spatial effects of green innovation frequently employs spatial econometric methods, utilizing tools like the Moran’s I (Gai et al., Citation2022), kernel density estimation (P. Zhao et al., Citation2023), and Theil index (N. Zhao et al., Citation2021) to investigate the spatiotemporal evolution and differentiation of green innovation (Liang et al., Citation2022; Xuhui & Yitao, Citation2023; Zhou et al., Citation2021).
Recent studies on green innovation predominantly rely on “attribute data”, which, as Z. Chen et al. (Citation2022) note, inadequately capture the interactive mechanisms between regions. Analysing spatial association networks from a relational viewpoint, as advocated by CHONG and QIN (Citation2017), yields more insightful findings than merely examining “attribute data” through traditional spatial econometric methods. This relational perspective reveals a consensus in the literature: regions with higher innovation efficiency often occupy central positions in these networks. These regions leverage locational advantages to access extensive innovative resources, enhancing their innovative efficiency (Feng et al., Citation2022; Guan et al., Citation2015). In contrast, regions with lower innovation efficiency benefit less from network effects, leading to uneven regional innovation development (Min et al., Citation2020).
In the context of China’s sustainable development goals, the equitable regional distribution of green innovation efficiency is paramount. However, research by SUN et al. (Citation2022) indicates a persistent core-periphery structure in green technological innovation, pointing to a significant relationship between directed investment in green technology innovation elements and innovation outcomes. This relationship, coupled with the increasing degree of interregional connectivity, suggests that a region’s green innovation propensity is increasingly influenced by its neighbours’ activities.
Despite the recognition of spatial correlation in green innovation, existing research has shortcomings that necessitate comprehensive resolution. Traditional spatial exploratory analyses and econometric models primarily focus on the heterogeneity in spatial distribution due to geographical proximity. These approaches, however, overlook the analysis of internal biases and regional holistic perspectives, thereby constraining the understanding of the characteristics and generative mechanisms of spatial correlation networks. The predominant focus on attribute data, with scant exploration of relational data in complex spatial networks, leads to inadequate differentiation of the roles, functions, and mechanisms of different regions within the green innovation bias network. Therefore, in the face of uneven green innovation efficiency and strengthened spatial correlations, employing social network analysis offers a more comprehensive exploration of interregional relationships. This method not only unravels the mechanisms of spatial relationships but also supports more rational input allocation, providing insights for promoting balanced development in green innovation.
This study examines 30 provincial-level administrative regions, employing a Malmquist-Luenberger decomposition index model to assess the bias in green innovation in manufacturing (GIBM) from 2012 to 2021. GIBM refers to a tendency, inclination, or preference that is embedded within eco-innovation. Additionally, it adopts a modified gravity model to construct an input biases of green technological innovation (GIIM) spatial matrix, a spatial matrix designed to measure the regional disparities in green technological inputs biases. This research analyses the characteristics of the spatial network structure of GIIM using social network methods. Furthermore, QAP regression is utilized to investigate the drivers of GIIM spatial correlation networks, thereby elucidating the formation mechanism of these spatial correlation networks (Krackardt, Citation1987).
3. Materials and methods
3.1. Measurement of the GIBM
3.1.1. Construction of the indicator system
Drawing upon relevant literature (Egilmez et al., Citation2013; Sims et al., Citation1974; Zheng et al., Citation2021), this study defines the key components in the context of manufacturing production as follows: Input factors are identified as four key elements – capital, land, labour, and energy. The desired output is conceptualized primarily as economic output indicators. However, this study also includes technological innovation in the desired output, reflecting a more realistic approach to contemporary demands. The non-desired output typically encompasses waste emissions (Kaneko & Managi, Citation2004), including a range of pollutants such as Chemical Oxygen Demand (COD), ammonia emission, CO2 emissions, sulfur dioxide, nitrogen oxide, wastewater, and solid waste (Liu et al., Citation2022; Yang et al., Citation2019; B. Zhang et al., Citation2022). Detailed indicators are outlined in .
Table 1. GIBM evaluation index system.
3.1.2. Measurement method
We assume there are decision-making units (DMUs) in the manufacturing, each utilizing
types of inputs, producing
types of expected outputs, and
types of unexpected outputs in each period. For the
DMU in period
, the set of input factors is denoted as
, the set of expected output factors as
, and the set of unexpected output factors as
. If the Directional Distance Function (DDF) satisfies:
Where gauges the distance of the evaluated DMU to the production frontier in the direction of
By integrating the constraint condition of EquationEquation (1)
(1)
(1) with the Malmquist-Luenberger (ML) index method, the ML index can be decomposed into efficiency change (
) and technological change (
). Further, the
index is decomposed to obtain the input-biased of green technological innovation in manufacturing (GIIM) and the output bias of green technological innovation (GIOM) (Färe et al., Citation1997). The specific calculation method is as follows:
Factor input bias is measured based on the change in the marginal rate of substitution of factors (Weber & Domazlicky, Citation1999). This study examines the energy substitution bias (ESB) index of green technology innovation in manufacturing to determine the network node attributes. The ESB is expressed as follow:
where refers to capital input and
refers to energy input. When there is technological innovation from period
to
,
is the ratio of the marginal substitution rates of factors
and
from stage
to
, reflecting the factor changes in innovation. When
,
, that is
, it indicates the energy-saving green technology innovation.
3.2. Network construction and network analysis methods
3.2.1. Network construction
The identification of spatial linkages is crucial for analyzing the spatial linkage network of GIBM in China using social network methodologies (Borgatti & Foster, Citation2003; Cassi et al., Citation2012). Given that spatial linkages often diminish with increasing geographical distance – a phenomenon known as “distance decay” highlighted by Basile et al. (Citation2012)—the closer the geographical proximity, the stronger the linkages tend to be. Therefore, this study proposes the use of a modified gravity model to construct the spatial association network. This approach integrates considerations of green manufacturing with economic and geographical distances, thereby offering a more nuanced understanding of the spatial association characteristics. Additionally, the economic distance between regions is a significant factor influencing these linkages. Incorporating population and economic scale into the gravity model (Кузнецов et al., Citation2014), allows for a more accurate depiction of the spatial evolution trends. In this research, we adapt the gravity model to determine the spatial correlation network of green manufacturing among different regions. The specific calculation formula employed is outlined as follows:
In EquationEquation (4)(4)
(4) :
denotes the spatial correlation strength (gravitational value) of GIBM between provinces
and
;
and
denote the green manufacturing development indexes of provinces
and
, respectively;
denotes the contribution rate of province i to
;
is the geographic distance between provinces i and j;
and
denote the level of economic development of provinces i and j, as measured by the total GDP;
and
are the per capita GDP of the two regions, respectively.
Building upon this framework, this study acknowledges the presence of a threshold value in the strength of spatial relationships. Consequently, this study proposes using the average value of each row in the association strength matrix derived from the gravity model as this threshold value. Following this, a 0–1 matrix is constructed, determining the presence or absence of association relationships. This process culminates in the formation of a directed binary spatial association matrix.
3.2.2. Social network analysis methods
This study delves into the spatial association network of GIBM, employing social network analysis as a framework (Fritze et al., Citation2018). In examining the overall structure of the network, we focus on several key characteristics. Network Density () is used to gauge the complexity of the relationships within the green manufacturing association network. It reflects the intricacy of connections among various nodes. The number of nodes and the quantity of relationships within the network indicate the network’s relevance (
), which is a measure of the GIBM network structure’s stability. Network Efficiency (
) is employed to quantify the characteristics of GIBM association channels. Furthermore, Network hierarchy (
) is analysed to understand the degree of asymmetric accessibility within the network. This metric is crucial in evaluating the hierarchical structure of access to resources and information. The presence of small-world characteristics within the network is scrutinized to assess the efficiency and accessibility of resource dissemination across the network. The calculations for
,
,
and
is as presented in Eq. 5–8:
where denotes the number of existing connections in the GIBM network,
denotes the total number of nodes,
denotes the number of redundant connections in the network, and
denotes logarithm of symmetric reachable points. This study draws on these eigenvalues to characterize the overall GIBM network, which focuses on analysing the associations and structure among the members of the network (Doreian & Conti, Citation2012).
In quantifying the position and role of nodes, individual characteristics such as metric degree-centrality (), betweenness-centrality (
), and closeness-centrality (
). can be measured as Eq. 9–11:
Among them, the level of Dc reflects the strength of the network association ability. If the value of is high, the node is at the center of the network.
mainly reflects the degree of control of the node over the relationship between other nodes, and the higher value indicates that it is able to control the interactions of other nodes in terms of GIBM.
reflects the node’s ability to act on its own, i.e., the higher the value is, the lower the degree of influence it is subjected to by other nodes. Where n is the number of other nodes in the network associated with a particular node,
denotes the shortcut distance between two nodes, and
denotes the number of shortcuts between nodes
and
that pass through other nodes k.
In addition to the previously mentioned analyses, this study extends its investigation to the internal structure and spillover paths of GIBM spatial networks through block mode analysis. This analysis employs the iterative correlation convergence method, a prominent technique for deciphering the intricate dynamics within spatial networks. Block mode analysis is a principal method used for spatial clustering, essential for uncovering the internal structural state of the network. This method facilitates the evaluation of each region’s position and role within the overall network. The classification of these regions, based on their respective roles and positions, is detailed in . This categorization is instrumental in understanding the varying influences and interactions among different areas within the GIBM spatial network.
Table 2. Classification basis of the four major sectors.
3.2.3. QAP method
In this study, the spatial correlation network is constructed utilizing relational data. To address the issue of multicollinearity among the influencing factors of the correlation network, which challenges the assumption of variable independence, Quadratic Assignment Procedure (QAP) regression is employed as an alternative to traditional econometric modeling. The advantage of QAP regression lies in its foundation on relational data, which relaxes the strict requirement of independence between variables (Doreian & Conti, Citation2012). This methodological choice significantly enhances the robustness of the analysis results. The application of QAP regression in this study is centered on examining the impact of biased green innovation. Additional control variables, including economic factors, industrial attributes, and geographical location, are incorporated. This comprehensive approach is aimed at thoroughly investigating the drivers of the GIIM spatial correlation network. The ultimate goal is to unravel the formation mechanism of the GIIM correlation relationships across different regions, providing a deeper understanding of the dynamics shaping GIIM development.
3.2.4. Data sources
The data utilized in this study are sourced from a range of authoritative publications. These include the China Statistical Yearbook, China Energy Statistical Yearbook, China Environmental Statistical Yearbook, China Science and Technology Statistical Yearbook, and China Ecological Environment Statistical Yearbook. Additionally, relevant data from various provincial statistical yearbooks have also been incorporated. This comprehensive dataset ensures a robust and thorough analysis of the spatial correlation network of GIIM.
4. Results
4.1. Characterization of GIBM
By measuring the Malmquist-Luenberger multidimensional decomposition, we obtain the GIBM of 30 provinces in China from 2012 to 2021.Footnote1 These indices are then decomposed based on regional disparities in the level of GIBM across the country, specifically focusing on the differences among the East, Central, and West regions (refer to ).
Figure 1. Overall evolution of GIBM in China.
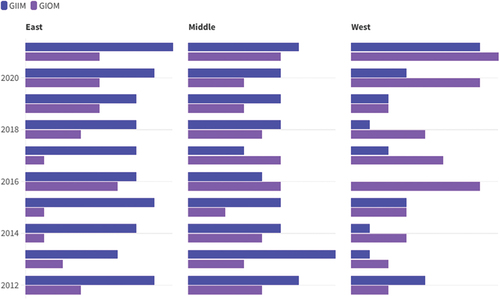
In , the data illustrates a clear trend in green technological innovation in China, particularly before 2015. During this period, innovation was primarily driven by input side. A notable aspect of this trend is the regional disparity: the central and eastern regions of China exhibited significantly higher levels of green technological innovation compared to the western regions. This disparity can be attributed to two main factors. Firstly, the eastern and central regions possess a stronger foundation and greater capacity for innovation. Secondly, these regions have shown a pronounced focus on technological innovation aimed at energy conservation. This strategic orientation is directed towards reducing energy consumption and minimizing costs for enterprises.
Over the decade from 2012 to 2021, two major developments are evident in the realm of China’s green technology innovation. The first is a noticeable shift towards emphasizing the input aspect of green technology innovation across the country. The second development is the increasing uniformity in the efficiency of green technology innovation across different regions, suggesting a movement towards a more balanced regional development in this sector.
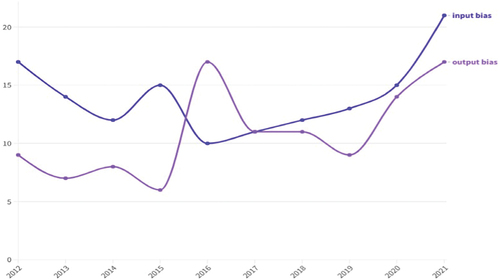
From the trend chart depicting provincial GIBM (), both GIIM and GIOM exhibit an overall fluctuating upward trajectory, indicating a sustained enhancement in the efficiency of green technological innovation in China. Notably, the predominant driver was the improvement in the efficiency of input factor substitution across all years, with the notable exception of 2016. This anomaly can be primarily attributed to the unveiling of the “Made in China 2025” initiative in 2015, which outlined goals centered around innovation-driven growth and environmentally sustainable development (Zenglein & Holzmann, Citation2019). Following this, various regions implemented incentive policies with a particular emphasis on innovation in emission reduction (Wang et al., Citation2020).
Figure 2. GIBM trends in China.
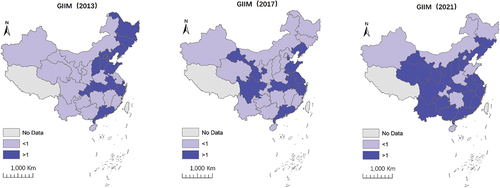
Despite these dynamics, a comprehensive analysis reveals a predominant trend towards input-biased green technology innovation across the majority of Chinese provinces. Our comparative analysis of GIIM for the years 2013, 2017, and 2021 () demonstrates a similarity in innovation bias among neighbouring provinces, with a noticeable expansion in the range. This observation suggests a robust spatial correlation in the bias of green innovation development within China’s manufacturing industry, indicative of a complex and interconnected network relationship. Consequently, an in-depth examination of this spatial network’s structural characteristics becomes imperative to understand its implications for future green technology policy and industry development.
Figure 3. Overall evolution of GIIM in China.
4.2. Characteristics and evolution trend of spatial association whole network in GIIM
Utilizing a modified gravitational model, this study establishes a matrix to analyze the spatial correlation of the GIIM across Chinese provinces. Notably, 2016 emerges as a pivotal year in the transition towards a green technology innovation bias. Accordingly, the years 2012, 2016, and 2021 were selected for comparative analysis. This selection was based on their representation of different stages in China’s green innovation trajectory. To visualize the spatial correlation network of GIIM levels, the UCINET tool Netdraw was employed. This tool effectively maps the intricate interconnections among provinces, revealing patterns and trends in green technology innovation. The study introduces a novel approach to node attributes, employing to categorize nodes. Nodes colored blue represent provinces where green innovation input is primarily characterized by energy factor substitution, indicative of a strong energy-saving bias in technology innovation. Conversely, nodes colored red signify a different characteristic, which requires further clarification in the context of green innovation.
By integrating these node attributes with the degree centrality of each node, the study uncovers more nuanced insights into the GIIM spatial correlation relationships. illustrate this dynamic interconnection, highlighting the absence of isolated points among provinces and underscoring a pronounced network structure. The analysis reveals significant variances in the relationships between nodes.
Figure 4. China GIIM Spatial Association Network in 2012.
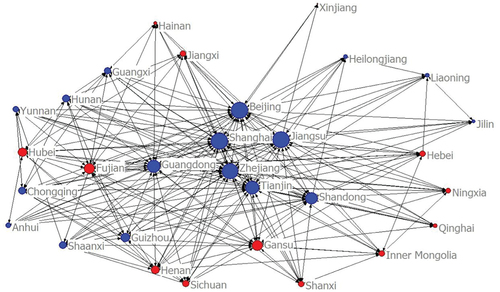
Figure 5. China GIIM Spatial Association Network in 2016.
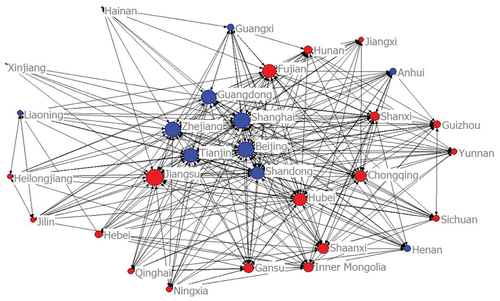
Figure 6. China GIIM Spatial Association Network in 2021.
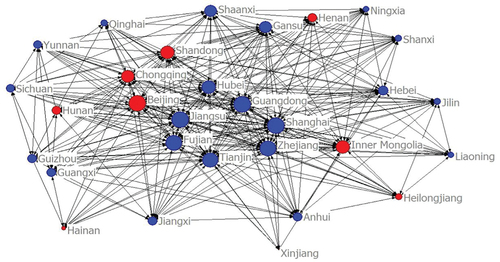
A particularly noteworthy trend is observed in coastal regions such as Beijing, Shanghai, Jiangsu, Zhejiang, Tianjin, and Guangdong. These areas consistently exhibit high correlation strengths and an increasing bias towards energy-saving innovations. This trend not only underscores the regional disparities in China’s green technology innovation landscape but also reflects the broader developmental patterns prioritizing energy efficiency and sustainable practices.
4.3. Characteristics of the structure of the spatial network
This study further explores the overall structural characteristics of the GIIM spatial association network from 2012 to 2021, using various indicators as illustrated in . Initially, highlights the network’s continuous growth both in terms of density and the number of relationships. Network density, a measure of how interconnected the nodes are within a network, saw a significant increase from 0.4563 in 2012 to 0.6793 in 2021, marking an approximate 33% growth. This increase is indicative of the strengthening relationships and collaborations among provinces in the realm of GIIM.
Figure 7. Network density and association from 2012 to 2021.
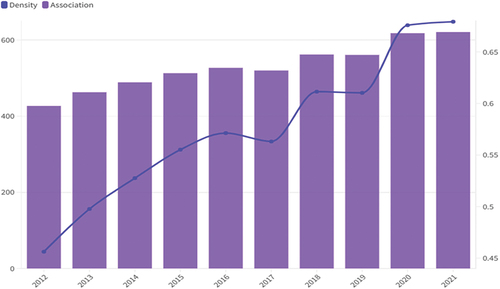
Simultaneously, the number of correlations within the network rose from 427 in 2012 to 621 in 2021. While this number is still short of the maximum potential of 870 relationships – calculated based on the total possible connections in the network – the current high network density suggests that the development of GIIM across various provinces is becoming more integrated and cohesive.
The indicators in collectively demonstrate not only the quantitative growth of the network but also its qualitative development. The expansion in network density and relationships signifies a maturing landscape of GIIM in China, reflecting a nationwide shift towards more collaborative and interconnected approaches in this field. This trend is a positive indicator of the progress in the application and integration of green technologies across the provinces, marking a significant step towards achieving sustainable development goals.
The paper further calculates key metrics such as the degree of correlation, network hierarchy, and network efficiency within the GIIM spatial correlation network. As detailed in , the network correlation degree was consistently measured at 1 throughout the study period. This consistency suggests a relatively stable network structure, despite minor fluctuations in the number of network relationships. Such stability indicates good network accessibility among the provinces, characterized by strong spatial correlations and spillover effects, implying that most provinces have established stable cooperative relationships in the realm of GIIM.
Table 3. Connectedness,hierarchy and efficiency.
Additionally, the network hierarchy degree, measured at 0, reveals that the GIIM spatial correlation network operates on a relatively flat hierarchical scale at the inter-provincial level. This absence of a strict hierarchical order and connectivity barriers underlines a significant synergistic effect among the provinces, facilitating collaborative and egalitarian interactions in green innovation.
The overall trend of declining network efficiency, with distinct phase characteristics, indicates that the channels for GIIM spatial spillover have expanded during the study period. This expansion has ostensibly enhanced the overall stability of the network, suggesting a maturing and more interconnected GIIM landscape.
4.4. Networked small-world features
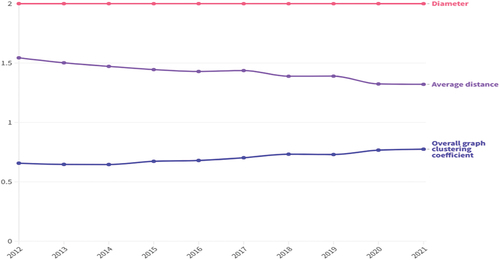
In this study, we constructed a random network that matches the scale and density of real-world correlation networks annually. We characterized the connectivity between network nodes using metrics such as network clustering coefficient, average distance, and network diameter. These analyses are illustrated in .
From 2012 to 2021, the network’s clustering coefficient remained relatively stable, fluctuating between 0.6 and 0.8. This indicates a strong degree of connectivity among nodes and their adjacent nodes. The spatial correlation network of the GIIM maintained a balanced state of connectivity, aligning with the trends observed in the GIIM spatial correlation networks depicted in .
The average path length varied between 1.544 and 1.321, showing a yearly decreasing trend. This decrease suggests that provinces have been leveraging the network structure for more effective collaboration in GIIM, thereby reducing network redundancy and enhancing overall efficiency.
Remarkably, the network diameter consistently remained at 2, significantly lower than the total number of 30 members in the overall spatial network. This consistency highlights the network’s efficient structure, where the distance between any two nodes is relatively small.
Overall, the GIIM spatial correlation network exhibits characteristics of a “small-world” phenomenon, indicative of excellent network connectivity. This phenomenon allows for the rapid dissemination of a province’s level of GIIM to others, thereby improving the spatial correlation network status of provinces with lower GIIM levels. These findings underscore the vital role of cross-provincial and cross-regional collaboration in fostering the development and dissemination of GIIM, highlighting the interconnected nature of green innovation efforts across China.
Figure 8. Evolution of small-world characteristics of spatially linked networks.
4.5. Ego-network characteristics and dynamic evolution trend
4.5.1. Centrality analysis
To elucidate the positions and functions of each province within the GIIM spatial association network, this study quantitatively assesses three pivotal network metrics : degree centrality, betweenness centrality, and closeness centrality. The years 2012, 2016, and 2021 were specifically chosen for this dynamic analysis, with illustrating the distribution of individual network characteristics related to spatial associations across the provinces.
In terms of degree centrality, regions such as Beijing, Shanghai, Jiangsu, and Zhejiang consistently emerged as central players in the GIIM network throughout the research period. The stable yet notable increase in both in-degree and out-degree for various provinces, particularly in 2021, suggests an intensifying spillover effect. Notably, Gansu’s higher in-degree compared to its out-degree each year implies it benefits more from the network than it contributes, while Beijing and Tianjin, with high in-degrees, demonstrate a strong capacity to absorb resources and promote local GIIM development through a “siphoning effect”.
The average betweenness centrality value decreased over the years, indicating a gradual reduction in bipolarization within the GIIM network among provinces. This trend is beneficial for enhancing cooperative efforts and communication in GIIM development. Jiangsu, Beijing, and Shanghai, consistently ranking high in betweenness centrality, play crucial roles due to their strategic positions in inland communication channels.
Closeness centrality rankings closely align with degree centrality, suggesting that provinces with significant positions and close ties to others also influence the GIIM of neighboring provinces. The noticeable upward trend in closeness centrality, with more provinces exceeding the average value each year, indicates an enhanced ability to connect through shorter paths and access innovation resources effectively.
Figure 9. Centrality analysis in 2012.
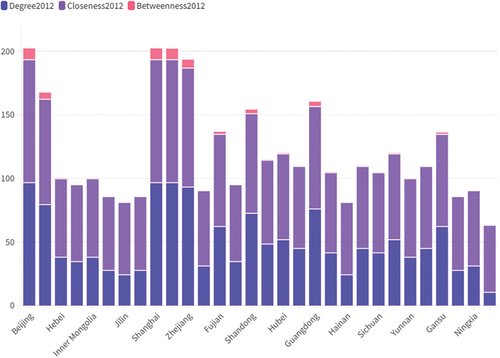
Figure 10. Centrality analysis in 2016.
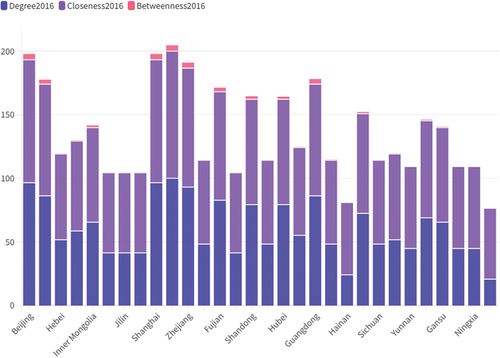
Figure 11. Centrality analysis in 2021.
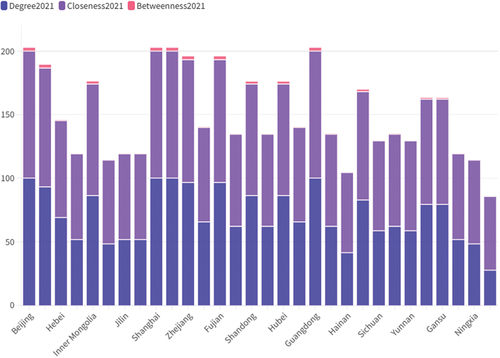
By combining these three centrality indices to examine green innovation in the manufacturing sectors of various provinces, an increasingly strong investment bias is evident. Regions with advanced manufacturing, such as Shanghai, Beijing, and Jiangsu, continue to exert strong control over GIIM-related innovation resources. However, the intensification of spatial network connections also brings geographically more remote areas into prominence within these networks.
4.5.2. Structural hole analysis
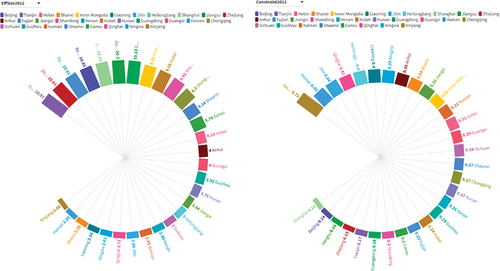
Applying the theory of structural holes to the GIIM network, this study measures the positions of structural holes within the network, using two indicators: Effective Size and Constraint. “Effective Size” gauges the extent of a province’s influence on the overall GIIM network, while “Constraint” assesses the likelihood of a province occupying a structural hole position (Y. Chen, Citation2015).
In a representation (), the study examines advantageous and disadvantageous nodes in the context of green innovation in 2021. It reveals that regions like Beijing, Zhejiang, and Fujian, with large Effective Sizes and low Constraints, are positioned advantageously in structural holes. This positioning implies a greater ability to access diverse information and exert control within the network.
Conversely, regions such as Xinjiang, Hainan, and Jilin, characterized by small Effective Sizes and high Constraints, demonstrate weaker external resource capabilities and a high dependency on provinces occupying advantageous structural hole positions. These findings indicate a disparity in the capacity to leverage network benefits for green innovation.
The study suggests that regions in advantageous node positions should capitalize on their network benefits in green manufacturing innovation. By enhancing information exchange with regions in disadvantaged node positions, they can facilitate a more balanced and inclusive regional development. This strategy is crucial for ensuring that all provinces, regardless of their current network position, can contribute to and benefit from advancements in green technology innovation.
Figure 12. Structural hole indicator of China’s GIIM in 2021.
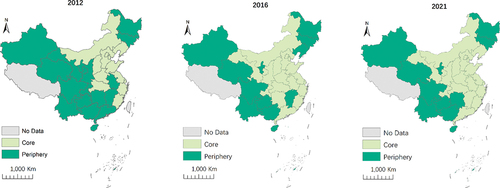
4.6. Evolution of core-periphery structure
Utilizing core-periphery analysis, it is evident that the spatial correlation network of China’s GIIM is characterized by an expanding core and a diminishing periphery, as illustrated in . From 2012 to 2021, the number of provinces in the core region steadily increased, from 17 in 2012 to 19 by 2021. This increase reflects a significant trend of gradual extension from the south-eastern coastal provinces to more peripheral areas, marking a shift from a single-core agglomeration to a more diverse, multi-core expansion.
The evolving distribution of the core region signifies not only the geographic spread of green innovation but also the increasing integration and collaboration among provinces. This expansion demonstrates the growing influence and reach of green innovation initiatives, particularly from the developed provinces along the eastern coast.
Concurrently, the diminishing periphery illustrates how previously peripheral provinces are becoming increasingly integrated into the network. This integration is driven by enhanced economic development and inter-provincial connections, leading to tighter ties within the density matrix. As a result, peripheral provinces are gradually becoming active participants in the GIIM network, contributing to and benefiting from green innovation initiatives.
The developed provinces along the eastern coast play a pivotal role in this process. Their expansion in diffusion and radiation scope significantly promotes the improvement of the GIIM level in surrounding provinces. This trend is indicative of a broader shift towards a more inclusive and interconnected approach to GIIM, where provinces show increasing initiative and capability in contributing to the network structure.
Overall, while the spatial correlation network of China’s GIIM continues to exhibit a core-periphery structure, the dynamics within this structure are rapidly evolving. The increasing number of core areas and the integration of peripheral regions underscore a national trend towards more integrated and collaborative green innovation efforts.
Figure 13. Core-edge structure of GIIM spatial associations, 2012, 2016 and 2021.
4.7. Blocks analysis
The analysis of China’s GIIM, considering both overall and individual characteristics, reveals significant spatial differentiation. To further depict the inter-regional interactions and dynamic changes, this study selects data from 2012, 2016, and 2021. An iterative algorithm, which considers segmentation depth and concentration standards, categorizes 30 regions into four major blocks. The results show R2 values of 0.531 (2012), 0.557 (2016), and 0.519 (2021), indicating a generally good fit for each year. illustrates the interactive relationships between these four major blocks of the GIIM spatial correlation network in 2021.
Figure 14. Correlation among the four GIIM blocks in 2021.
The block model analysis results, as listed in , reveal that when spatial correlations are considered, inter-block relationships are significantly more prevalent than intra-block associations. This indicates notable spatial correlations and spillover effects between GIIM blocks. By comprehensively considering the number of receiving blocks, spillover relationship counts, internal relationship counts, and the proportion of internal relationships, the attributes of the blocks for 2012, 2016, and 2021 were categorized. A closer examination of their dynamic changes reveals:
Block I: Weak internal spillover effects, significant spillover to others, and reception of spillover from other blocks, playing an effective “bridge” role in the spatial correlation network. Throughout the study period, it was consistently categorized as the “Broker” block.
Block II: The number of spillover relationships exceeds those received, making it a “Net Spillover” block throughout the study period. This block not only meets its own development needs but also facilitates the development of other block members through element spillover.
Blocks III and IV: These blocks experienced role reversals during the study period. In 2012 and 2016, Block III, with a roughly equal number of received and spillover relationships and a relatively high proportion of internal relationships, was categorized as a “Bidirectional Spillover” block, playing a “Bidirectional Guide” role. In 2021, it became a “Net Inflow” block, whereas Block IV transitioned from a “Net Inflow”block in 2012 and 2016 to a “Bidirectional Spillover” block in 2021.
Table 4. Classification of GIBM space-related network blocks in 2012.
Table 5. Classification of GIBM space-related network blocks in 2016.
Table 6. Classification of GIBM space-related network blocks in 2021.
Not only did the attributes of the blocks change, but also the composition of provinces within each block shifted notably. For instance, the number of provinces in Block I increased, with Beijing, Tianjin, Jiangsu, Zhejiang, Fujian, and Shanghai being part of the “Broker””block by 2021, indicating an increasing number of provinces playing a“bridge”and“intermediary”role. The variations in the provincial composition of the other blocks across different years highlight the complexity and dynamism of the GIIM spatial correlation network.
4.8. Network structure effect analysis
To reveal the structural characteristics of the GIIM spatial correlation network, this study empirically examines the impact of network structure on regional differences and levels of GIIM from two aspects: the overall network and individual network structures. From the perspective of the overall network structure, the variation coefficient of GIIM levels across provinces is used to measure the inter-provincial differences in GIIM levels. OLS regression is conducted using network density and network efficiency, with the dependent variables undergoing logarithmic transformation. Additionally, from the perspective of individual network structure, besides the degree centrality and betweenness centrality used in the individual characteristics analysis, eigenvector centrality is also introduced as an explanatory variable. Balanced panel data regression analysis is performed with GIIM as the dependent variable. Logarithmic transformation of the explanatory variables is carried out to avoid certain multicollinearity issues.
4.8.1. Regression results for the whole network structure
reveals that the regression coefficients for network density and network efficiency on the regional differences of GIIM are 2.420 and −2.357, respectively, and both are significant at the 5% level. This indicates that an increase in network density and a decrease in network efficiency significantly affect the regional disparities of GIIM, leading to a more balanced spatial distribution of GIIM levels. The potential reasons are as follows: Firstly, an increase in network density enhances the cohesion among provinces in terms of green innovation orientation, thus avoiding spatial differences and polarization trends in GIIM. Secondly, a decrease in network efficiency implies an increase in critical nodes throughout the network, leading to higher levels of GIIM spillover among provinces. This enhances the overall stability of the network, thereby reducing the relative differences in GIIM.
Table 7. OLS regression results of the whole network structure effect.
4.8.2. Regression results for ego-network structure
Based on the characteristics of the data, estimation was performed using panel models, with reference to the results of the Hausman test to select an appropriate random effects model. The regression results are shown in . The regression coefficients for degree centrality, betweenness centrality, and eigenvector centrality are 0.109, 0.266, and 0.130, respectively, and are positive at the 5% and 10% significance levels. This indicates that the enhancement of centrality in each province has a significant positive impact on the GIIM level. The possible reasons are as follows: First, the higher the degree centrality, the more direct relationships a province has with other provinces, resulting in a higher degree of local association and enabling provinces to acquire relevant resources more efficiently, thereby improving the GIIM level. Secondly, provinces with higher betweenness centrality can effectively control the associative effects with other provinces, thus guiding the rational allocation of resource elements and enhancing the GIIM level in the network structure region. Finally, the higher the eigenvector centrality, the closer and more influential the core inter-provincial relationships are, promoting inter-provincial communication and cooperation, and steadily improving the GIIM level.
Table 8. Regression results of the ego-network structure effect.
5. QAP analysis of drivers
5.1. Variable design
The formation and evolution of the GIIM spatial correlation network are attributed to the differential resource endowments of network nodes and their collective actions. Research, notably by K. Gao and Yuan (Citation2022), has revealed that the spatial heterogeneity and regional variations in China’s green innovation are linked to geographic spatial factors. The proximity in geographical distance facilitates easier factor mobility and mutual sharing of outcomes. Extensive research has demonstrated the impact of governmental environmental regulation on green innovation in manufacturing. Manufacturing enterprises are required to allocate substantial resources to comply with mandatory environmental policies, inevitably escalating production costs and imposing a significant burden on green innovation (Y. Zhang et al., Citation2018), thereby influencing the direction of green innovation initiatives. However, with the increasing intensity of mandatory environmental policies, manufacturing firms are compelled to adopt more environmentally sustainable technologies. This shift enhances production efficiency and resource utilization through GIIM, consequently reducing production costs (J. Gao et al., Citation2023). This complex interplay accentuates the profound influence of the level of digital transformation and environmental regulatory intensity on the dynamics between sectors.
Additionally, based on the block model and core-periphery research findings, there are distinct regional differentiation characteristics within and between blocks. Recent studies, such as those by Deng et al. (Citation2022), have also highlighted the impact of digital transformation in manufacturing on green innovation. Therefore, in this study, we aim to concurrently consider the effects of these factors on interprovincial interactions. This approach enables a more comprehensive understanding of the correlations between provinces and the intricate interactions among different blocks. Ultimately, our findings will offer valuable insights for the formulation and implementation of relevant policies. Thus, the model we have developed for this study adopts a holistic approach, integrating the multifaceted effects of spatial-geographic distance (D), environmental regulation intensity (E), and the level of digital transformation (T). The model is formulated as follows:
Where, denotes the GIIM spatial correlation network in the
th year;
denotes the spatial geographic distances between provinces based on latitude and longitude;
is the matrix representing the differences in environmental regulation intensity, measured by the ratio of completed investments in industrial pollution treatment to the industrial added value;
stands for the matrix of digital transformation levels. The measurement of these variables is as follows: Initially, Python web scraping technology was employed to collect annual report data of manufacturing companies listed from 2012 to 2021. This study draws from classic literature in constructing a corporate digital terminology dictionary, starting with five major “ABCD”technologies, namely Artificial Intelligence, Blockchain, Cloud Computing, and Big Data. The construction of the corporate digital transformation lexicon originated from the application side of the aforementioned digital technologies (Wu et al., Citation2021). By combining text mining and word frequency counting, the level of digital transformation of manufacturing companies listed from 2012 to 2021 was quantitatively analysed using the following formula:
The eq.13 and 14 mentioned above calculates the sum of frequencies of digital keywords in the annual report of firm for year
. It acknowledges that the frequency of keywords in a firm’s annual report prior to a certain time might be negligible or zero. To address this, an inverse hyperbolic sine transformation is applied, effectively smoothing out high-frequency fluctuations in speed. This transformation is particularly effective for smaller values, offering a proportional change and well-defined numerical properties. As a result, it generates a digital transformation index for each enterprise, where a higher index value indicates a more advanced level of digitalization.
In line with this data, the study adopts a regional clustering approach defined as stock code-company abbreviation-province number-province. This method involves matching and clustering the digital transformation indicators of enterprises across 30 local administrative units in China from 2012 to 2021, thereby calculating the regional level of digital transformation. Subsequently, the gravity model is employed to compute the gravitational value of the regional digital transformation level. This approach mirrors the methodology used in the previous section for constructing evidence of the spatial correlation strength of the GIIM.
5.2. Correlation analysis
This study takes the release date of “Made in China 2025” as a reference point and selects data from three years: 2012, 2016, and 2021. Utilizing Ucinet for analysis and after randomly permuting 5,000 data points, we obtain the GIIM spatial correlation matrix along with the correlation coefficients of various influencing factors, as shown in .
Table 9. Correlation analysis.
The results from the QAP correlation analysis reveal a significant relationship between geographical distance, the intensity of environmental regulations, and the level of digital transformation concerning the spatial correlation network of the GIIM. For the years 2012, 2016, and 2021, the spatial distance coefficient exhibits a negative correlation. This suggests that reduced geographic distances strengthen the spatial correlation within the GIIM network. Additionally, the correlation coefficients for the differences in environmental regulation intensity across these years are uniformly negative. This finding underscores the connection between spatial correlation and regional variations in the development of environmental regulatory intensity. Regions with minor disparities in environmental regulation are more likely to engage in mutual learning, fostering the establishment of spatial connections among different regional GIIMs. Further analysis of digital transformation levels in 2012, 2016, and 2021 indicates that regions with advanced digital transformation exhibit a more substantial expansion and spillover effect in inter-provincial linkages within the GIIM network. This finding extends scholar’s study of the spatial effects of green innovation by revealing the drivers of the spatial correlates of input-biased green innovation (J. Gao et al., Citation2023; Liang et al., Citation2022; P. Zhao et al., Citation2023). Furthermore, by delving into the interplay between digital transformation and the intensity of environmental regulation, we can gain a deeper understanding of how these factors collectively shape the evolutionary trends of the GIIM spatial correlation network. Particularly in the context of rapid digital development, the coordination and integration of environmental regulations across different regions may play a more significant role in promoting inter-regional linkages and innovative upgrades within the GIIM framework.
5.3. Regression analysis
In , the results of the QAP regression analysis of the model are presented. The adjusted R2 values for the three years under consideration are 0.571, 0.484, and 0.485 respectively, all surpassing the 1% significance test. This indicates that factors such as spatial distance, environmental regulation intensity, and digital transformation are instrumental in explaining the shifts in spatial association.
Table 10. QAP regression analysis.
Observing the regression coefficients of the spatial geographic distance matrix, we find the coefficients to be −0.0089, −0.0129, and −0.0132, all significantly negative at the 1% level. This indicates that the closer the inter-provincial geographical distance, the stronger the spatial correlation of the GIIM. The regression coefficients of the environmental regulation intensity difference matrix are −0.0002, −3.5553, and −0.0003, passing the significance tests at 1%, 5%, and 1% levels, respectively. Interestingly, the coefficient for 2016 is exceptionally smaller compared to the other two years, suggesting that selecting 2016 as a midpoint for dynamic analysis in this study holds significant reference value. The regression coefficients for the digital transformation level correlation matrix are 0.7074, 0.6320, and 0.5506, all significant at the 1% level. This implies that the level of digital transformation in provinces has a significant positive impact on the GIIM spatial correlation network. A possible explanation is that leveraging the advantages of digital technology enables manufacturing enterprises to achieve strategic goals of resource conservation and environmental protection, fostering a positive green image at a higher level of green innovation (Deng et al., Citation2022), thereby influencing the development level of GIIM.
6. Discussion and implication
6.1. Discussion
This research conducts a profound exploration of the spatial correlation characteristics and driving factors of Green Innovation Bias in China’s manufacturing sector across various provinces. Utilizing the decomposition of the Malmquist-Luenberger index, we assess the green innovation and factor substitution biases in 30 Chinese provinces from 2012 to 2021. Additionally, we employ a refined gravity model to construct a spatial correlation network for input-biased green innovation in manufacturing.
Our analysis reveals a consistent enhancement in the overall of GIIM across China from 2012 to 2021. The eastern and central regions demonstrate superior green technological innovation compared to the western region, indicating a distinct input bias. On a provincial scale, a progressive equalization in GIIM is observed, driven by robust spatial correlations.
Social network analysis highlights the nascent stage of China’s interconnected provincial GIIM network, marked by significant disparities and fluctuating network hierarchy and efficiency. This suggests that China’s GIIM is still evolving, with various influencing factors requiring management and control. Furthermore, our study identifies core-edge structural characteristics in China’s GIIM spatial network, with a concentration in provinces like Beijing, Shanghai, Guangdong, and Jiangsu. Conversely, less developed provinces like Xinjiang, Ningxia, Tibet, and Hainan occupy peripheral positions in the network.
Our findings indicate that geographical proximity, regional variations in environmental regulation, and the digital transformation of manufacturing significantly influence the spatial correlation of GIIM. These insights inform potential cross-regional industrial collaborative governance policies and offer empirical evidence for environmental governance strategies.
Despite these contributions, our study is limited by the absence of city-level data, which could provide more nuanced insights into the green transformation of the industry. Additionally, while the study identifies directional factors affecting GIIM’s spatial correlation at the provincial level, it does not explore the underlying mechanisms. Future research should address these mechanisms in more detail. Lastly, our methodology offers a robust approach for studying GIOM, which will be the focus of our subsequent research.
6.2. Implication
The progression of green innovation within the manufacturing sector is a multifaceted and extended process. In the context of China, the trajectory towards such innovation is significantly influenced by government strategic policies. Explicit and well-defined policy directives are imperative for the adoption of technological advancements and the transformation of industrial paradigms throughout the sector. Furthermore, it is critical to thoroughly evaluate the distinct characteristics and challenges inherent in regional manufacturing landscapes.
There exists an immediate imperative to foster environmental regulatory policies that incentivize and practically implement digital manufacturing methodologies. Green innovation in manufacturing ought to transcend the narrow focus on the development of energy-efficient technologies. It should encompass diverse approaches, including the innovation and holistic application of industrial models. Presently, digitally-enhanced intelligent green supply chains are pivotal in establishing a comprehensive green innovation framework. Green technological innovation serves as both an essential prerequisite and a catalyst for regional green development strategies. Consequently, emergent paradigms such as “green + high-end manufacturing” and “green + intelligent manufacturing” are gaining traction, potentially expediting the transition towards high-caliber development in the manufacturing domain.
Furthermore, based on research findings, it becomes evident that the implementation of a GIBM regional collaborative innovation and development strategy is essential. The state should ensure that the GIIM index in the central and eastern regions of China maintains a positive trajectory. This includes leveraging the relational and spillover effects of structural holes to support regions with lower levels of innovation. Such support could manifest in forms such as talent recruitment, technical assistance, and a range of preferential policies. The crux of this strategy lies in enhancing innovation spillovers and diffusion through differentiated regulatory intensity strategies and digital technology transfers, continually augmenting the green innovation synergies across the entire industry and supply chains. It is crucial to encourage close cooperation between provinces and regions, constantly improving the density of the spatial network.
Promoting the cross-regional flow of green innovation elements and harnessing the leading role of regions with higher GIIM levels in driving others is also vital. This can be achieved through project demonstrations, leading benchmark enterprises, and the promotion of exemplary cases. The ultimate goal is to narrow the regional disparities, enhancing overall innovation capabilities and regional collaborative development capacities.
Acknowledgments
The authors acknowledge the useful comments from the Editor and anonymous reviewers. Certainly, all remaining errors are our own.
Disclosure statement
No potential conflict of interest was reported by the author(s).
Additional information
Funding
Notes on contributors
Yang Liu
Yang Liu, Kunming University, Associate Professor Research Focus: Cross-border Digital Economy and Sustainable Development.
Jing Cheng
Jing Cheng, Yunnan Agricultural University, Associate Professor Research Focus: Green Innovation and Development.
Jingjing Dai
Jingjing Dai, Kunming University, Master’s Research Student Research Focus: Digital Trade and Innovative Development.
Notes
1 The year 2012 was chosen as the starting point for the study because it was in 2012 that the Chinese government first raised the meaning of green manufacturing in a policy document.
References
- Audretsch, D. B., Belitski, M., & Guerrero, M. (2022). The dynamic contribution of innovation ecosystems to schumpeterian firms: A multi-level analysis. Journal of Business Research, 144, 975–31. https://doi.org/10.1016/j.jbusres.2022.02.037
- Baloch, M. A., Ozturk, I., Bekun, F. V., & Khan, D. (2021). Modeling the dynamic linkage between financial development, energy innovation, and environmental quality: Does globalization matter? Business Strategy and the Environment, 30(1), 176–184. https://doi.org/10.1002/bse.2615
- Basile, R., Capello, R., & Caragliu, A. (2012). Technological interdependence and regional growth in Europe: Proximity and synergy in knowledge spillovers. Papers in Regional Science, 91(4), 697–722. https://doi.org/10.1111/j.1435-5957.2012.00438.x
- Borgatti, S. P., & Foster, P. C. (2003). The network paradigm in organizational research: A review and typology. Journal of Management, 29(6), 991–1013. https://doi.org/10.1016/S0149-2063(03)00087-4
- Cassi, L., Morrison, A., & Terwai, A. L. J. (2012). The evolution of trade and scientific collaboration networks in the global wine sector: A longitudinal study using network analysis. Economic Geography, 88(3), 311–334. https://doi.org/10.1111/j.1944-8287.2012.01154.x
- Castells, M., & Cardoso, G. (2006). The network society: From knowledge to policy. Johns Hopkins Center for Transatlantic Relations.
- Chen, Y. (2015). Director’s ‘structural hole’ position and firm’s policy efficiency(in Chinese). Accounting Research, 01, 48–55+97.
- Chen, Z., Sarkar, A., Rahman, A., Li, X., & Xia, X. (2022). Exploring the drivers of green agricultural development (GAD) in China: A spatial association network structure approaches. Land Use Policy, 112, 105827. https://doi.org/10.1016/j.landusepol.2021.105827
- Chen, W., Wu, F., Geng, W., & Yu, G. (2017). Carbon emissions in China’s industrial sectors. Resources, Conservation and Recycling, 117, 264–273. https://doi.org/10.1016/j.resconrec.2016.10.008
- Chen, P.-C., & Yu, M.-M. (2014). Total factor productivity growth and directions of technical change bias: Evidence from 99 OECD and non-OECD countries. Annals of Operations Research, 214(1), 143–165. https://doi.org/10.1007/s10479-012-1087-4
- CHONG, Z., & QIN, C. (2017). The trade network structure of “one belt one road” and its influence factors: A study based on analytic network process. International Economics and Trade Research, 05, 16–28. https://doi.org/10.13687/j.cnki.gjjmts.2017.05.002
- David, P. A., & van de Klundert, T. (1965). Biased efficiency growth and capital-labor substitution in the U.S., 1899-1960. The American Economic Review, 55(3), 357–394.
- Deng, H., Bai, G., Shen, Z., & Xia, L. (2022). Digital economy and its spatial effect on green productivity gains in manufacturing: Evidence from China. Journal of Cleaner Production, 378, 134539. https://doi.org/10.1016/j.jclepro.2022.134539
- Derudder, B., & Taylor, P. J. (2021). The GaWC perspective on global-scale urban networks. In Handbook of cities and networks (pp. 601–617). Edward Elgar Publishing. https://www.elgaronline.com/edcollchap/edcoll/9781788114707/9781788114707.00037.xml
- Doreian, P., & Conti, N. (2012). Social context, spatial structure and social network structure. Social Networks, 34(1), 32–46. https://doi.org/10.1016/j.socnet.2010.09.002
- Egilmez, G., Kucukvar, M., & Tatari, O. (2013). Sustainability assessment of U.S. manufacturing sectors: An economic input output-based frontier approach. Journal of Cleaner Production, 53, 91–102. https://doi.org/10.1016/j.jclepro.2013.03.037
- Färe, R., Grifell‐Tatjé, E., Grosskopf, S., & Knox Lovell, C. A. (1997). Biased technical change and the Malmquist productivity index. The Scandinavian Journal of Economics, 99(1), 119–127. https://doi.org/10.1111/1467-9442.00051
- Feldman, M. (2016). Geography of innovation. https://doi.org/10.1057/978-1-349-94848-2_537-1
- Feng, Z., Cai, H., Chen, Z., & Zhou, W. (2022). Influence of an interurban innovation network on the innovation capacity of China: A multiplex network perspective. Technological Forecasting and Social Change, 180, 121651. https://doi.org/10.1016/j.techfore.2022.121651
- Fritze, M. P., Urmetze, F., Khan, G. F., Sarstedt, M., Neely, A., & Schfers, T. (2018). From goods to services consumption: A social network analysis on sharing economy and servitization research. Journal of Service Management Research, 2(3), 3–16. https://doi.org/10.15358/2511-8676-2018-3-3
- Gai, M., Yang, Q., He, Y., & 1. Institute of Marine Sustainable Development, Liaoning Normal University, Dalian 116029, China 2. University Collaborative Innovation Center of Marine Economy High-Quality Development of Liaoning Province, Dalian 116029, China. (2022). Spatiotemporal changes and influencing factors of agricultural green development level in main grain-producing areas in Northeast China. 资源科学, 44(5), 927–942.
- Gao, J., Feng, Q., Guan, T., & Zhang, W. (2023). Unlocking paths for transforming green technological innovation in manufacturing industries. Journal of Innovation & Knowledge, 8(3), 100394. https://doi.org/10.1016/j.jik.2023.100394
- Gao, K., & Yuan, Y. (2022). Spatiotemporal pattern assessment of China’s industrial green productivity and its spatial drivers: Evidence from city-level data over 2000–2017. Applied Energy, 307, 118248. https://doi.org/10.1016/j.apenergy.2021.118248
- Guan, J., Zhang, J., & Yan, Y. (2015). The impact of multilevel networks on innovation. Research Policy, 44(3), 545–559. https://doi.org/10.1016/j.respol.2014.12.007
- Herring, H., & Roy, R. (2007). Technological innovation, energy efficient design and the rebound effect. Technovation, 27(4), 194–203. https://doi.org/10.1016/j.technovation.2006.11.004
- He, G., & Wang, Z. (2015). Energy biased technology progress and green growth transformation——an empirical analysis based on 33 industries of China. China’s Industrial Economy, 02, 50–62. https://doi.org/10.19581/j.cnki.ciejournal.2015.02.006
- Huggins, R., Johnston, A., Munday, M., & Xu, C. (2023). Competition, open innovation, and growth challenges in the semiconductor industry: The case of Europe’s clusters. Science and Public Policy, 50(3), 531–547. https://doi.org/10.1093/scipol/scad005
- Kaneko, S., & Managi, S. (2004). Environmental productivity in China. Economics Bulletin, 17(2), 1–10.
- Karanfil, F., & Yeddir-Tamsamani, Y. (2010). Is technological change biased toward energy? A multi-sectoral analysis for the French economy. Energy Policy, 38(4), 1842–1850. https://doi.org/10.1016/j.enpol.2009.11.061
- Klump, R., McAdam, P., & Willman, A. (2012). The normalized ces production function: Theory and empirics. Journal of Economic Surveys, 26(5), 769–799. https://doi.org/10.1111/j.1467-6419.2012.00730.x
- Krackardt, D. (1987). QAP partialling as a test of spuriousness. Social Networks, 9(2), 171–186. https://doi.org/10.1016/0378-8733(87)90012-8
- Liang, Z., Chen, J., Jiang, D., & Sun, Y. (2022). Assessment of the spatial association network of green innovation: Role of energy resources in green recovery. Resources Policy, 79, 103072. https://doi.org/10.1016/j.resourpol.2022.103072
- Liu, S., Hou, P., Gao, Y., & Tan, Y. (2022). Innovation and green total factor productivity in China: A linear and nonlinear investigation. Environmental Science and Pollution Research, 29(9), 12810–12831. https://doi.org/10.1007/s11356-020-11436-1
- Malecki, P. O., & Edward, J. (2008). The evolution of technologies in time and space: From national and regional to spatial innovation systems. In M. Ron (Ed.), Economy (1st ed., pp. 401–430). Routledge.
- Min, S., Kim, J., & Sawng, Y.-W. (2020). The effect of innovation network size and public R&D investment on regional innovation efficiency. Technological Forecasting and Social Change, 155, 119998. https://doi.org/10.1016/j.techfore.2020.119998
- Peng, J., Xiao, J., Wen, L., & Zhang, L. (2019). Energy industry investment influences total factor productivity of energy exploitation: A biased technical change analysis. Journal of Cleaner Production, 237, 117847. https://doi.org/10.1016/j.jclepro.2019.117847
- Qin, L., Kirikkaleli, D., Hou, Y., Miao, X., & Tufail, M. (2021). Carbon neutrality target for G7 economies: Examining the role of environmental policy, green innovation and composite risk index. Journal of Environmental Management, 295, 113119. https://doi.org/10.1016/j.jenvman.2021.113119
- Radziwon, A., Rong, K., Lin, Y., Yu, J., & Zhang, Y. (2022). Exploring regional innovation ecosystems: An empirical study in China. In B. Catherine, B.-H. Thierry, & C. Patrick (Eds.), Innovation policies and practices within innovation ecosystems (pp. 10–34). Routledge. https://doi.org/10.4324/9781003279464 .
- Rogers, M. (2004). Networks, firm size and innovation. Small Business Economics, 22(2), 141–153. https://doi.org/10.1023/B:SBEJ.0000014451.99047.69
- Sims, C. A., Lovell, M. C., & Solow, R. M. (1974). Output and labor input in manufacturing. Brookings Papers on Economic Activity, 1974(3), 695–735. https://doi.org/10.2307/2534251
- SUN, Z., FAN, J., SUN, Y., & H, L. I. U. (2022). Structural characteristics and influencing factors of spatial correlation network of green science and technology innovation efficiency in China. Economic Geography, 03, 33–43. https://doi.org/10.15957/j.cnki.jjdl.2022.03.004
- Wang, J., Wu, H., & Chen, Y. (2020). Made in China 2025 and manufacturing strategy decisions with reverse QFD. International Journal of Production Economics, 224, 107539. https://doi.org/10.1016/j.ijpe.2019.107539
- Weber, W. L., & Domazlicky, B. R. (1999). Total factor productivity growth in manufacturing: A regional approach using linear programming. Regional Science and Urban Economics, 29(1), 105–122. https://doi.org/10.1016/S0166-0462(98)00013-1
- Wübbeke, J., Meissner, M., Zenglein, M. J., Ives, J., & Conrad, B. (2016). Made in china 2025. Mercator Institute for China Studies Papers on China, 2(74), 4.
- Wu, F., Hu, H., Lin, H., & Ren, X. (2021). Enterprise digital transformation and capital market performance: Empirical evidence from stock liquidity (in Chinese). Journal of Management World, 2021(7), 130–144+10.
- Xuhui, L. I., & Yitao, T. A. O. (2023). Measurement, regional differences, and causes of China’ s green and low?carbon innovation development under the “dual carbon” goals. China Population, Resources & Environment, 33(1), 124–136.
- Yang, X., Li, X., & Zhong, C. (2019). Study on the evolution trend and influencing factors of China’s industrial directed technical change. The Journal of Quantitative & Technical Economics, 04, 101–119. https://doi.org/10.13653/j.cnki.jqte.2019.04.006
- Yuan, B., & Xiang, Q. (2018). Environmental regulation, industrial innovation and green development of Chinese manufacturing: Based on an extended CDM model. JOURNAL of CLEANER PRODUCTION, 176, 895–908. https://doi.org/10.1016/j.jclepro.2017.12.034
- Zenglein, M. J., & Holzmann, A. (2019). In W. Claudia (Ed.), Evolving made in China 2025 (Vol. 8, pp. 78). Germany: MERICS Papers on China.
- Zhang, Y., Wang, J., Xue, Y., & Yang, J. (2018). Impact of environmental regulations on green technological innovative behavior: An empirical study in China. Journal of Cleaner Production, 188, 763–773. https://doi.org/10.1016/j.jclepro.2018.04.013
- Zhang, B., Yu, L., & Sun, C. (2022). How does urban environmental legislation guide the green transition of enterprises? Based on the perspective of enterprises’ green total factor productivity. Energy Economics, 110, 106032. https://doi.org/10.1016/j.eneco.2022.106032
- Zhao, N., Liu, X., Pan, C., & Wang, C. (2021). The performance of green innovation: From an efficiency perspective. Socio-Economic Planning Sciences, 78, 101062. https://doi.org/10.1016/j.seps.2021.101062
- Zhao, P., Lu, Z., Kou, J., & Du, J. (2023). Regional differences and convergence of green innovation efficiency in China. Journal of Environmental Management, 325, 116618. https://doi.org/10.1016/j.jenvman.2022.116618
- Zheng, W.-L., Wang, J.-W., Jiang, A.-D., Rehman Khan, S. A., Yang, X.-Q., Zhang, X., & Zhang, Z.-Y. (2021). Study on environmental performance evaluation of different linkage development types of the logistics and manufacturing industries considering the unexpected output. Journal of the Air & Waste Management Association, 71(8), 1025–1038. https://doi.org/10.1080/10962247.2021.1920516
- Zhou, X., Yu, Y., Yang, F., & Shi, Q. (2021). Spatial-temporal heterogeneity of green innovation in China. Journal of Cleaner Production, 282, 124464. https://doi.org/10.1016/j.jclepro.2020.124464
- Кузнецов, С., Турдаков, Д., Назар, Б., & Валерий, А. (2014). Social network analysis: Methods and applications. https://xueshu.baidu.com/usercenter/paper/show?paperid=32e66bde64fbf74278db7569b85702dc&site=xueshu_se