
ABSTRACT
Recent experiments showed that the valence of user comments (i.e., social information) presented alongside online videos can alter viewers’ enjoyment of videos. However, it is unclear how much attention video viewers pay to social information and whether the effects found in previous studies occur if participants are not forced to view the social information. Therefore, this study investigated how the valence of social information presented alongside online videos affects viewers’ enjoyment when viewers are free to determine whether and how much attention they pay to social information. Using an eye tracker, we found that most video viewers pay attention to social information which then elicits a valence effect on their enjoyment. Results also showed that a negativity bias occurred: Participants paid most attention to negative social information. Accordingly, the effect of social information on enjoyment was stronger for negative social information. This study is the first to show that social information of online videos affects the experiences of video viewers in settings where viewers are in charge of how much attention they pay to social information.
On social media platforms, users are not only exposed to content created by professional content providers, they are also exposed to content created by average users, notably, to evaluative information in the form of comments and (dis)likes. This evaluative information is referred to as social information. One frequently studied characteristic of social information is its valence (i.e., its positivity or negativity) (e.g., Cameron & Geidner, Citation2014; Möller & Kühne, Citation2019; Möller, Kühne, Baumgartner, & Peter, Citation2019; Waddell & Sundar, Citation2017; Walther, DeAndrea, Kim, & Anthony, Citation2010; Winter, Krämer, Benninghoff, & Gallus, Citation2018). Research shows that the valence of social information is an important determinant of media users’ entertainment experiences. While positive social information leads to more enjoyment, negative social information leads to less enjoyment of online videos (Möller & Kühne, Citation2019; Waddell & Sundar, Citation2017; Winter et al., Citation2018).
The influence of social information’s valence on the experiences of video viewers has mainly been studied in experimental settings (e.g., Cameron & Geidner, Citation2014; Möller & Kühne, Citation2019; Waddell & Sundar, Citation2017; Walther et al., Citation2010). These experiments are somewhat limited in their ecological validity: Either they embed the social information into the online videos (Cameron & Geidner, Citation2014; Waddell & Sundar, Citation2017) or they explicitly instruct participants to examine the social information (Möller & Kühne, Citation2019; Walther et al., Citation2010). Thus, these experiments are forced-exposure designs in which it is certain that video viewers pay attention to the social information. On major video platforms such as YouTube, in contrast, social information is often not immediately visible (e.g., because the user has to scroll down to see comments). It is, therefore, unclear whether and how much attention users of online video platforms typically pay to the various types of social information. Moreover, forced exposure to information may alter individuals’ processing of that information (Cho, Lee, & Tharp, Citation2001; McQuarrie & Mick, Citation2003). For example, Cho et al. (Citation2001) found that individuals are more likely to remember online advertisements under forced-exposure conditions than when they are in control of how much attention they pay to advertisements. Applying this to the case of online social information, it is plausible that participants in forced-exposure experiments reacted differently to the social information than they would have done if they could decide how much attention they pay to social information. Thus, because of the limited psychological realism of previous forced-exposure experiments (Wilson, Aronson, & Carlsmith, Citation2010), we do not know whether the effect of social information on viewers’ video enjoyment also occurs outside of experimental settings.
In response to the problems described above, the present study has two goals. The first goal of this study is to investigate whether and how much attention video viewers pay to different types of social information (i.e., (dis)likes and comments) when no instructions on whether or not to look at social information are given. The second goal is to examine the effects of the valence of social information on viewers’ enjoyment in response to online videos. This study employs a media use setting in which viewers can decide if and how much attention they pay to the social information. This allows us to investigate the attention paid to social information and its effects on users in a naturalistic setting. This paper thereby contributes to the literature on the effects of social information in two ways. First, by studying individuals’ attention to social information, this study will show how likely individuals are to pay attention to social information when they watch videos in their daily life. Second, the results of this study will increase our understanding of how social information’s valence changes users’ experiences of online videos when they can choose how much attention they pay to social information.
Video viewers’ attention to social information
Multiple studies have demonstrated the effect of the valence of social information on viewers’ self-reported video enjoyment (Waddell & Sundar, Citation2017; Winter et al., Citation2018). Their results are consistent: While video viewers who are exposed to positive social information experience more enjoyment of a video, video viewers who are exposed to negative social information experience less enjoyment (Waddell & Sundar, Citation2017; Winter et al., Citation2018). Two explanations for this finding are offered by researchers. Shedlosky-Shoemaker, Costabile, DeLuca, and Arkin (Citation2011) argue that the valence of social information read prior to exposure to the main media content shapes people’s expectations of that content. These expectations then guide people’s attention to those elements of the main content that are in line with their expectations, thus changing people’s experience of the main media content. Alternatively, Waddell and Sundar (Citation2017) suggest that, by noticing the valence of social information, video viewers become aware of others’ opinions of a video. This makes them adjust their own video evaluations because people have a tendency to adjust their evaluations to that of the group. Thus, while Shedlosky-Shoemaker et al. (Citation2011) argue that social information can alter individuals’ actual experiences of media content, Waddell and Sundar (Citation2017) suggest that social information only alters individuals’ evaluations of media content. Although these are two different explanations, both imply that the valence of social information is an important predictor of viewer responses.
A fundamental assumption of the explanations described above is that, in their daily life, video viewers pay attention to social information and notice its valence. However, this assumption has not actually been tested because previous studies are set up in a way that ensures that participants are exposed to social information. For example, Waddell and Sundar (Citation2017) exposed participants to a video together with social information in the form of Twitter messages. In their study, the Twitter feed was embedded on-screen so that viewers could hardly avoid the Twitter messages. Similarly, Winter et al. (Citation2018) let participants watch a video while social information about that video appeared in a chat box on a tablet. While chatting about the video, participants most likely read the comments about the video posted by other viewers in the chat box. Finally, Möller and Kühne (Citation2019) instructed participants to examine user comments before they were exposed to a video.
Survey studies investigating YouTube usage have shown that viewers may pay at least some attention to social information in their daily life. YouTube use is often motivated by the need for entertainment (Hanson & Haridakis, Citation2008; Klobas, McGill, Moghavvemi, & Paramanathan, Citation2018). The entertainment motive, in turn, was found to positively predict reading comments on YouTube (Khan, Citation2017). Although the literature suggests that YouTube users pay attention to both online videos and their social information, it is unclear how much attention they pay to social information exactly. Moreover, social information on online video platforms often consists of at least two parts: User comments placed below the video as well as likes and dislikes. Neither the experimental studies nor the survey studies discussed above indicate how much attention video viewers pay to the different aspects of social information. Hence, the present study aims to answer the following research question:
RQ1: How much attention do video viewers pay to the social information presented alongside online videos?
The valence of social information and viewers’ attention
A better understanding of what may drive online video viewers to pay attention to social information can be derived from the literature on information processing. Studies in this field indicate that the valence of information influences how much attention the information receives. Specifically, research on the negativity bias suggests that compared to positive information, negative information generally draws more attention and can be detected more easily (Baumeister, Bratslavsky, Finkenauer, & Vohs, Citation2001; Rozin & Royzman, Citation2001). The negativity bias is said to have evolutionary origins: The ability to quickly detect and react to negative events increases a species’ chance to survive threats and, thus, supports its adaptation to the environment (Baumeister et al., Citation2001). However, scholars found that the negativity bias occurs in a wide range of contexts, also when individuals’ safety is not at risk. For example, Dijksterhuis and Aarts (Citation2003) conducted three experiments in which they presented participants with words that appeared on a screen for approximately 13 milliseconds. They consistently found that participants are better at detecting negative words than positive words. In addition, the negativity bias has been found in situations where individuals engage in a task while they are presented with additional, superfluous information. Scholars found that in such situations, negative information draws more attention than positive information (Pratto & John, Citation1991). In the context of online video viewing, these findings suggest that negative user comments are likely to be detected faster and to draw more attention than positive user comments. Moreover, Dijksterhuis and Aarts' (Citation2003) finding that the valence of single words can bias the allocation of attention implies that a negativity bias should also emerge with regard to video viewers’ attention to the likes and dislikes that are presented alongside videos.
Because studies on the valence of social information did not investigate video viewers’ attention to social information in particular, it is still unknown whether a negativity bias also exists for social information. However, scholars investigating consumers’ attention to online product reviews do provide some support for a negativity bias in online contexts. In these studies, negative online product reviews received more attention than positive or neutral product reviews (Daugherty & Hoffman, Citation2014; Hoffman & Daugherty, Citation2013; Sen & Lerman, Citation2007).
Still, it is important to consider two crucial differences between online product reviews and social information of online videos that may affect the emergence of a negativity bias. First, the visibility of the social information may differ. In the studies discussed above, the product reviews constituted the focal point of the online content to which participants were exposed, and it is likely that most participants paid attention to the reviews. On platforms such as YouTube, in contrast, videos constitute the focal point. Indeed, (dis)likes are typically placed right next to the videos, but user comments are often not immediately visible and users have to scroll down to see them. Second, product reviews and social information of online videos may differ in their relevance. When individuals shop online, they spend money and they often rely on online product reviews to decide whether an investment is adequate (Cheung & Thadani, Citation2012). Consumers are often motivated to seek out product reviews because they typically provide relevant information (Goldsmith & Horowitz, Citation2006). In contrast, viewers of online videos have relatively little to lose – they only spend time – and the diagnostic value of the accompanying social information is often unclear. Comments, for instance, may not refer to the video or they may not constitute valid assessments. This may limit the relevance of social information and users’ motivation to process social information. Differences in visibility and relevance thus give rise to the question of whether the negativity bias found in research on product reviews also emerges when individuals use video-sharing websites.
The negativity bias has also been demonstrated in research on attention to news. Studies show that people are more likely to select negative news articles than positive news articles (Trussler & Soroka, Citation2014). More importantly, Kätsyri, Kinnunen, Kusumoto, Oittinen, and Ravaja (Citation2016) investigated individuals’ attention to secondary social information about online news videos in the form of Tweets appearing on a tablet. They found that participants looked longer at negative Tweets than positive Tweets. In addition, participants recalled negative Tweets better than positive Tweets (Kätsyri et al., Citation2016). This further corroborates the negativity bias with regard to social information, but again in a context in which the social information has a high visibility (second screen) and in which the relevance of the social information to the main content is clear. As it is unclear how much attention individuals pay to social information that is not immediately visible and whose relevance is unknown, this study sets out to test the following hypothesis:
H1: Individuals who are exposed to an online video with solely negative social information pay more attention to the social information than individuals who are exposed to an online video with solely positive social information.
The studies on online product reviews and news content discussed above found that solely negative information receives more attention than solely positive information (Daugherty & Hoffman, Citation2014; Hoffman & Daugherty, Citation2013; Kätsyri et al., Citation2016; Sen & Lerman, Citation2007; Trussler & Soroka, Citation2014). However, social information on video platforms such as YouTube seldom contains exclusively negative or positive comments. Instead, the social information is often mixed, that is, it usually consists of both positive and negative comments (Möller et al., Citation2019). This raises the question of how video viewers allocate their attention to social information if it contains both positive and negative elements. If the negativity bias holds, video viewers would pay more attention to negative comments posted in response to online videos than to positive comments. Moreover, it implies that viewers pay more attention to dislikes assigned to videos than to likes. We therefore expect that:
H2: Individuals who are exposed to an online video with positive as well as negative social information pay more attention to the negative social information than to the positive social information.
The valence of social information and viewers’ enjoyment
By investigating how much attention video viewers pay to social information, it remains unclear if the attention that video viewers pay to social information is sufficient to notice its valence and to be influenced by it. Consequently, we do not know if the aforementioned effects of social information’s valence on video viewers’ enjoyment also occur when video viewers can choose how much attention they pay to the social information.
In the current study, the control over how much attention is paid to the social information of a video lies with the video viewers. Therefore, it is uncertain that everyone participating in the study pays attention to the social information; some people may not pay any attention to the social information at all. It is likely that the valence of social information only affects the experiences of viewers who pay attention to the social information. Therefore, the effect of the valence of social information should only emerge among those video viewers who pay attention to the social information while they should not emerge among those who did not pay any attention to the social information at all. To test this notion, we propose the following:
H3: The valence of social information has an effect on individuals’ enjoyment which is moderated by individuals’ attention to the social information. (a) Video viewers who are exposed to solely positive social information enjoy the video more than viewers who are exposed to solely negative social information, or to both positive and negative social information. Video viewers who are exposed to both positive and negative social information enjoy the video more than viewers who are exposed to solely negative information. (b) However, these differences only emerge among video viewers who pay attention to the social information, not among video viewers who do not pay attention to the social information.
Method
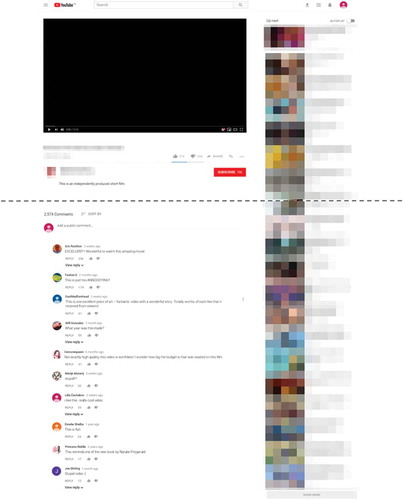
We conducted a laboratory experiment in which participants watched an online video in a way that resembles how they would watch online videos in their daily life. To this end, we built a webpage that mimics the online video platform YouTube. We choose to use YouTube as a stimulus because YouTube is frequently used to watch online videos (Khan, Citation2017). We chose to mimic a YouTube page because this allowed us to control which comments and (dis)likes were presented and to create a stable stimulus (see for a screenshot of the mimicked YouTube page).
Figure 1. Example screenshot of mimicked YouTube page shown to participants (mixed condition). Video title, name of video creator, and recommended videos were not blurred in the original stimulus. The dotted line indicates which part of the page was visible before scrolling (above dotted line) and which area was visible only after scrolling down (below dotted line)
While participants watched the video, their gaze was tracked using a binocular SMI RED remote eye tracker with a sampling rate of 120 Hz. After watching the video, all participants filled out the same questionnaire in the laboratory. The ethical committee of the authors’ university granted Institutional Review Board approval for this study.
Stimulus material
During the experiment, all participants watched the same online video, namely the animated short film Reversal of the Heart (Carolyn Chrisman, Citation2011) which is 13 min and 10 sec long and available on YouTube (https://www.youtube.com/watch?v=rHLwG3ioD4Y). This film was chosen for the present study because animated short films constitute a popular genre of YouTube videos. All participants indicated that they had never seen this video before the experiment.
The video was embedded within the mimicked YouTube page. The page was presented to the participants through an Internet Explorer web browser on a 1680 × 1050 pixels monitor. Below the video on the webpage, the video’s (dis)likes were presented. The (dis)likes had a size of 150 × 55 pixels and were presented at a 3.47° x 1.30° visual angle at a 66 cm viewing distance. After scrolling down, participants could see the video’s comments. The comments had a size of 910 × 1100 pixels and were presented at a 20.67° x 25.04° visual angle at a 66 cm viewing distance.
The social information presented below the video differed across the three conditions. Participants in the positive condition viewed a YouTube page which presented the video together with “35K likes” and “1K dislikes”, as well as eight positive comments (e.g., “lovely!!!!”). As stated before, YouTube videos typically do not receive comments that all have the same valence. Thus, to make the comments on the YouTube page look more authentic, two neutral comments (e.g., “What year was this made?”) were included in addition to the positive comments. In total, the ten comments consisted of 83 words. To reduce the possibility that the specific order of the user comments would play a role, two versions of this YouTube page were created. The two pages were identical except for the fact that the order of the comments differed between the two pages. Participants who were assigned to the negative condition viewed a YouTube page with “1K likes” and “35K dislikes”, eight negative comments (e.g., “stupid!!!!”), and two neutral comments (85 words in total). Again, two versions of this page were created that differed with regard to the order in which the comments were presented. Finally, participants in the mixed condition viewed a YouTube page with both positive and negative social information. Two versions of this page were created. One version showed “35K likes” and “31K dislikes” while the other version showed “31K likes” and “35K dislikes”. Both versions displayed the same comments of which four were positive, four were negative, and two were neutral. The order of the comments was varied for both versions of the YouTube page so that participants who saw more likes first saw a negative comment. Participants who saw that the video received more dislikes first saw a positive comment. In total, the comments displayed to participants in the mixed condition consisted of 84 words.
A pilot study was conducted to test the manipulation of the social information’s valence. A group of 25 participants who did not participate in the main experiment rated the valence of each comment. Participants could rate the valence on a 9-point scale (−4 = extremely negative, 4 = extremely positive). We ran a repeated-measures analysis of variance (ANOVA) with participants’ valence assessment of the positive comments, the negative comments, and the neutral comments as the dependent variables. Positive, negative, and neutral comments differed significantly from each other in their valence as assessed by the participants, F(2,48) = 791.58, p < .001. Negative comments were rated as more negative (M = −2.71, SD = .47) than positive comments (M = 2.74, SD = .43), p < .001, and neutral comments (M = .14, SD = .54), p < .001. In addition, positive comments were rated as more positive than neutral comments, p < .001. Based on this, the manipulation of the valence of the social information was deemed successful.
Participants
Participants for this study were recruited via the website of a large European university’s psychology lab. An a priori power analysis indicated that to detect a small effect (i.e., with part. η2 = .05), a total sample of 186 participants was required (Cohen, Citation1988; Faul, Erdfelder, Lang, & Buchner, Citation2007). However, using an eye tracker poses a risk of having to exclude data due to insufficient eye tracking data quality. To account for this risk, we aimed for a sample size of 232 participants (125% of the required sample size as indicated by the power analysis).
In exchange for participating, students received either €5 or extra course credits. In total, 228 students reported to the lab to participate in the study. The data of nine participants were excluded from the analysis because the participants did not follow the instructions and visited other websites in addition to the stimulus webpage. The data of another seven participants were excluded from the analysis because of unsuccessful calibration, (i.e., the horizontal and/or vertical deviation was larger than 1.50°). The final sample consisted of 212 participants (25.9% Male, Mage = 21.18, SDage = 2.78).
Participants were randomly assigned to one of the three valence conditions. This resulted in 71 participants in the positive valence condition, 69 participants in the negative valence condition, and 72 participants in the mixed valence condition.
Procedure
Upon arrival at the lab, participants were informed about the procedure of the study. After giving their consent to participate, participants took a seat in front of a desktop computer and an eye tracker. The researcher informed the participants that instructions would be presented on the computer screen and that a YouTube page with a video would then appear. Participants were further told that they could do anything they liked and that they could use the mouse to click or to scroll, as long as they would not set the video to full screen mode. The latter instruction was given in order to assure that all participants were exposed to the same screen during the study, which was required for subsequent analysis of the eye tracking data. Participants were also told that after the video, there would be some questions that they could answer using a tablet, but that these were not knowledge questions about the video and that they did not need to memorize the video while watching. Finally, the researcher explained that the study would start with calibrating the eye tracker and that the eye tracking part of the study would end with a calibration validation screen.
After the instructions were given, the eye tracker was calibrated using a 9-point calibration method available in the software of the eye tracker. It displayed black circles (approximately 30 by 30 pixels) against a white background. Participants were seated at an average distance from the monitor of approximately 66 cm. If the horizontal or vertical deviation was greater than 0.60° the calibration was repeated until the deviation was satisfactory with a maximum of three repetitions (see for descriptive statistics of the eye tracking data quality). After calibration, a text appeared reminding the participants of the instructions (i.e., repeating the information given by the researcher) and informing them that they could take as much time as they wanted to explore the YouTube page. Finally, the text instructed participants to close the web browser once they were done. After this, the YouTube page with the video was presented to the participants. After watching the video, participants could choose how long they would stay on the webpage before closing it. Participants spent an average of 13.35 minutes on the webpage, which includes the time they spent watching the video. Once participants closed the web browser, an instruction text appeared reminding the participants that next, a calibration validation screen would appear. After the validation screen was presented, the final instructions asked the participants to tell the researcher that they were ready to fill out the questionnaire on a tablet.
Table 1. Eye tracking data quality report
Measures
Attention to social information
To measure participants’ attention to social information, the eye tracking data were exported to the SMI BeGaze analysis software (SensoMotoric Instruments, Citation2014). Participants’ attention to social information was operationalized as the sum of durations (in seconds) of all fixations and saccades that occurred within an Area of Interest (AOI), referred to as the dwell time. The AOIs used for data analysis were created by drawing rectangles around the relevant areas on the stimulus webpages. This was done by a volunteer who was unaware of the hypotheses tested in this study. For all webpages used in the study, two AOIs of 71 × 49 pixels were created: one for the likes and one for the dislikes. In analyses in which no distinction was made between participants’ attention to the likes and their attention to the dislikes, attention to the (dis)likes was operationalized as the sum of participants’ attention to the likes and the dislikes. For the comments presented on each YouTube page, AOIs of approximately 825 × 1118 pixels were created. Finally, AOIs for each individual comment were created with sizes ranging from 810 × 74 pixels to 810 × 114 pixels, depending on the length of the comment. When comparisons were made between participants’ attention to comments, attention to comments was measured by dividing the dwell time by the number of words to which participants were exposed as this varied slightly.
Enjoyment
Participants’ enjoyment of the video was measured using a scale developed by Wirth, Hofer, and Schramm (Citation2012). The scale consists of three items (i.e., “I felt well entertained watching the video”, “It was fun watching the video”, and “It was pleasurable to watch the video”). Participants were asked to indicate the extent to which they agree with each of the items on a 7-point scale (1 = strongly disagree, 7 = strongly agree). To verify that the items together form one construct, we conducted a principal axis factor analysis with oblique rotation (direct oblimin). Results indicated that all items loaded on a single factor (eigenvalue = 2.63). By averaging the scores on the three items, an overall score was created (M = 4.62, SD = 1.42). The results of a reliability analysis showed that the items form a reliable scale (Cronbach’s Alpha = .93).
Youtube usage
We used one item to measure the frequency with which participants use YouTube in their daily life. Participants were asked to indicate how often they watch videos on YouTube on a 7-point scale (1 = never, 7 = more than once every day) (M = 5.62, SD = 1.42). This item was used as part of a randomization check.
Attention to comments in daily life
We measured how often participants pay attention to user comments in their daily life using one item. Participants indicated how often they read user comments when they use YouTube in their daily lives on a 5-point scale (1 = never, 5 = always) (M = 3.00, SD = 1.17). The data gathered through this item were used as part of a randomization check.
Preference for animated short films
One item was used to measure participants’ preference for animated short films. Participants were asked to indicate how much they (dis)liked animated films and videos on a 7-point scale (1 = dislike a great deal, 7 = like a great deal) (M = 4.83, SD = 1.60). This item was part of a randomization check.
Background information
We acquired background information about the sample through three questions. First, participants were asked to indicated if they had seen the video that they watched during the study before their participation (1 = yes, 2 = no). Second, an open question asked participants to indicate their age in years. Third, participants were asked to indicate their biological sex (1 = male, 2 = female, 3 = I prefer not to answer).
Results
Randomization
The enjoyment that viewers experience in response to online videos may depend on their gender and their preference for specific content genres (Hixson, Citation2006; Oliver, Weaver, & Sargent, Citation2000). To ensure that there were no systematic differences between the conditions with regard to participants’ gender, we ran a chi-square test. The results of this test indicated that there were no differences between the conditions with regard to participants’ gender, χ2(2, N = 212) = .14, p = .934. In addition, we checked with an ANOVA whether the experimental conditions differed with regard to participants’ preference for animated films and videos. The results indicated that there were no differences between the conditions with regard to participants’ preference for animated films and videos, F(2,209) = .02, p = .980.
We further checked whether the experimental conditions differed with regard to participants’ use of YouTube in their daily lives. The results of an ANOVA indicated that there were no differences between the conditions in terms of participants’ YouTube usage, F(2,209) = 1.60, p = .205. Finally, we checked whether the experimental conditions differed with regard to how often participants read comments posted in response to YouTube videos. Results of an ANOVA indicated that there were no differences between conditions in terms of how often they read comments on YouTube, F(2,209) = .82, p = .443.
Analysis of research question and test of hypotheses
Research question 1 asked how much attention video viewers pay to the social information of YouTube videos. To answer this question, we first examined the descriptive statistics of all participants’ attention to videos’ (dis)likes (N = 212). We found that 72.6% of the participants paid at least some attention to the (dis)likes. The mean duration of their attention to the (dis)likes was .86 seconds (SD = 1.36). Approximately 27.4% of the participants did not spend any time looking at the (dis)likes. Regarding participants’ attention to user comments, we found that 70.3% of the participants paid at least some attention to the comments. Participants who paid attention to the comments spent 11.47 seconds on average (SD = 11.65) looking at them. Approximately 29.7% of the participants did not pay any attention to the comments at all (also see for an extensive overview of participants' attention to (dis)likes and comments).
Table 2. Descriptive statistics of participants’ attention to social information
The first hypothesis of this study stated that viewers who are exposed to a video with negative social information pay more attention to that social information than video viewers who are exposed to positive social information. To test this hypothesis, we ran a multivariate analysis of variance (MANOVA) on the data of all participants (N = 212). This analysis was run with participants’ condition as the independent variable and their attention to the (dis)likes, as well as their attention to the comments as the dependent variables. Roy’s largest root indicated that there was a significant difference in the attention that participants paid to social information, depending on participants’ condition, Θ = .08, F(2,209) = 8.70, p = < .001. The analysis further showed that participants differed across conditions in terms of how much attention they paid to (dis)likes, F(2,209) = 3.99, p = .020, part. η2 = .04, and to user comments, F(2,209) = 6.62, p = .002, part. η2 = .06. Results of Bonferroni post-hoc tests showed that participants in the negative condition spent significantly more time looking at the (dis)likes (M = 1.21, SD = 1.88) than participants in the positive condition (M = .58, SD = .68),p = .018. Moreover, participants in the negative condition spent on average significantly more time looking at the comments (M = .18, SD = .15) than participants in the positive condition (M = .10, SD = .10),p = .002.
Because Levene’s test showed that the assumption of homoscedasticity was violated both for participants’ attention to (dis)likes, F(2,209) = 12.54, p < .001, and for their attention to user comments, F(2,209) = 6.21, p = .002, we validated these findings using Games-Howell post-hoc tests, which do not assume homogenous variances. The results corroborated the findings of the Bonferroni post-hoc test. In addition, descriptive statistics of participants’ attention to (dis)likes indicated that the scores on this variable were non-normally distributed with a skewness of 3.37 (SE = .17) and a kurtosis of 16.36 (SE = .33). Therefore, the findings of this analysis were validated using bootstrapped standard errors. The results corroborated the original findings. These results support Hypothesis 1.
According to Hypothesis 2, video viewers who are exposed to both positive and negative social information pay more attention to the negative social information on the YouTube page than to the positive social information. To test this, we ran two paired-samples t-tests including only the data of participants who were in the mixed condition and who thus were exposed to both positive and negative social information (n = 72). The first analysis compared participants’ attention to the dislikes to their attention to the likes. Results showed that although participants spent more time on average looking at the dislikes (M = .44, SD = .76) than at the likes (M = .36, SD = .56), this difference was not significant, p = .213. The second analysis compared participants’ attention to the positive comments to their attention to the negative comments. Results of this analysis showed that participants spent more time looking at the negative comments (M = .20, SE = .03) than at positive comments (M = .12, SE = .02) presented on the YouTube page. This effect was significant, 95% CI [−.12, −.04], t(71) = −3.70, p < .001, and represented a small-sized effect, d = −0.44. These results partially support Hypothesis 2.
Hypothesis 3 stated that the valence of social information has an effect on individuals’ enjoyment which is moderated by individuals’ attention to the social information. More specifically, participants exposed to solely positive social information should experience more enjoyment than participants who are exposed to solely negative social information, and participants exposed to both positive and negative social information; and participants who are exposed to both positive and negative social information should experience more enjoyment than participants who are exposed to solely negative social information. This effect is presumed to occur only for video viewers who paid attention to the social information. To test Hypothesis 3, two dummy variables were created. The first dummy indicated whether or not participants had looked at the (dis)likes, and the second dummy indicated whether or not participants had scrolled down and looked at the comments. If Hypothesis 3 holds, we would expect significant interaction effects between participants’ condition and their attention to the (dis)likes or their attention to the comments on participants’ video enjoyment to emerge. We ran two ANOVA’s using the data of all participants (N = 212). The first ANOVA included participants’ condition and the dummy variable indicting if participants had paid attention to the (dis)likes as the independent variables. Participants’ video enjoyment was included as the dependent variable. Results showed no main effect of participants’ condition, p = .084, nor of their attention to the (dis)likes, p = .085. Furthermore, there was no interaction between participants’ condition and their attention to the (dis)likes, p = .845.
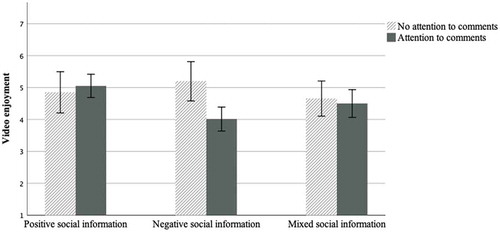
Second, we ran an ANOVA with participants’ condition and the dummy variable indicating if participants had paid attention to the comments as the independent variables and video enjoyment as the dependent variable. We found no main effect of participants’ condition, p = .264, and no main effect of attention to the comments, p = .072, on participants’ enjoyment of the video. However, there was a significant interaction between participants’ condition and their attention to the comments, F(2,206) = 3.67,p = .027, part. η2 = .03. The results of a Bonferroni post-hoc test indicated that for participants who saw the comments, solely positive social information led to more enjoyment (M = 5.05, SD = 1.30) than solely negative social information (M = 4.01, SD = 1.35), p < .001. For participants who paid attention to the comments, there was no difference in video enjoyment between those who saw solely positive social information, and those who saw a mixture of positive and negative social information, p = .150. In addition, among participants who looked at the comments, there was no difference in video enjoyment between those who saw solely negative social information and those who saw both positive and negative social information, p = .246. For participants who did not look at the comments, the valence of social information did not affect their enjoyment.
To further refine our understanding of the interaction effect, we also compared, within each experimental condition, participants who looked at the comments to participants who did not look at the comments (see ). We ran an independent samples t-test in each of the experimental conditions in which participants’ attention to the comments was included as the independent variable and video enjoyment was included as the dependent variable. Results showed that for participants exposed to solely positive social information (n = 71), there was no difference in video enjoyment between participants who paid attention to the comments and those who did not, t(69) = −.57, p = .57. Similarly, for participants exposed to both positive and negative social information (n = 72), there was no difference in enjoyment between participants who did pay attention to the comments and those who did not, t(70) = .43, p = .67. For participants exposed to solely negative social information (n = 69), however, participants who did pay attention to the comments experienced less enjoyment (M = 4.01, SE = .19) than participants who did not pay attention to the comments (M = 5.20, SE = .31). This difference was significant, 95% CI [.44, 1.93], t(67) = 3.17, p = .002, and represented a large effect size, d = 0.89. In all, these results partially support Hypothesis 3.
Figure 2. Video enjoyment as a function of the valence of social information and attention to comments
Discussion
Recently, scholars have investigated how the valence of social information affects the enjoyment of people watching online videos (Waddell & Sundar, Citation2017; Winter et al., Citation2018). In their studies, researchers typically assumed that people pay attention to social information and notice its valence. The current study set out to test this assumption by examining how the valence of social information affects video viewers’ enjoyment when viewers can determine how much attention they pay to social information. While doing so, this study distinguished between two components of social information that are often represented on social media, namely (dis)likes and user comments.
With regard to video (dis)likes, we found that most participants paid at least some attention to them. In addition, participants who saw a video that received mostly dislikes paid more attention to the (dis)likes than participants who saw a video that received mostly likes. However, when participants saw a video that received equal amounts of likes and dislikes, attention to likes and dislikes did not differ. Moreover, participants’ video enjoyment was not affected by their attention to the video’s (dis)likes. Thus, our results regarding (dis)likes did not fully support our expectation that video viewers would pay more attention to negative social information and would be more affected by it. Our findings seem to contradict the study by Dijksterhuis and Aarts (Citation2003), who found that negative words had a stronger impact than positive words. A possible reason for this discrepancy is that single negative words may have an intrinsic value that is more comprehensible than a symbol in the form of a like or a dislike that is accompanied by a number. This may explain why the negativity bias was less evident in the current study where individuals were exposed to (dis)likes presented below a video. However, additional research is needed to test the notion that a negativity bias is more likely to occur when individuals are exposed to words than when they are exposed to symbols and numbers as is the case for online videos’ (dis)likes.
With regard to video viewers’ attention to user comments, our results showed a negativity bias in two ways. First, participants who were exposed to solely negative social information spent more time looking at the comments than did participants who were exposed to solely positive social information. Second, participants who were exposed to both positive and negative social information spent more time looking at the negative comments. Whereas these findings are in line with research on the negativity bias, the results related to viewers’ enjoyment were more complex. Our results suggest that participants who saw solely positive comments enjoyed the video more than did participants who saw solely negative comments. However, the effect of social information’s valence on video enjoyment only occurred for those participants who paid attention to the user comments; there was no effect for video viewers who did not pay attention to the user comments. Moreover, among participants who were exposed to solely positive social information and among participants who were exposed to both positive and negative social information, the enjoyment of those who paid attention to the user comments was similar to the enjoyment of those who did not pay attention to the user comments. Among participants who were exposed to solely negative social information, however, those who did pay attention to the user comments enjoyed the video notably less than those who did not pay attention to the user comments.
On the one hand, the significant difference in the negative comments condition and the non-significant difference in the positive comments condition can be regarded as further support for the literature on the negativity bias (Baumeister et al., Citation2001; Rozin & Royzman, Citation2001). On the other hand, the non-significant difference in the mixed comments condition can be interpreted as a contradiction to the negativity bias assumption: If negative comments have a stronger effect than positive comments, then paying attention to mixed comments should lead to less enjoyment than paying no attention to mixed comments. Overall, the results regarding negativity biases in the effects of social information are thus not fully consistent, and future research that investigates the effects of comments’ valence in more detail is required.
A limitation of the present study is related to our aim of creating a setting in which participants were free to choose how much attention they pay to the social information of a video. To this end, participants did not receive specific instructions about which elements of the stimulus webpage to examine or how much time to spend examining the page. The fact that 27.4% of the participants did not pay any attention to the (dis)likes and that 29.7% of the participants did not pay any attention to the comments indicates that this study succeeded at creating a setting in which participants felt free to determine how much attention to social information they would pay. Nevertheless, participants were aware that their gaze was being monitored, which is different from watching a YouTube video in a natural setting and may have influenced participants’ viewing behavior. For example, participants may have felt obliged to pay close attention to the video, leading them to scroll down to the comments less often than they would do when they are watching videos at home. However, it is also possible that participants looked at the social information more than usual because they felt obliged to carefully examine the entire webpage. Both scenarios are possible and constitute a limitation that should be considered when interpreting the results of this study.
In previous studies, scholars have investigated which people are most susceptible to the influence of social information by including personality traits as moderators in their models. These studies did not find interaction effects that could support the moderating role of personality traits (Waddell & Sundar, Citation2017; Walther et al., Citation2010). This suggests that social information affects all viewers in the same way. However, we found that only the enjoyment of video viewers who pay attention to user comments is affected by social information’s valence. Previous studies on YouTube usage indicate that some online video viewers are more inclined to pay attention to comments than others (Khan, Citation2017). This, in turn, implies that some people are more affected by the valence of social information than others. For example, Khan (Citation2017) found that reading comments on YouTube positively correlated with individuals’ motive to use YouTube for entertainment or for information seeking, and that men are more likely to read comments than women. In addition, Waddell and Sundar (Citation2017) studied how individuals’ need for uniqueness and need for affiliation moderate the effect of social information. By investigating how these individual differences predict attention to social information, future studies may unravel which YouTube users are most susceptible to the influence of social information’s valence.
The present study advances our knowledge on the effects of the valence of social information on video viewers’ enjoyment. Its contribution to the literature is twofold. First, the study increases our knowledge on how much attention video viewers pay to social information if they are in control and how this depends on the valence of social information. Second, our findings help to better understand the external validity of previous studies that were set up in such a way that all participants paid attention to social information. On the one hand, our findings indicate that the valence effect found in previous studies likely occurs in real life, although the set-up of these earlier studies is somewhat unrealistic. On the other hand, our findings imply that, in real life, the valence effect is less discernable because not all YouTube users pay attention to the social information of videos. Nevertheless, this study showed that the collective creation of content is not the only factor that makes social media social. Just like the videos uploaded on YouTube, a part of our video experiences is user-generated.
Disclosure statement
No potential conflict of interest was reported by the authors.
References
- Baumeister, R. F., Bratslavsky, E., Finkenauer, C., & Vohs, K. D. (2001). Bad is stronger than good. Review of General Psychology, 5(4), 323–370. doi:10.1037//1089-2680.5.4.323
- Cameron, J., & Geidner, N. (2014). Something old, something new, something borrowed from something blue: Experiments on dual viewing TV and Twitter. Journal of Broadcasting & Electronic Media, 58(3), 400–419. doi:10.1080/08838151.2014.935852
- Cheung, C. M. K., & Thadani, D. R. (2012). The impact of electronic word-of-mouth communication: A literature analysis and integrative model. Decision Support Systems, 54(1), 461–470. doi:10.1016/j.dss.2012.06.008
- Cho, C.-H., Lee, J.-G., & Tharp, M. (2001). Different forced-exposure levels to banner advertisements. Journal of Advertising Research, 41(4), 45–56. doi:10.2501/JAR-41-4-45-56
- Chrisman, C. (2011). Reversal of the heart [Animated short film]. Retrieved from https://www.youtube.com/watch?v=rHLwG3ioD4Y
- Cohen, J. (1988). Statistical power analysis for the behavioral sciences (2nd ed.). Hillsdale, New Jersey: Lawrence Erlbaum.
- Daugherty, T., & Hoffman, E. (2014). eWOM and the importance of capturing consumer attention within social media. Journal of Marketing Communications, 20(1–2), 82–102. doi:10.1080/13527266.2013.797764
- Dijksterhuis, A., & Aarts, H. (2003). On wildebeests and humans: The preferential detection of negative stimuli. Psychological Science, 14(1), 14–18. doi:10.1111/1467-9280.t01-1-01412
- Faul, F., Erdfelder, E., Lang, A.-G., & Buchner, A. (2007). G*Power 3: A flexible statistical power analysis program for the social, behavioral, and biomedical sciences. Behavior Research Methods, 39, 175–191. Retrieved from http://www.gpower.hhu.de/fileadmin/redaktion/Fakultaeten/Mathematisch-Naturwissenschaftliche_Fakultaet/Psychologie/AAP/gpower/GPower3-BRM-Paper.pdf
- Goldsmith, R. E., & Horowitz, D. (2006). Measuring motivations for online opinion seeking. Journal of Interactive Advertising, 6(2), 2–14. doi:10.1080/15252019.2006.10722114
- Hanson, G., & Haridakis, P. (2008). YouTube users watching and sharing the news: A uses and gratifications approach. The Journal of Electronic Publishing, 11(3), 1–14. doi:10.3998/3336451.0011.305
- Hixson, T. K. (2006). Mission possible: Targeting trailers to movie audiences. Journal of Targeting, Measurement and Analysis for Marketing, 14(3), 210–224. doi:10.1057/palgrave.jt.5740182
- Hoffman, E., & Daugherty, T. (2013). Is a picture always worth a thousand words? Attention to structural elements of eWOM for consumer brands within social media. Advances in Consumer Research, 41, 326–331. Retrieved from http://www.acrwebsite.org/volumes/v41/acr_v41_14817.pdf
- Kätsyri, J., Kinnunen, T., Kusumoto, K., Oittinen, P., & Ravaja, N. (2016). Negativity bias in media multitasking: The effects of negative social media messages on attention to television news broadcasts. PloS One, 11(5), 1–21. doi:10.1371/journal.pone.0153712
- Khan, M. L. (2017). Social media engagement: What motivates user participation and consumption on YouTube? Computers in Human Behavior, 66, 236–247. doi:10.1016/j.chb.2016.09.024
- Klobas, J. E., McGill, T. J., Moghavvemi, S., & Paramanathan, T. (2018). Compulsive YouTube usage: A comparison of use motivation and personality effects. Computers in Human Behavior, 87, 129–139. doi:10.1016/j.chb.2018.05.038
- McQuarrie, E. F., & Mick, D. G. (2003). Visual and verbal rhetorical figures under directed processing versus incidental exposure to advertising. Journal of Consumer Research, 29(4), 579–587. doi:10.1086/346252
- Möller, A. M., & Kühne, R. (2019). The effects of user comments on hedonic and eudaimonic entertainment experiences when watching online videos. Communications. Advance online publication. doi:10.1515/commun-2018-2015
- Möller, A. M., Kühne, R., Baumgartner, S. E., & Peter, J. (2019). Exploring user responses to entertainment and political videos: An automated content analysis of YouTube. Social Science Computer Review, 37(4), 510–528. doi:10.1177/0894439318779336
- Oliver, M. B., Weaver, J. B., III, & Sargent, S. L. (2000). An examination of factors related to sex differences in enjoyment of sad films. Journal of Broadcasting & Electronic Media, 44(2), 282–300. doi:10.1207/s15506878jobem4402_8
- Pratto, F., & John, O. P. (1991). Automatic vigilance: The attention-grabbing power of negative social information. Journal of Personalit y and Social Psychology, 61(3), 380–391. doi:10.1037/0022-3514.61.3.380
- Rozin, P., & Royzman, E. B. (2001). Negativity bias, negativity dominance, and contagion. Personality and Social Psychology Review, 5(4), 296–320. doi:10.1207/S15327957PSPR0504_2
- Sen, S., & Lerman, D. (2007). Why are you telling me this? An examination into negative consumer reviews on the Web. Journal of Interactive Marketing, 21(4), 76–94. doi:10.1002/dir.20090
- SensoMotoric Instruments. (2014). BeGaze manual. Boston, MA: Author.
- Shedlosky-Shoemaker, R., Costabile, K. A., DeLuca, H. K., & Arkin, R. M. (2011). The social experience of entertainment media: Effects of others’ evaluations on our experience. Journal of Media Psychology, 23(3), 111–121. doi:10.1027/1864-1105/a000042
- Trussler, M., & Soroka, S. (2014). Consumer demand for cynical and negative news frames. The International Journal of Press/Politics, 19(3), 360–379. doi:10.1177/1940161214524832
- Waddell, T. F., & Sundar, S. S. (2017). #thisshowsucks! The overpowering influence of negative social media comments on television viewers. Journal of Broadcasting & Electronic Media, 61(2), 393–409. doi:10.1080/08838151.2017.1309414
- Walther, J. B., DeAndrea, D., Kim, J., & Anthony, J. C. (2010). The influence of online comments on perceptions of antimarijuana public service announcements on YouTube. Human Communication Research, 36(4), 469–492. doi:10.1111/j.1468-2958.2010.01384.x
- Wilson, T. D., Aronson, E., & Carlsmith, K. (2010). The art of laboratory experimentation. In S. T. Fiske, D. T. Gilbert, & G. Lindzey (Eds.), Handbook of social psychology (pp. 51–81). Hoboken, New Jersey: John Wiley & Sons, Inc.
- Winter, S., Krämer, N. C., Benninghoff, B., & Gallus, C. (2018). Shared entertainment, shared opinions: The influence of social TV comments on the evaluation of talent shows. Journal of Broadcasting & Electronic Media, 62(1), 21–37. doi:10.1080/08838151.2017.1402903
- Wirth, W., Hofer, M., & Schramm, H. (2012). Beyond pleasure: Exploring the eudaimonic entertainment experience. Human Communication Research, 38(4), 406–428. doi:10.1111/j.1468-2958.2012.01434.x