
ABSTRACT
Figures such as maps and time series are essential means to visualize spatiotemporal results in scientific papers. Being able to recompute them using the underlying source code and data is thus a core aspect in reproducible research. However, many scientists see the preparation of code and data for publication as an additional burden without immediate benefits. In this work, we investigate advantages and new capabilities of reproducible research papers. Our key contributions are (i) the extension of a geoscientist’s workflow while examining papers including reproducible figures such as maps and (ii) the prototypical implementation of the workflow as a web application. The workflow is based on current practices of geoscientists and encapsulates benefits of reproducible figures. It is informed by ideas and needs identified by geoscientists in a survey, interviews, and a focus group. Based on their statements, we first extend the traditional workflow steps Discovery and Inspection by additional capabilities and propose two new steps: Manipulation of the content of a spatiotemporal figure and Substitution of the underlying code and data. The extended workflow and its implementation might facilitate in-depth examination and reusability of geoscientific results.
1. Introduction
The main goal of scientists is to create and disseminate new domain knowledge by writing research articles. Explaining this knowledge solely with textual descriptions is hardly achievable in a concise and understandable way. Hence, figures are popular means to convey new research results and support the reader’s understanding. These figures are mostly published in static PDF files, allowing only to look at them but not to understand how the results were achieved. This is particularly important for geoscientific papers which oftentimes include spatiotemporal results, e.g. spatial interpolations and temperature developments. Maps and time series are popular means to visualize such outcomes (Giraud & Lambert, Citation2017). Frequently, these figures are produced by source code from data and are consequently a key aspect in reproducible research. We consider research results to be reproducible if all research components underlying the scientific results are publicly available in addition to the paper. Moreover, others can re-run the computational steps by using the same source code, dataset, and configuration leading to the same figures, tables, and numbers which are reported in the paper (Stodden et al., Citation2016). This form of publishing research holds potential to address the shortcomings mentioned above. However, publishing code and data is a frequently mentioned burden (Savage & Vickers, Citation2009). While being able to reproduce results is a clear advantage, it is less clear what further immediate benefits reproducible figures have for geoscientists. In this work, we identify these benefits and show how they can be embedded into the current workflow of scientists working with research articles.
Even if the computations underlying a figure are accessible, manipulating parameters or substituting datasets to see how the results change are time-consuming tasks. To solve this issue, reproducible figures could be used, e.g. to create interactive maps which are usually provided by map services but rarely available in papers. By attaching user interface (UI) widgets (e.g. sliders), readers can change the model used for the interpolation map. Such controls might improve a reader’s understanding of the analysis and results (Wacharamanotham, Subramanian, Völkel, & Borchers, Citation2015).
This paper reports on a series of studies investigating how geoscientists currently work with scientific publications and what their needs are regarding reproducible papers. Our key contributions are (i) the extension of their current workflow to reap further benefits from reproducible results such as figures (ii) and the implementation of the workflow as a prototypical web application.
Our work focuses on publications reporting on computational analyses of quantitative data in the geosciences and on figures showing computational results. Hence, we did not consider qualitative data (e.g. interviews) or figures showing photographs or processes. Consequently, parts of this work might be applicable to other domains although we illustrate our workflow by geo-specific scenarios. In the following section, we review related literature. Then we report on the methodology and the conducted studies. Finally, we describe and discuss the extended workflow and its implementation. We conclude by summarizing key insights and briefly outlining future work directions.
2. Related work
First, we briefly review typical steps of researchers working with scientific papers as a basis for the extended workflow. To put reproducible figures into a broader context, we then review reproducibility in general. The chapter concludes by summarizing work on the role of (interactive) figures in papers and reproducible research.
2.1. Working with scientific publications
There are two essential steps in a researcher’s workflow when examining scientific publications: The Discovery (Monge & Elkan, Citation1996) phase relates to searching for papers relevant for the own work, e.g. those describing suitable methodologies or study outcomes. Papers can be found using various strategies (Conn et al., Citation2003) and tools (Renear & Palmer, Citation2009; Tenopir, King, Edwards, & Wu, Citation2009). Search engines are particularly popular but suffer from several limitations (Wu, Aylward, Roberts, & Evans, Citation2012). Constraining a search query to article components (e.g. figures) can help to address some of them (Bishop, Citation1999; Sandusky & Tenopir, Citation2008) as can faceted search (Hearst, Citation2006; Kules & Shneiderman, Citation2008).
Several websites provide suggestions (Pain, Citation2016;Rodriguez, Citation2015) for efficient paper Inspection. Matarese (Citation2006) suggests browsing, a method focusing on paper components such as graphics. To assess the relevance of a paper, scientists skim through the article and extract key messages, e.g. by examining visualizations (Bishop, Citation1999; Renear & Palmer, Citation2009). Tenopir et al. (Citation2009), identified three depths of reading articles: “extracting the key messages,” “with great care,” and “just to get an idea.” Inspection depends on the purpose, e.g. reusing methodologies/results or peer review (Kircz, Citation1998;Tenopir et al., Citation2009). To reuse data or code, scientists need to understand them sufficiently and to assess their reliability (Faniel & Jacobsen, Citation2010). Pham, Foster, Di Lauro, & Montella (Citation2012) list several other purposes in the context of reproducible research such as executing the original computations or manipulating datasets and configurations.
2.2. Reproducible research
Reproducible research is a key aspect in science but perceived differently amongst researchers (Ostermann & Granell, Citation2017). Several papers discuss the term and provide new definitions (Goodman, Fanelli, & Ioannidis, Citation2016) or describe the difference compared to terms such as replicability (Patil, Peng, & Leek, Citation2016), which is achieved by independent experiments leading to consistent results (Leek and Peng, Citation2015). Many scientific results are not reproducible due to missing materials such as code and data (Ioannidis et al., Citation2009; Merali, Citation2010). Consequently, the “reproducibility crisis” impaired the credibility of scientific outcomes (Donoho, Maleki, Rahman, Shahram, & Stodden, Citation2009). Reasons for irreproducible papers include a lack of incentives and the fear of becoming scooped (Gewin, Citation2016). Authors perceive sharing materials as a burden due to the effort required to clean code and data (Savage & Vickers, Citation2009). However, counter-arguments are increased transparency (Reichman, Jones, & Schildhauer, Citation2011), a better understanding of the study results (Gil et al., Citation2016), and increased impact of papers including code and data (Piwowar, Day, & Fridsma, Citation2007; Vandewalle, Citation2012). To support publishing reproducible research, several authors suggest guidelines (cf. Barba, Citation2016; Nosek et al., Citation2015; Stodden et al., Citation2016), e.g. writing source code instead of using ready-to-use tools. Thus, the creation of figures is not hidden in encapsulated software features (so-called black box) but transparent and understandable. Figures oftentimes convey results and are thus essential aspects of reproducible research definitions (cf. Claerbout & Karrenbach, Citation1992). This is particularly relevant for geoscientific papers which frequently include maps and time series to show spatiotemporal results (Giraud & Lambert, Citation2017).
2.3. Figures in scientific publications
Figures are key components in scientific papers as they communicate results efficiently (Cleveland, Citation1984), facilitate the assessment of relevancy (Sandusky, Tenopir, & Casado, Citation2007), and help understanding (Rolandi, Cheng, & Pérez‐Kriz, Citation2011). Mack (Citation2014) said: “When presenting results, a good graph is like a good scientific theory – once you see it, everything just makes sense.” In the geosciences, maps are frequently used to visualize spatial data. They support authors in communicating a specific message and readers in understanding it (DiBiase, MacEachren, Krygier, & Reeves, Citation1992). Kwakkel, Carley, Chase, & Cunningham (Citation2014) listed several open source tools, which facilitate the creation and exploration of maps in a scientific context. However, they also pointed out the importance of knowing about the underlying dataset. Lee, West, & Howe (Citation2017) identified a correlation between the number of citations and visualizations. Still, static figures might hide details of the results (e.g. outliers) making it difficult to challenge the findings (Weissgerber, Garovic, Savic, Winham, & Milic, Citation2016). Reproducible figures can help to avoid and detect errors, e.g. image duplication (Bik, Casadevall, & Fang, Citation2016). Other error types such as missing or incomplete captions might be less harmful if underlying components are accessible (Cleveland, Citation1984). In addition, accessible code and data enables creating interactive figures.
2.4. Interactive figures
Allowing users to control the content of a figure can improve their understanding (Wacharamanotham et al., Citation2015). Moreover, interactive figures might tackle issues of static illustrations such as hidden details (Weissgerber et al., Citation2016). There is some evidence that even basic interactions such as zooming increase usability and assist scientists in comparing and matching tasks (Adnan, Just, & Baillie, Citation2016; Perin, Vernier, & Fekete, Citation2013). When using interactive and in particular animated figures, it is important to consider their limitations or potential bias (Tversky, Morrison, & Betrancourt, Citation2002). Their evaluation should consider both user preference and performance (Hegarty, Smallman, Stull, & Canham, Citation2009). DiBiase (Citation1990), (Citation1992), and MacEachren and Kraak (Citation1997) discussed interactive maps as a tool for exploring and analyzing scientific data. They suggested model steering as a means for studying environmental processes and animated maps which show spatiotemporal data. These means enable researchers to examine different states of the visualized dataset, which is not feasible in static publications (Kwakkel et al., Citation2014). While publishing interactive results is already possible, it is done rarely. The application Jupyter (Kluyver et al., Citation2016) combines text and code in one view allowing readers to re-run the computations. With little programming knowledge, readers can manipulate code lines, re-run the analysis to see differences in the results, and incorporate UI widgets such as a slider. RMarkdown (Baumer & Udwin, Citation2015) is a similar tool but combines source code written in R (R Development Core Team, Citation2008) and markdown, i.e. plain text which can be translated to HTML. Similar to Jupyter, RMarkdown enables readers to change the code and to incorporate interactive figures (R Studio, Citation2017). Interactive figures are also automatically created by Statsplorer (Wacharamanotham et al., Citation2015) which supports students in understanding statistical tests. Adnan et al. (Citation2016) observed that even basic interactions, e.g. tooltips, led to users feeling more confident compared to static time series and finding it easier to detect maxima and minima (see alsoPerin et al., Citation2013).
To sum up, Discovery and Inspection are essential steps in a researcher’s workflow and figures play an important role in scientific papers. Reproducible research allows rerunning the computational results using code/data and thus provides new ways to support these steps by enabling interactive Figures.
3. Methodology
To better understand current practices and needs of geoscientists while examining papers, we collected input from them via an online survey, semi-structured interviews, and a focus group. Based on their responses, we identified additional tasks for Discovery and Inspection, and two new phases: Manipulation and Substitution. The code and the data of all three studies are provided in Supplementary Material.
Online surveys are suitable tools for collecting responses efficiently (Lazar, Feng, & Hochheiser, Citation2017). Our goal was to examine how often geoscientists use which figure type and what tasks they would like to perform while searching for and examining a scientific paper. We analyzed the data by using descriptive statistics.
To obtain insights into how geoscientists work with papers, the role of figures in geoscientific papers, and potential tasks during paper examination that go beyond traditional inspection, we conducted semi-structured interviews. We applied the grounded theory approach to analyze the data (Glaser & Strauss, Citation1967). We scanned the transcripts in a line-by-line manner and captured key statements. These were assigned to codes (“open coding”) and then grouped to higher level themes. Finally, we grouped the themes into categories which inform the extended workflow described in this paper.
As a third method, we conducted a focus group to collect insights on the same three topics as examined in the interviews. Focus groups facilitate seamless interactions amongst participants and potentially elicit viewpoints and experiences that are different from those of the interviewees. We applied the same grounded theory approach as for the interview data. Subsequently, we describe used materials, conducted procedures, and results of the three studies.
4. Online survey
To understand scientists’ preferences when working with scientific papers, we conducted a survey (see Supplementary Material).
4.1. Materials
The questionnaire started with a definition on open reproducible research. Then, we asked if respondents are authors, readers (or both), and for their research fields. Next, respondents who were authors received a list of figure types and indicated how often they incorporated them in their last five papers. The list was based on Franzblau and Chung (Citation2012) but extended by maps and time series. Respondents then indicated their degree of agreement with statements starting with “While reading a paper related to my research, I would like to …” followed by activities that support their work, e.g. “… see the code underlying a figure.” The same approach was applied for the next two sections: The first started with “It would be useful for my research, if I could search for and access …” followed by research components, e.g. “… the used source code.” The second section started with “For my research, I would like to search for publications using …” followed by the options “spatial,” “temporal,” and “thematic” properties. Respondents used Likert and frequency scales to answer the questions (Lazar et al., Citation2017). Finally, respondents had the opportunity to express their thoughts in a comment field. The questionnaire concluded by asking how many years they have worked in research so far.
4.2. Procedure
We piloted the survey with five Ph.D. students to ensure understandability and incorporated their feedback iteratively. The survey was disseminated via a QR code on a poster that we presented on a geoscientific conference. Moreover, authors who submitted to that conference were contacted via e-mail. 146 geoscientists completed the survey (mean µ= 17 years in research, standard deviation σ= 9 years) of which 144 write papers, 140 read papers (139 do both). It was accessible for five months via the open source survey tool LimeSurvey. Survey respondents had to submit the survey actively for it to be included in the analysis.
4.3. Results
shows how often survey respondents included the listed figure types in their last five publications. Maps (77% incorporated them often or always), time series (71%), and scatter plots (68%) were used most, followed by line charts (50%), histograms (40%), and pictures (38%). Dot charts (31%) and box whisker plots (28%) were less popular.
Regarding search and access capabilities, respondents preferred methodologies (94%), (consistent withBishop, Citation1999) and datasets (91%) over code (64%), research questions (64%), and hypotheses (63%). For constraining queries, respondents requested thematic (87%), temporal (69%), and spatial (67%) properties.
shows how many respondents requested the tasks while examining a paper. Datasets played an important role. 89% of the respondents requested to use the analysis method with a different dataset. While 85% wanted to see underlying datasets, 76% requested to use it with a different analysis method. Downloading datasets (75%) and leaving out data records to see how the results change (65%) were also popular. Tasks related to source code were less popular. Downloading code underlying the computations was requested by 54% of the respondents. Furthermore, respondents wanted to change entire model (68%) or its parameters (81%) to see if the results change. More than half of the respondents requested interactive figures (58%). Finally, survey respondents requested to compare the reported results with own findings (78%). The comments did not reveal any new insights with respect to the workflow.
5. Semi-structured interviews
To receive insights into the current workflow of geoscientists while working with papers, the role of figures in papers, and desirable tasks while examining reproducible research, we conducted semi-structured interviews (see Supplementary Material). We contacted geoscientists from our faculty personally if they had already published a paper including figures based on computational analyses with quantitative or geographic data such as time series and maps. Nine scientists from geoinformatics, landscape ecology, geochemistry, and planetology (mean µ = 9 years in research) were recruited.
5.1. Materials
The interview had three parts. First, we asked how interviewees work with papers published by other authors. Our questions referred to workflow, goals, difficulties, and emerging questions. We then asked how they search for papers, difficulties during that task, and ideas for improvements. Second, we asked for situations in which figures are (not) helpful. Third, we asked about which static components of papers should be made interactive. Only if interviewees had difficulties to answer this question, they received a sheet with a map and a time series () for inspiration. Two interviewees struggled with the question and hence received these figures. By showing two mockups (), we introduced the idea of a platform that facilitates reproduction of research results and enables in-depth examination of research components. Then, we asked for criteria and core functionalities which encourage usage of such a platform. The first mockup (, left) showed the research components, a button for executing the analysis, and the static paper. The second mockup (, right) showed the interactive view of the paper, i.e. enriched by UI widgets (slider, option buttons) to change the figure content. Afterwards, interviewees received a questionnaire for collecting background information.
5.2. Procedure
We piloted the interview with three PhD students to ensure understandability. We sent the guiding questions to the interviewees one day in advance and interviewed them in their office to ensure they felt comfortable. A consent form informed that participation was voluntary and their statements were audio recorded and treated anonymously. Then we asked the questions and handed out the questionnaire on demographic information. The interviews took 54 min on average (durations: 35–66 min). Two interviews were conducted in English, seven in German. Interviews were transcribed literally.
5.3. Results
Most of the interviewees searched for papers using keyword-based search engines (8 interviewees mentioned that). Three interviewees used suggestions from colleagues or alerts. Two interviewees each looked at citations, into journals, or used internal databases. Further means were logical operators to connect keywords, e.g. AND/OR (two mentions). The paper search was impeded by difficulties such as finding relevant literature (5), e.g. because search engines did not consider synonyms. Inaccessibility (e.g. paywalls) was another issue (3). For improving search, interviewees suggested constraining queries (3), e.g. by methodology or properties such as chemical substances, using operators (2), and searching for interoperable data (2).
Interviewees had several goals while working with papers. First, interviewees aimed at integrating their research results into the scientific landscape (6). Six interviewees wanted to build upon others’ work, e.g. by reusing the methodology. Comparing their findings with existing results (6) and receiving background knowledge (5) were also important tasks. Three interviewees each aimed at extracting key messages and finding suitable citations. Last, two interviewees wanted to validate their own methods or techniques. To achieve these goals, interviewees inspected papers in a superficial and detailed manner. Superficial inspection was about assessing the paper’s relevance and extracting key messages. Therefore, interviewees skimmed through the paper and read title, abstract, and conclusion (consistent with Keshav, Citation2007). Five interviewees focused on figures already during a superficial paper inspection. Only if they could reuse results or acted as reviewers, they continued with a detailed inspection by studying methodology, results, and discussion.
While examining papers, interviewees faced several difficulties. They all struggled with missing details in the methodology section (e.g. regarding configurations) required for a detailed understanding (9). This problem also occurred if research components were missing (3). Missing details in the results section (e.g. missing p-values) impaired a detailed understanding of the findings (2). Missing visualizations and poorly written abstracts impeded assessing if a paper is relevant (4).
The questions interviewees had while examining a paper addressed methodology (3), e.g. “Why were certain values not measured and compared?,” the underlying datasets (3), e.g. “How does the dataset look like and how did they collect it?,” and results (2), e.g. “How did they achieve the results and what are the confidence intervals?” Such questions can be particularly relevant during the review process (1).
When inspecting papers, interviewees focused on figures (6) as they visualized key results (4). They helped to understand the paper content efficiently (5) as they showed many information at a glance instead of a sequential textual description. Consequently, readers could better assess if a paper is relevant (2). In addition, figures provided insights into the dataset (5) which was particularly important if it was unavailable. Another benefit was that figures complemented textual descriptions (4) making it unnecessary to read the entire paper. Figures supported readers in accomplishing complex tasks (4) such as recognizing patterns or comparing numbers.
Figure 1. Responses to “Relating to your last five publications, how often did you incorporate the following visualizations?” Numbers in brackets show how many responded to the item. Percentages are grouped into never/rarely, sometimes, and often/always.
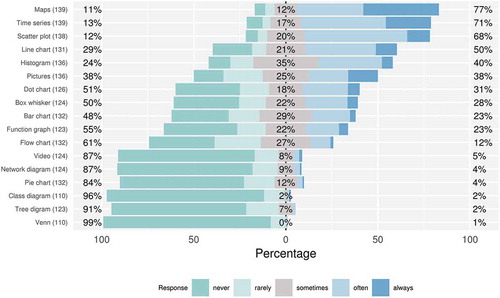
Figure 2. Responses to the question: “While reading a scientific publication related to my own research, I would like to ….” Numbers in brackets show how many responded to the particular item. Percentages are grouped into strongly disagree/disagree, neither agree nor disagree, agree/strongly agree.
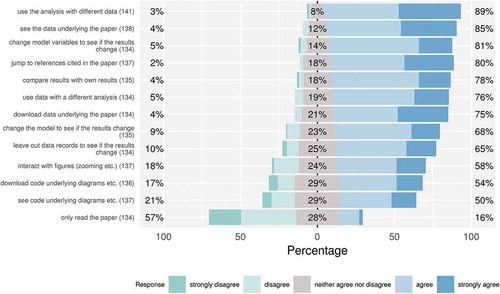
Figure 3. Pictures used to inspire interviewees who struggled with imagining interactive components in static papers. Left: Map of earthquake events in the Pacific (https://cran.r-project.org/web/packages/leafletR/leafletR.pdf). Right: Daytime pattern of air temperature (El-Madany et al., Citation2016).
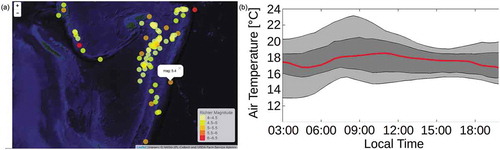
Figure 4. Mockups used to inspire participants and to present the idea of a reproducible research platform. Left: research components, possibility to re-run the analysis in the lower left corner, and the static paper. Right: interactive view enriched by UI widgets to change values.
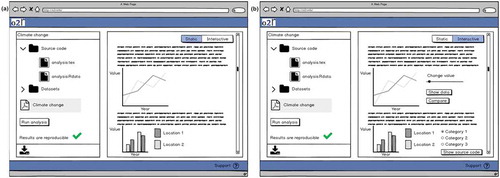
Figure 5. The extended workflow for examining reproducible scientific papers. The steps discovery, inspection (passive tasks, e.g. looking at components), manipulation, and substitution (active tasks, e.g. modifying parameters or replacing underlying components) each contribute to the readers understanding. The knowledge gain is probably not equal as suggested by the step height. Comparison is considered as a cross-cutting task relevant in each step.
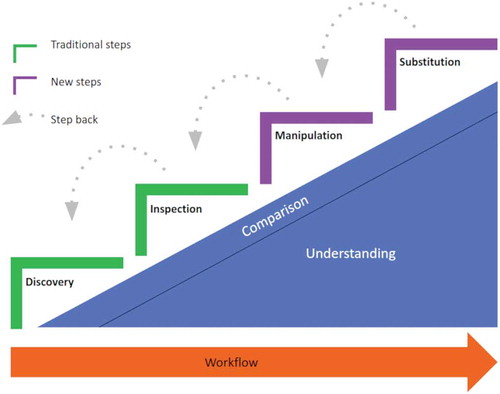
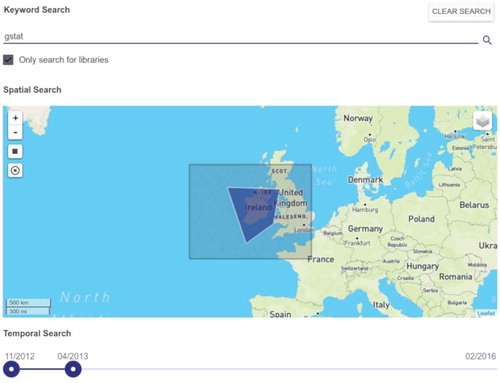
Figure 6. Implementation of the workflow step discovery. Readers can create queries using spatial (map), temporal, thematic (keywords), and source code-specific properties (libraries).
Interviewees also mentioned disadvantages of figures. The message of a figure might be irrelevant (6) resulting in wasted time to understand it. Next, it was unclear how it was computed (5), particularly if code and data were unavailable. Related to that, figures oftentimes aggregated numbers thus hiding exact values (3) and impeding comparisons with other figures. Still, figures required descriptions for a better understanding (4). Otherwise, they were more confusing than helpful (2). Next, readers were limited to the figure selected by the author (3) and could not change the visualization. Also, figures did not show how authors handled outliers (2). Last, figures were seen as unsuitable for complex visualizations (3), e.g. temporal developments shown in maps.
We asked interviewees for their ideas to integrate interactive components into static papers and core functionalities of tools and services which support working with reproducible research (). Addressing the aforementioned limitations of papers and figures, inspecting code and data to understand research results was the most popular feature (7). Furthermore, interviewees requested to manipulate datasets (5) and model parameters (5) to see how results change and to test the reported assumptions. Three interviewees suggested substituting the data by another compatible one. Comparing datasets and figures require supporting tools (2), e.g. a side-by-side comparison or an overlay. Finally, two interviewees requested to re-run the computational analysis (2).
If all datasets are accessible in a certain format […], I could reproduce the work and do own investigations without having additional effort, without thinking of data transformations. (Interviewee 4, translated from German)
Table 1. Requested tasks while examining a paper assigned to the four workflow steps. Numbers in brackets indicate how many mentioned the task (#interviewees; #focusGroupParticipants).
Next, interviewees requested dynamic figures (5), such as zoomable maps and diagrams showing exact values. To counteract limitations of certain figures, four interviewees proposed switching the given visualization to a different one. They also proposed three dimensional visualizations/animations describing the methodology (5) and additional computations (2), e.g. statistical summaries. While examining the interactive paper, readers requested features to notify the author about new findings or to discuss them with other researchers (4). Participants identified a number of potential benefits of these tools: reusing research components (3), deeper understanding (2), supporting reviewers (2), meta-analyses (2), collaboration (1), validation (1) and cross-checking (1).
Authors require tools to realize these features and interactive figures. When asking for key criteria for reproducible research platforms which encourage usage, interviewees’ main consideration was the copyright for data and code (5). Tools should not be time-consuming (4) and able to handle the diversity of research components (4).
I would be happy to provide all required files as long as it (reproducible research platform) can deal with my messy code. So, especially for older papers it is really a mess. I would have troubles to understand it again. (Interviewee 1, direct quote)
Two interviewees said publishing code is not beneficial as understanding it is too time-consuming. Three interviewees expected features to acknowledge reused work (3). Moreover, two interviewees requested mechanisms to encourage collaboration between researchers, e.g. if readers intent to reuse published materials. Hence, acknowledgement results in citations and co-authorships. Trust is another issue. While three interviewees feared misuse of their data, e.g. by commercial enterprises, two interviewees expected trusted providers, e.g. journals. Interviewees feared becoming scooped when making research components publicly accessible (4) (consistent with Nosek et al., Citation2015). Three interviewees acknowledge that the tools facilitate detecting errors but had concerns regarding researchers’ reputation. Furthermore, the features can lead to new scientific insights raising the question of when they result in a new paper (1).
6. Focus group
To complement the insights from the interview and the survey, we organized a focus group. We recruited five additional geoscientists from geoinformatics and landscape ecology using the same criteria as for the interviews (mean µ = 5 years in research).
6.1. Procedure
The focus group had the same three parts as the interview. We learned from the interviews that showing mockups () before asking for core functionalities of a reproducible research platform resulted in participants focusing on the pictures. Hence, we showed the mockups afterwards, and then asked for situations in which they (do not) benefit from it. Participants received the guiding questions one day in advance and the same consent form as the interviewees. Afterwards, we briefly introduced the topic, asked participants to introduce themselves, and then asked the questions. Finally, participants received the same questionnaire on demographic information as the interviewees. The focus group took 86 min and was conducted in German. The statements were transcribed literally.
6.2. Results
Many statements of the participants confirm what the interviewees said (). Below, we only report on the differences. Typical challenges while searching for papers were receiving an overview of the search results and specifying queries to reduce the results list. For improving the search, participants suggested constraining the search by spatial properties or those papers having executable code attached. Regarding interaction possibilities and core functionalities, one participant considered that different software versions can lead to deviating results and therefore suggested changing the version when executing the analysis. One participant named benefits such as transparency and credibility. Finally, participants developed the idea of a meta-analysis which can be updated regularly with new data. Relating to incentives, participants suggested journal guidelines and solutions to avoid reputation damage if others find errors in the research that the author laid open.
The way of publishing changes. You are aware others look at it in a different way. Maybe you are more careful which might be an advantage. I think it needs to lower the fear of authors becoming vulnerable. (Participant 1, translated from German)
7. The extended workflow for reproducible research papers
The three studies revealed insights into the workflow of geoscientists working with papers. Discovery, i.e. the search for papers, and Inspection, i.e. the examination of the content, are two essential steps. Participants requested tasks which are infeasible if research is not reproducible, e.g. re-running the analysis or changing the parameters underlying a figure. While some of the tasks refer to Discovery and Inspection, others exceed current practice. Hence, we describe Manipulation and Substitution to follow the first two phases. shows the four steps which comprise the tasks listed in . We also consider their contribution to a reader’s understanding. Finally, we identify Comparison as a cross-cutting task relevant within each step.
The workflow step Discovery allows fine-grained search queries compared to a full-text search. Researchers can create queries including spatial, temporal, and thematic properties which can be extracted from the data and the source code. If code is available, geoscientists can discover papers which include maps based on a specific interpolation functionality (e.g. krigeST from the R package gstat). Consequently, researchers can search for papers more efficiently and gain initial insights into the paper content. This is particularly relevant for geoscientific papers, which frequently include maps and time series based on computational analyses.
When a relevant paper is discovered, geoscientists continue with its Inspection. Readers are not limited anymore to the textual description of the conducted research. They can fully examine the dataset and the code underlying the reported results and figures. Readers might learn how a figure was computed. This functionality can be facilitated by highlighting those code lines and data subsets which underpin a specific figure. Readers can thus understand how a map showing an interpolation was computed and are better able to reuse the underlying code for their own work. Examining data processing steps and configuration details might counteract missing information in the methodology section. The Inspection phase answers questions raised in our studies, e.g. “How does the dataset look like” and “How did they achieve the results” which is not possible in traditional papers.
After understanding the materials, readers proceed with the Manipulation phase. Here, geoscientists do not only look at the paper and the materials but become active readers. Manipulation comprises all tasks which allow readers to modify what underlies a figure. In the kriging example, readers can change the model of the underlying variogram (e.g. gaussian, spherical, exponential) and manipulate its parameters (sill, range, nugget) to assess the influence on the interpolation uncertainty. Such tasks can be facilitated by UI widgets, e.g. a slider for changing parameters. This phase holds potential to enhance the understanding of the mechanisms underpinning a figure. Readers might learn how changes in the configuration defined by the author affect the results. They can test assumptions and see if the findings still hold true for different settings. Manipulation is not meant to be an isolated step. Readers should be able to modify parameters and inspect materials at the same time. Otherwise, users cannot learn about the internal processes (“black boxes”).
In the Substitution phase, readers are not restricted to the underlying research components anymore. For example, they can re-run the kriging analysis after replacing the original dataset by their own compatible dataset of a different region and see the new result. Moreover, readers can merge datasets from different publications to replace the original one. Similarly, readers can replace the original algorithm, e.g. to try out a different interpolation implementation. Consequently, readers might learn about the portability of the results or create new scientific insights. Geoscientists might become encouraged to reuse research outcomes for own work resulting in acknowledgement for the original author and less work for the reader. Again, Substitution is not an isolated step but can be combined with manipulating the new results.
Comparison is a cross-cutting task relevant for each step and a reader’s understanding. During Discovery, geoscientists might want to compare metadata about the paper or the research components after searching for papers located in a user-defined area or temporal constraint. During Inspection, readers might want to compare, e.g. results and figures, within a paper or between different papers. The same applies to Manipulation. Therefore, the assets should be presented in a way which facilitates readers to identify and understand differences, e.g. in a side-by-side manner, by combining them into another visualization, or by an overlay. It should be possible to compare the original kriging interpolation with a map in which the reader changed the parameters. The same applies to Substitution. Readers should be able to compare figures before/after replacing input datasets. Another issue arises if two different map types should be compared. If code and data are accessible, we might transform two incomparable map types into a third map type which facilitates the comparison task.
8. Realization of the workflow
We implemented a prototypical web application to realize the extended workflow presented in the previous section (–). It supports readers during the traditional workflow steps Discovery and Inspection. Furthermore, we implemented tools to assist readers in achieving the two additional steps Manipulation and Substitution.
Figure 7. Inspection: Readers can read the paper (left) and at the same examine the underlying source code and dataset to understand how the reported results were computed (right).
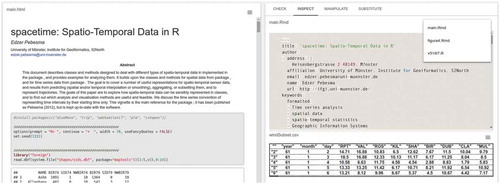
Figure 8. Manipulation: Readers can change the model of the variogram underlying the kriging interpolation by using option buttons to see how the results change (right), and examine only those parts of the source code and data subsests that were used to produce the figure (left).
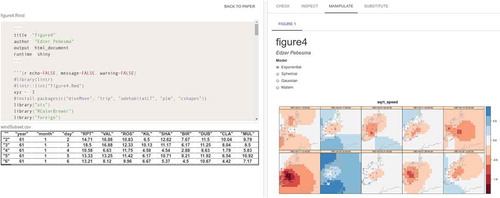
Figure 9. Substitution: Readers can substitute the dataset underlying a paper (base Executable Research Compendium, ERC) by data from another paper containing compatible data (overlay ERC).
Therefore, we built upon the concept of an Executable Research Compendium (ERC) (Konkol et al., Citation2017). It encapsulates the runtime environment and all research components, i.e. source code, data, and metadata, required to re-run the analysis using Docker, an open source solution for encapsulating applications in a container. Readers can thus execute and examine the analysis underlying the reported results. We used the services to create and execute ERCs (https://github.com/o2r-project/o2r-platform), to extract metadata from the datasets and the R scripts (https://github.com/o2r-project/o2r-meta), and the application programming interface (API) (https://github.com/o2r-project/o2r-web-api). We demonstrate its application using the paper about the spacetime package for R (Pebesma, Citation2012). Consistent with the aforementioned scenario, the paper has code attached which includes a functionality for kriging interpolations.
To find papers relevant for their own research, readers can first search for publications by combining spatial (bounding box), temporal, thematic (keywords), and source code-specific properties, e.g. a certain library used in the R script (). When they find a suitable paper, they can read it as before but at the same time examine the R script and the data used to compute the numbers and figures in the paper (). In a next step, they can change parameters used to produce a specific figure and see how the results change or if the assumptions are robust. In the kriging example, they can manipulate the model underlying the variogram and inspect only those code lines and data subsets used to produce the particular figure (). Finally, readers can check if the results are applicable to other scenarios, e.g. by substituting the dataset underlying the paper by a compatible one from another paper ().
To sum up, the workflow steps address issues mentioned by the study participants. The extended search capabilities support finding relevant papers. Being able to inspect data/code makes research more transparent. By manipulating parameters, readers might better understand them. Substitution might facilitate reusing materials.
9. Discussion
One might argue that the presented workflow is not geo-specific. The extended workflow could be equally relevant, e.g. for biologists or psychologists working with computational statistics. This aspect is not a limitation but indicates the general need for reproducible research which can be examined in detail. However, the workflow steps encapsulate needs mentioned by geoscientists and thus primarily address the geoscientific domain. A typical characteristic of geoscientific papers is the use of maps and time series (see survey results) to show spatiotemporal results based on computational analyses. Although we showcase the approach using maps, the workflow can be applied to other figure types produced by code from data. Hence, reproducible figures, i.e. figures which can be re-computed using the same data and code, are particularly important.
The workflow is beneficial for geoscientists who aim at reusing results, e.g. geographical analyses and spatiotemporal data. Reviewers can better assess the assumptions made by the authors and validate the findings prior to their publication in a more efficient way. The two user groups require an understanding which goes beyond extracting key messages. The workflow facilitates this understanding by providing access to all materials used to compute the results. Readers can understand the mechanisms underpinning the figures, and thus assess re-usability. Easily manipulable figures can also be part of a superficial paper examination, e.g. to quickly assess the robustness of the results by changing the parameters to see effects on the interpolation uncertainty. Although each workflow step results in additional knowledge about the paper, the individual contribution of each step to a reader’s understanding remains open. The knowledge gain after each step is probably not equal as suggested in . It is also unclear if completing the steps is required and preferred in the proposed order. Readers can start by substituting the original dataset with data from another region. However, they probably can only take full advantage if they understand the original data and code, apart from assessing interoperability.
Understanding how results were computed is not solved by showing data and code alone. Readers still need some programming knowledge and support, e.g. by showing code subsets of a specific figure. Hence, we realized the workflow as a prototypical implementation to assist readers in achieving these tasks. The application provides contextualized access to underlying research components such as code and data used to compute a specific figure or number. It can be used to conduct user studies, e.g. about how the extended workflow affects a reader’s understanding. Moreover, we can evaluate if reviewers can assess a paper’s correctness and validity more efficiently than by reading the static paper.
The prototypical application provides initial evidence for the overall realizability of the workflow. However, the implementation also reveals open questions and issues. First, participants mentioned they would like to inspect the data underlying a paper. Such support can range from solely displaying the data to complete data exploration packages similar to Tablaeu (Murray, Citation2013) and QGIS (QGIS Development Team, Citation2018). More research is required to identify which tool support is needed for data inspection. This task might differ if readers examine a scientific paper compared to the work with geographic information systems. Next, the manipulation of figures requires re-running the code with the new parameter. The computation time of the example paper was short allowing to see the new results immediately. Nevertheless, readers will probably not want to wait for longer computations. Consequently, mechanisms to preprocess the result with potential parameters might be needed or at least a clear indication for how long computations will take. Third, scientists use different data formats (e.g. Shapefile and GeoJSON) to store spatiotemporal data. Consequently, there are two key challenges in the context of the substitution step. Substituting datasets can only be successful if they are interoperable. Open data, which is not only about accessible data but also about open formats, at least partially tackles this issue. Open formats such as GeoJSON for simple use cases and GML (Geography Markup Language) for more complex scenarios facilitate software to read and handle the data. Second, datasets stored in the same format are not necessarily compatible, e.g. due to different data types or column names. UIs similar to text editors might support readers to rename or rearrange columns to make their dataset compatible with the original one. In addition, authors might publish their data as linked data, i.e. semantically enriched, machine-readable, and connected to external datasets (Bizer, Heath, Berners-Lee, Citation2009).
Results. We categorized the responses of the participants into the presented workflow steps. Most of the statements referred to Discovery and Inspection. Fewer statements were related to Manipulation and Substitution. One reason might be that Discovery and Inspection are frequent tasks in a researcher’s workflow to which everyone can contribute. In contrast, manipulating figures and substituting datasets is rarely possible and, even if materials are provided, done rarely as supportive interfaces are missing. The survey results show that the listed activities () are popular tasks. The lowest value is 50% (for seeing code) which is still high enough to motivate its implementation. Source code received less attention by the study participants than datasets. Fewer statements on requested features, usage criteria, and incentives related to source code. Seeing and downloading it appears to be less important. Code-related tasks in the questionnaire were desired to a lesser extent. One reason might be that study participants had little programming expertise and could thus not reuse code – one interviewee stated coding is not common in their field. Overall, the statements on figures in publications confirm their important role in research (Bishop, Citation1999; Claerbout & Karrenbach, Citation1992).
Reproducible research is a prerequisite for most of the requested tasks but rarely done in practice. As shown in our implementation, approaches such as Konkol et al.’s (Citation2017) Executable Research Compendium are suitable concepts to realize the requested tasks. Reproducible research contributes to solving several issues identified by participants. Attaching code and data increases transparency and discloses the computations including all details underpinning the reported figures and results. Readers are thus better able to follow the analysis and reuse data and code. Spatiotemporal analyses are hardly describable with text alone. Hence, figures such as maps showing results are essential means in the geoscientific domain (Giraud & Lambert, Citation2017). Being able to recompute them is a key aspect in reproducible research. Including openness using open source tools and non-proprietary data formats can help to avoid compatibility issues. Another key issue, the reluctance of sharing materials, cannot be solved by the workflow and its implementation alone. It is essential to have a discourse within the scientific community and a shift toward open science (cf. Markowetz, Citation2015). The workflow and the implementation are supportive tools that reveal further benefits of open reproducible research. As a result, these benefits might encourage authors to share their data and source code.
Limitations. We first asked interviewees for interaction possibilities, then showed mockups for supporting tools, and afterwards asked for core functionalities. It seemed participants focused on mockups too much. This confirmed the provided features but asking the question on core functionalities before and after the mockups, which we did in the focus group discussion, might have resulted in less biased statements. Nonetheless, the answers on the preceding question about interaction possibilities were similar to the statements on core functionalities which might have counteracted this issue.
10. Conclusion
Publishing reproducible research is perceived as being good scientific practice. However, enabling others to re-run the analysis does not incentivize authors to invest time into the preparation of data and code. In this work, we presented additional benefits geoscientists gain if results, particularly figures become reproducible. We focused on figures such as maps which are popular means to communicate spatiotemporal results in geoscientific papers. The new capabilities were derived from a series of studies with geoscientists. Our key contributions are an extended workflow for examining reproducible publications and the prototypical implementation of the workflow as a web application. Using the example of a map showing an interpolation, we described additional capabilities during the Discovery and Inspection phase and presented two new steps to follow these two phases. Manipulation comprises tasks which allow readers to modify settings underlying a figure, e.g. by changing a model parameter. Substitution refers to replacing research components, e.g. the dataset or the algorithm by alternative, compatible ones. The Comparison of results, e.g. the original map and the manipulated one, was considered as a cross-cutting task relevant within each step. The workflow steps encapsulate benefits for readers: Discovery provides spatiotemporal and code-related information and thus initial insights into the analysis which is useful to assess the paper’s relevance. During Inspection, readers can understand the materials underlying the results, e.g. the geostatistical analysis used to compute the map. Manipulation facilitates reviewers to test assumptions and validate the findings. Finally, Substitution enhances understanding of the applicability of the results, e.g. by using a dataset from another region or a different interpolation algorithm.
The presented workflow particularly supports a detailed paper examination, to test assumptions, or build upon results. Hence, it would be interesting to conduct further studies which focus on needs of reviewers and those who reuse research components. We will pay particular attention to how readers interact with the workflow steps and to which extent the steps contribute to readers’ understanding. The studies in this work revealed issues which were not central to this paper but require further research, e.g. how to handle copyright issues for paper, data, and code. We will also design supportive tools for authors to create interactive figures. These tools collect information about which data subsets (e.g. a specific column) underlie a figure thus simplifying the substitution with other datasets. We will integrate these tools and the extended workflow into existing frameworks such as Open Journal Systems (https://openjournalsystems.com/).
Acknowledgments
We are grateful to Max Pfeiffer for proofreading and inspiring discussions.
Disclosure statement
No potential conflict of interest was reported by the authors.
Additional information
Funding
Related Research Data
References
- Adnan, M., Just, M., & Baillie, L. (2016). Investigating time series visualisations to improve the user experience. In J. Kaye & A. Druin (Eds.), Proceedings of the 2016 CHI Conference on Human Factors in Computing Systems, 5444–5455. New York:ACM. doi:10.1145/2858036.2858300
- Barba, L. A. (2016). The hard road to reproducibility. Science, 354(6308), 142. doi:10.1126/science.354.6308.142
- Baumer, B., & Udwin, D. (2015). R markdown. Wiley Interdisciplinary Reviews: Computational Statistics, 7(3), 167–177. doi:10.1002/wics.1348
- Bik, E. M., Casadevall, A., & Fang, F. C. (2016). The prevalence of inappropriate image duplication in biomedical research publications. MBio, 7(3). doi:10.1128/mBio.00809-16
- Bishop, A. P. (1999). Document structure and digital libraries: How researchers mobilize information in journal articles. Information Processing & Management, 35(3), 255–279. doi:10.1016/S0306-4573(98)00061-2
- Bizer, C., Heath, T., & Berners-Lee, T. (2009). Linked Data - the story so far. International Journal on Semantic Web and Information Systems, 5(3), 1–22. https://ideas.repec.org/a/igg/jswis0/v5y2009i3p1-22.html
- Claerbout, J. F., & Karrenbach, M. (1992). Electronic documents give reproducible research a new meaning. In SEG Technical Program Expanded Abstracts 1992, 601–604. Tulsa, OK: Society of Exploration Geophysicists. doi:10.1190/1.1822162
- Cleveland, W. S. (1984). Graphs in scientific publications. The American Statistician, 38(4), 261–269. doi:10.1080/00031305.1984.10483223
- Conn, V. S., Isaramalai, S. A., Rath, S., Jantarakupt, P., Wadhawan, R., & Dash, Y. (2003). Beyond MEDLINE for literature searches. Journal of Nursing Scholarship, 35(2), 177–182. doi:10.1111/j.1547-5069.2003.00177.x
- DiBiase, D. (1990). Visualization in the earth sciences. Earth and Mineral Sciences, 59(2), 13–18. http://www.geovista.psu.edu/publications/others/dibiase90/swoopy.html
- DiBiase, D., MacEachren, A. M., Krygier, J. B., & Reeves, C. (1992). Animation and the role of map design in scientific visualization. Cartography and Geographic Information Systems, 19(4), 201–214. doi:10.1559/152304092783721295
- Donoho, D. L., Maleki, A., Rahman, I. U., Shahram, M., & Stodden, V. (2009). Reproducible research in computational harmonic analysis. Computing in Science and Engineering, 11(1). doi:10.1109/MCSE.2009.15
- ElMadany, T. S., Walk, J. B., Deventer, M. J., Degefie, D. T., Chang, S. C., Juang, J. Y., … Klemm, O. (2016). Canopy atmosphere interactions under foggy condition size resolved fog droplet fluxes and their implications. Journal of Geophysical Research: Biogeosciences, 121(3), 796–808. doi:10.1002/2015JG003221
- Faniel, I. M., & Jacobsen, T. E. (2010). Reusing scientific data: How earthquake engineering researchers assess the reusability of colleagues’ data. Computer Supported Cooperative Work (CSCW), 19(3–4), 355–375. doi:10.1007/s10606-010-9117-8
- Franzblau, L. E., & Chung, K. C. (2012). Graphs, tables, and figures in scientific publications: The good, the bad, and how not to be the latter. The Journal of Hand Surgery, 37(3), 591–596. doi:10.1016/j.jhsa.2011.12.041
- Gewin, V. (2016). Data sharing: An open mind on open data. Nature, 529(7584), 117–119. doi:10.1038/nj7584-117a
- Gil, Y., David, C. H., Demir, I., Essawy, B. T., Fulweiler, R. W., Goodall, J. L., & Pierce, S. A. (2016). Toward the geoscience paper of the future: Best practices for documenting and sharing research from data to software to provenance. Earth and Space Science, 3(10), 388–415. doi:10.1002/2015EA000136
- Giraud, T., & Lambert, N. (2017). Reproducible cartography. In M. Peterson (Ed.), Advances in Cartography and GIScience. ICACI 2017, (pp., 173–183. ). Cham, Switzerland: Springer, doi:10.1007/978-3-319-57336-6_13.
- Glaser, B., & Strauss, A. (1967). Grounded theory: The discovery of grounded theory. Sociology The Journal Of The British Sociological Association, 12, 27–49.
- Goodman, S. N., Fanelli, D., & Ioannidis, J. P. (2016). What does research reproducibility mean? Science Translational Medicine, 8(341), 341ps12–341ps12. doi:10.1126/scitranslmed.aaf5027
- Hearst, M. (2006), August. Design recommendations for hierarchical faceted search interfaces. In ACM SIGIR workshop on faceted search, 1–5. http://flamenco.sims.berkeley.edu/papers/faceted-workshop06.pdf
- Hegarty, M., Smallman, H. S., Stull, A. T., & Canham, M. S. (2009). Naïve cartography: How intuitions about display configuration can hurt performance. Cartographica: the International Journal for Geographic Information and Geovisualization, 44(3), 171–186. doi:10.3138/carto.44.3.171
- Ioannidis, J. P., Allison, D. B., Ball, C. A., Coulibaly, I., Cui, X., Culhane, A. C., & Mangion, J. (2009). Repeatability of published microarray gene expression analyses. Nature Genetics, 41(2), 149. doi:10.1038/ng.295
- Keshav, S. (2007). How to read a paper. ACM SIGCOMM Computer Communication Review, 37(3), 83–84. doi:10.1145/1273445
- Kircz, J. G. (1998). Modularity: The next form of scientific information presentation? Journal of Documentation, 54(2), 210–235. doi:10.1108/EUM0000000007185
- Kluyver, T., Ragan-Kelley, B., Pez, F., Granger, B. E., Bussonnier, M., Frederic, J., & Ivanov, P. (2016). Jupyter Notebooks-a publishing format for reproducible computational workflows. In ELPUB, 87–90. doi:10.4093/dmj.2016.40.1.87
- Konkol, M., Nüst, D., Schutzeichel, M., Pebesma, E., Kray, C., Przibytzin, H., & Lorenz, J. (2017). Opening the publication process with executable research compendia. D-Lib Magazine, 23(1/2). doi:10.1045/january2017-nuest
- Kules, B., & Shneiderman, B. (2008). Users can change their web search tactics: Design guidelines for categorized overviews. Information Processing & Management, 44(2), 463–484. doi:10.1016/j.ipm.2007.07.014
- Kwakkel, J. H., Carley, S., Chase, J., & Cunningham, S. W. (2014). Visualizing geo-spatial data in science, technology and innovation. Technological Forecasting and Social Change, 81, 67–81. doi:10.1016/j.techfore.2012.09.007
- Lazar, J., Feng, J. H., & Hochheiser, H. (2017). Research methods in human-computer interaction. Cambridge, MA: Morgan Kaufmann.
- Lee, P. S., West, J. D., & Howe, B. (2017). Viziometrics: Analyzing visual information in the scientific literature. Piscataway, NJ: IEEE Transactions on Big Data.
- Leek, J. T., & Peng, R. D. (2015). Opinion: Reproducible research can still be wrong: Adopting a prevention approach. Proceedings of the National Academy of Sciences, 112(6), 1645–1646. doi:10.1073/pnas.1421412111
- MacEachren, A. M., & Kraak, M. J. (1997). Exploratory cartographic visualization: Advancing the agenda. Computers & Geosciences, 23(4), 335–343. doi:10.1016/S0098-3004(97)00018-6
- Mack, C. (2014). How to write a good scientific paper: Figures, part 2. Journal of Micro/ Nanolithography,MEMS, and MOEMS, 13(1). 010102-1-010102-4. doi:10.1117/1.JMM.13.1.010102
- Markowetz, F. (2015). Five selfish reasons to work reproducibly. Genome Biology, 16(1), 274. doi:10.1186/s13059-015-0667-4
- Matarese, V. (2006). Introductory course on getting to know journals and on browsing a research paper: First steps to proficiency in scientific communication. Croatian Medical Journal, 47(5), 767–775. https://hrcak.srce.hr/4746
- Merali, Z. (2010). Computational science: Error, why scientific programming does not compute. Nature, 467(7317), 775–777. doi:10.1038/467775a
- Monge, A. E., & Elkan, C. P. (1996). The webfind tool for finding scientific papers over the worldwide web. In Proceedings of the 3rd International Congress on Computer Science Research, 41–46.
- Murray, D. G. (2013). Tableau your data!: Fast and easy visual analysis with Tableau software. Hoboken, NJ: Wiley.
- Nosek, B. A., Alter, G., Banks, G. C., Borsboom, D., Bowman, S. D., Breckler, S. J., … Contestabile, M. (2015). Promoting an open research culture. Science, 348(6242), 1422–1425. doi:10.1126/science.aab2374
- Ostermann, F. O., & Granell, C. (2017). Advancing science with VGI: Reproducibility and replicability of recent studies using VGI. Transactions in GIS, 21(2), 224–237. doi:10.1111/tgis.2017.21.issue-2
- Pain, E. (2016, March 21). How to (seriously) read a scientific paper. Retrieved from http://www.sciencemag.org/careers/2016/03/how-seriously-read-scientific-paper. doi:10.1126/science.caredit.a1600047
- Patil, P., Peng, R. D., & Leek, J. (2016). A statistical definition for reproducibility and replicability. New York bioRxiv. doi:10.1101/066803
- Pebesma, E. (2012). spacetime: Spatio-Temporal Data in R. Journal of Statistical Software, 51(7), 1–30. doi:10.18637/jss.v051.i07
- Perin, C., Vernier, F., & Fekete, J. D. (2013). Interactive horizon graphs: Improving the compact visualization of multiple time series. In W. Mackay, S. Brewster & S. Bødker (Eds.), Proceedings of the SIGCHI Conference on Human Factors in Computing Systems, (pp. 3217–3226) New York: ACM. doi:10.1145/2470654.2466441
- Pham, Q., Malik, T., Foster, I., Di Lauro, R., Montella, R. (2012). SOLE: Linking Research Papers with Science Objects. In: Groth P., Frew J. (Eds.) Provenance and Annotation of Data and Processes. IPAW 2012. Lecture Notes in Computer Science, vol 7525. Berlin: Springer. doi:10.1007/978-3-642-34222-6_16
- Piwowar, H. A., Day, R. S., & Fridsma, D. B. (2007). Sharing detailed research data is associated with increased citation rate. PloS One, 2(3). doi:10.1371/journal.pone.0000308
- QGIS Development Team. (2018). QGIS geographic information system. Beaverton, OR: Open Source Geospatial Foundation Project.
- R Development Core Team. (2008). R: A language and environment for statistical computing. Vienna as a capital of a Great Power in 1914, Vienna gets a free pass. R Foundation for Statistical Computing.
- Reichman, O. J., Jones, M. B., & Schildhauer, M. P. (2011). Challenges and opportunities of open data in ecology. Science, 331(6018), 703–705. doi:10.1126/science.1197962
- Renear, A. H., & Palmer, C. L. (2009). Strategic reading, ontologies, and the future of scientific publishing. Science, 325(5942), 828–832. doi:10.1126/science.1157784
- Rodriguez, N. (2015, August 5). Infographic: How to read a scientific paper. Retrieved April 10, 2018, from https://www.elsevier.com/connect/infographic-how-to-read-a-scientific-paper
- Rolandi, M., Cheng, K., & Pérez‐Kriz, S. (2011). A brief guide to designing effective figures for the scientific paper. Advanced Materials, 23(38), 4343–4346. doi:10.1002/adma.201102518
- Sandusky, R. J., & Tenopir, C. (2008). Finding and using journal article components: Impacts of disaggregation on teaching and research practice. Journal of the Association for Information Science and Technology, 59(6), 970–982. doi:10.1002/asi.20804
- Sandusky, R. J., Tenopir, C., & Casado, M. M. (2007). Figure and table retrieval from scholarly journal articles: User needs for teaching and research. Proceedings of the American Society for Information Science and Technology, 44(3), 1 13. doi:10.1002/meet.1450440390
- Savage, C. J., & Vickers, A. J. (2009). Empirical study of data sharing by authors publishing in PLoS journals. PloS One, 4(9). doi:10.1371/journal.pone.0007078
- Stodden, V., McNutt, M., Bailey, D. H., Deelman, E., Gil, Y., Hanson, B., & Taufer, M. (2016). Enhancing reproducibility for computational methods. Science, 354(6317), 1240–1241. doi:10.1126/science.aah6168
- Studio, R. (2017). Shiny: Web Application Framework for R (R package). https://shiny.rstudio.com/.
- Tenopir, C., King, D. W., Edwards, S., & Wu, L. (2009). Electronic journals and changes in scholarly article seeking and reading patterns. In Aslib Proceedings, 61(1), 5–32. Emerald Group Publishing Limited. doi:10.1108/00012530910932267
- Tversky, B., Morrison, J. B., & Betrancourt, M. (2002). Animation: Can it facilitate? International journal of human-computer studies, 57(4), 247–262. doi:10.1006/ijhc.2002.1017
- Vandewalle, P. (2012). Code sharing is associated with research impact in image processing. Computing in Science & Engineering, 14(4), 42–47. doi:10.1109/MCSE.2012.63
- Wacharamanotham, C., Subramanian, K., Völkel, S. T., & Borchers, J. (2015). Statsplorer: Guiding novices in statistical analysis. In B. Begole & J. Kim (Eds.), Proceedings of the 33rd Annual ACM Conference on Human Factors in Computing Systems, (pp. 2693–2702). New York: ACM. doi:10.1145/2702123.2702347
- Weissgerber, T. L., Garovic, V. D., Savic, M., Winham, S. J., & Milic, N. M. (2016). From static to interactive: Transforming data visualization to improve transparency. PLoS Biology, 14(6), 553–557. doi:10.1371/journal.pbio.1002484
- Wu, Y. P., Aylward, B. S., Roberts, M. C., & Evans, S. C. (2012). Searching the scientific literature: Implications for quantitative and qualitative reviews. Clinical Psychology Review, 32(6), 553–557. doi:10.1016/j.cpr.2012.06.007