
ABSTRACT
We review recent developments in cartographic research in North America, in the context of informing the 29th International Cartographic Conference, and 18th General Assembly in 2019. The titles of papers published since 2015 in four leading cartographic journals yielded a corpus of 245 documents containing 1109 unique terms. These terms were analyzed using Latent Dirichlet Allocation and by visual analytics to produce 14 topic groups that mapped onto five classes. These classes were named as information visualization, cartographic data, spatial analysis and applications, methods and models, and GIScience. The classes were then used as themes to discuss the recent cartographic literature more broadly, first, to review recent trends in the research and to identify research gaps, and second, to examine prospects for new research over the next 20 years. A conclusion draws some broad findings from the review, suggesting that cartographic research in the future will be aimed less at dealing with data, and more at generating insight and knowledge to better inform society about global challenges.
Introduction
During the last decades of the twentieth century, the discipline of cartography experienced a fundamental and sweeping transition from a paper and print-based craft to a computational and algorithmic enterprise of massive scope, a transition that is now complete. Scientific research has continued to play a role beyond the transition, and often through published and peer-reviewed literature. Through this literature we can trace the paths and decision points of progress. At the start of the new millennium, several reviews of the cartographic (and GIScience) literature were made, and new research agendas were proposed (Bevington-Attardi & Rice, Citation2015; MacEachren, Citation1994; McMaster & Usery, Citation2004). In the most recent of these, Griffin, Robinson, and Roth (Citation2017) noted reviews of developments in geovisualization, geovisual analytics, representational techniques, and interaction paradigms. They also note that there remained persistent topics dating from the 2001 review in CaGIS by MacEachren and Kraak (Citation2001).
These research prospects have influenced the direction of cartographic research in the first two decades of the twenty-first century. Cartographic advances include moves toward the Internet, World Wide Web, Global Satellite Navigation Systems, new sensor systems, big data, real-time information, volunteered geographic information, and mobile computing. Since 2001, cartographic research has evolved to realign with these new educational, technical, practical, and social contexts. As the Tokyo 29th International Cartographic Conference, and 18th General Assembly meeting, nears, the question arises again of what new paradigms in cartographic research will seed the technical and intellectual advances over the next 20 years? In this review, we seek to determine which of these threads will carry the discipline of cartography forward for the next two decades and also to illuminate the challenges and prospects at the research frontier.
There is no better bellwether for advances in mapping science than its research community. Ideas presented as innovations today have a way of inspiring and creating new methods, technologies, and approaches in the future. In this review, we examine the titles of papers published in North American English language journals since 2015, both qualitatively and quantitatively. The corpus of cartographic research is classified quantitatively by theme or topic, and each topic is further investigated as first representing a possible research direction for the future of the discipline, and then to explore cutting edge research that is leading the way forward. To conclude, we present a set of unsolved problems and grand challenges that we believe can be both issues and inspirations for an exciting and meaningful role for cartography’s future during the coming years.
The data revolution is an overarching topic that requires more attention in the cartographic research community. Data types such as administrative data, chaotic data from Facebook and Google, and related data captured from daily activities, like credit card transactions, offer new data sources for cartographic use. This is further exacerbated by growing interest in data integration and the results from new data that emerge from that exercise. A good example is the UN Sustainable Development Goals (SDGs: 17 goals, 169 targets, and 232 indicators). Focus currently is on each of the 17 goals, but when the goals, targets, and indicators eventually are cross-referenced, a new view will emerge. The International Cartographic Association (ICA) has been proactive in bringing to light initial benefits of cartographic applications which are uncovering many future opportunities for the SDGs. We apply a similar approach to the published journal paper titles themselves, since they are the embodiment of the research content, intent, and direction.
The corpus
We selected as our data on cartographic research the titles of peer-reviewed research articles published since 2015 in five journals: Cartography and Geographic Information Science; The International Journal of Cartography (for which only one volume was available); Cartographic Perspectives and Cartographica. This resulted in a corpus of 245 documents containing 1109 unique terms after stemming (removal of common link words and multiple word endings). We note the continued importance in cartographic research of the major professional organizations, including the Cartography and Geographic Information Society, the North American Cartographic Information Society, the Canadian Cartographic Association, and the International Cartographic Association. However, compared to two decades ago, their journals are now usually produced by professional publishing houses, rather than being under direct professional society control. For these latter organizations, their journals are seen as one of the strongest bonding elements of the societies, proving that cartographic research papers still have a strong influence on the mapping community.
is a word cloud plotting the unique terms appearing in these peer-reviewed papers, sized according to their frequency of use. Four common terms (maps, map, mapping, using) were eliminated as being self-definitional, but reflecting an ongoing cartographic concern with map use. Common terms include data, approach, analysis, based, spatial, and cartography/cartographic. At a second level, common terms reflecting more specialization are visualization, crime, urban, web, spatiotemporal, and information. Crime and urban are terms representing common examples of applied cartographic research that often use maps and spatial analytic methods.
Figure 1. Word cloud of terms included in 245 cartographic research paper titles 2015–2018.
Themes within the corpus
To provide a structure for this review, we are interested in how these terms naturally group within the corpus, that is, what are the core topics of the dataset. To do this, we used a Latent Dirichlet Allocation (LDA) model (Blei & Lafferty, Citation2007) with parameters derived from prior work. In such a model, the number of topics must be defined a priori so we first ran the model for a number of topics ranging from 2 to 25, computing the harmonic mean of the log-likelihoods to determine the maximum value (optimal fit) (Ponweiser, Citation2012). The maximum value occurred at 14, leading us to use a model that produced 14 groups or “topics.” The training process generates a probability that each unique term and title belongs to 1 of the 14 groups. Upon completion, the 10 terms that had the highest probability of belonging to each group were extracted. Since no term had a 100% probability of belonging to just one group, most words and titles have a probability of belonging to multiples. The words belonging to the most groups (with group frequencies) were data (5); urban (5); spatial (4); based (3); networks (3); interactive (3); accuracy (2); acquisition (2); automated (2); and analytical (2). These overlapping, or common, terms are descriptive of the scope of cartography in general. One of the most common ways of determining “what a topic means” in topic analysis for bodies of text is using the top n terms; the top 5 are given in .
Table 1. The most frequent terms in each of the 14 topic classes.
For convenience, we name each topic by its most frequent term (column “First” in ). This reduced the 245 paper titles to 14 key topics. As noted, the LDA topic model generates the probability that each document belongs to 1 of the 14 topics. We used these probabilities (the probability matrix) to better understand how strongly these topics are related to one another. To determine the best metric for clustering this dataset (245 instances of 14 probability values), we used the agnes function in the R cluster package. Doing so revealed the strongest clustering was produced by using the wards.D2 linkage method and a Euclidean distance metric for hierarchical clustering. A dendrogram of the scaled topic probabilities revealed a set of five clusters emerging at the third tree branching level.
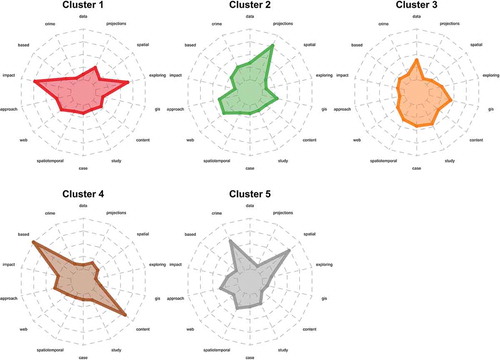
Within each cluster, each topic has a different mean probability of membership. These membership probabilities are plotted for each cluster as radar plots in . Cluster 1 has a focus on impact and explaining. Cluster 2 favors approach, web, and projections; and cluster 3 has GIS, data, spatiotemporal, and case study. Cluster 4 emphasizes content-based approaches, while cluster 5 seems to isolate spatial crime (the topic of a special issue on Crime Mapping in CaGIS, 42, 2).
Figure 2. Radar plots of the LDA probabilities for terms within topic clusters.
These topic descriptors are also visible when word clouds are created for each cluster from the raw titles mapped to each (). As a guiding rule, only words with at least two occurrences were visualized. also reveals how papers are related via their terms and topics. Cluster 1 clearly shows a theme of information visualization, with urban case studies, and of user design and learning. Two of the journals had special issues on cartographic education, and these papers tend to fall within this group. Cluster 2 is smaller, and reflects the common use in cartography of data, now including big data. Cluster 3 is spatial, based, and cartographic and includes web, crime, and spatiotemporal. Cluster 4 is clearly focused on methods and models, with many application-related terms. Last, cluster 5 seems most general, and has the highest degree of overlap with GIScience, with the terms multi and GIS (gis) dominating. For the purposes of the rest of this review, these five clusters will be termed (1) information visualization, (2) cartographic data, (3) spatial analysis and applications, (4) methods and models, and (5) GIScience. Each will be examined in turn in the following sections. The conclusion of the paper is focused on the emerging research issues and future agenda structured around these five themes.
Figure 3. Word clouds for the five topic clusters (showing most frequent 50 words).
Theme 1: information visualization and cartography
The end of the last century saw the emergence of the term “scientific visualization,” in which traditional information graphics – with their long history in “moral statistics,” economics, and mathematics (Playfair, Citation2005) – became more commonly applied to both physical and human data. Human data have also grown substantially with the conversion of the census and other government data to digital form. For physical data, the era of remote sensing and large-scale earth observatories has made the whole planet the area of interest (Yu & Gong, Citation2012). After the turn of the century, 7the increased concern with earth systems monitoring and observation and the clear signal of human-induced global climate change gave such visualizations increased urgency. Earth observation data are growing in interest and popularity, but challenges remain regarding its use and application potential (Nativi et al., Citation2015). Cartographic research is needed to better understand the characteristics of earth observation data and the potential it offers for mapping. Traditionally, cartography was added to or extracted from imagery, but cartography now offers far more than additional conflated layers. In dealing with climate change, what specialties from cartography are needed to better understand the pressures of climate change? Does current cartographic research sufficiently address the challenges of climate change that humanity now faces?
Similarly, the arrival of social media such as Flickr, Twitter, Weibo, and Facebook coupled with accurate geolocated information from cell tracking of mobile phones and embedded global navigation satellite system receivers (GNSS) have brought big social data to cartography (Crampton et al., Citation2013). Similarly, tracking data from GNSS allowed location-based services to provide movement data about individuals, vehicles, ships, and planes (Dow, Neilan, & Rizos, Citation2009). This trend has inverted, as the tracking data take its place among the cluster of technologies supporting autonomous vehicle research and testing. User contributed data, such as OpenStreetmap.org, have added substantially to the background map data (Haklay, Citation2010). The result has been a flourishing of information visualization in cartography (Sui, Citation2004).
How cartography relates exactly to information visualization is reflected in the research literature (Yuan & Stewart, Citation2008). Terms such as cartographic visualization, infoviz, geoviz, and others have been advanced and explored. Meanwhile, the broader scientific community, with help from the National Academies and the Pacific Northwest National Laboratory’s Visual Analytics group, developed the term “Visual Analytics,” defined as: “the science of analytical reasoning facilitated by interactive visual interfaces” (Kielman & Thomas, Citation2009). Both cartography and information visualization fit along with or overlap visual analytics, a multidisciplinary field that includes (1) analytical reasoning techniques that enable users to obtain deep insights that directly support assessment, planning, and decision-making; (2) data representations and transformations that convert all types of conflicting and dynamic data in ways that support visualization and analysis; (3) techniques to support production, presentation, and dissemination of the results of an analysis to communicate information in the appropriate context to a variety of audiences; and (4) visual representations and interaction techniques that take advantage of the human eye’s broad bandwidth pathway into the mind to allow users to see, explore, and understand large amounts of information at once (Kielman & Thomas, Citation2009).
Cartography since Bertin (Citation1967) has been concerned with map perception and the human vision system (Slocum, McMaster, Kessler, & Howard, Citation2009). MacEachren and Kraak (Citation2001) noted that mapping involves both perceptual and cognitive issues, but also the use of semiotics and technology and an orientation toward problem solving. “Both scientific progress and application of geospatial information to societal needs remains hampered, however, due to the lack of methods for transforming these data into information and for combining information from diverse sources to construct knowledge” (MacEachren & Kraak, Citation2001, p. 12). Andrienko et al. (Citation2007) embedded cartography within visual analytics as geovisual analytics, a term that has since gained some traction. The emergence of Visual Analytics has encouraged a new generation of cartographers to embrace mapping and information graphics, but now exclusively though the interactive tools and scripting capabilities of the Internet and web mapping (Haklay, Singleton, & Parker, Citation2008; Peterson, Citation2014).
Theoretical issues of interest to research in information visualization include measuring human responses to maps, the abstract nature of map content, the identification of visual spatial trends and patterns, and the measurement of map information content. Information visualization remains an active field within computer graphics and data mining. Software for mapping and creation of both simple and complex visual information graphics is now commonplace (e.g. Tableau, R-Shiny Leaflet), and the availability of simple programming Application Programming Interface (API) and libraries has democratized cartographic production on the web. Data can now be handled in large amounts, in real time and interactively. Information visualization has seen the insertion of new measurement methods, sensors, and imagery into mapping; the emergence of the “mash-up;” and a rise of software that is open source, allowing scripting for distributed data access to support processing (De Paor & Whitmeyer, Citation2011; Wood, Dykes, Slingsby, & Clarke, Citation2007). Two additions to the suite of methods are (1) spatialization, in which inherently nonspatial data such as text are made spatial and so subject to visual analysis (Skupin & Fabrikant, Citation2003) and (2) the idea of maps as narratives, the creation of maps that tell stories or integrate data into wider information graphics suitable for broad audiences, such as ESRI’s Story Map (Caquard, Citation2011).
Theme 2: cartographic data and mapping
Cartography has long been a discipline concerned with the collection, acquisition, processing, and display of spatial data. The twentieth century vastly expanded upon that data in terms of quantity, timeliness, quality, and structure. Many government agencies have long used the Internet as a tool for open data archiving, distribution, and delivery, and have increasingly made it easy to discover, locate, download, and use geospatial data (NRC, Citation2012). Examples are the Census Data Mapper, The National Map Viewer, and the USGS’s Earth Explorer. We have also seen the evolution of online repositories of data toward clearinghouses to assist access, allowing discovery across agencies such as with geoplatform.gov. In addition, many national and even global datasets are now streamed in real time, or are available to web crawling services so that they can be continuously updated as feeds. An especially useful change has been the ability to access data by extents and geographic units of choice (e.g. counties) rather than the arbitrary units of data collection (e.g. Landsat scenes). Even more general has been the advent of Web Coverage Services, REST APIs, and THREDD servers that allow for the subsetting of spatial data (both vector and raster) by bounding box coordinates via URL requests.
Much more research on cartographic data needs to focus on data quality. Just as users always assumed that a paper map was always correct and accurate, the same blind trust is also assumed about available geospatial data. Social media data, and some sensor data such as LiDAR point clouds, are notoriously messy, incomplete and require extensive preprocessing (Batrinca & Treleaven, Citation2015; Vierling, Citation2008). The historical implementations of metadata ranged from general statements about entire datasets to more defined statements by geography, but oftentimes still remain too generalized. Feature-level (at the feature instance) data quality statements are needed to correctly represent accurate characteristics of data elements. Data quality assurance and the representation of uncertainty on maps remain at the forefront of cartographic research, even after 30 years of effort.
New additions since 2000 include archives of social media data, although often heavily sampled and redacted to protect privacy (Burgess & Bruns, Citation2012). Open data sources can be monitored and updated in real time, to support for example air (e.g. flightaware.com/live/map) and marine traffic (marinetraffic.com). Last, the previous decade has seen the emergence of the “cloud,” the replacement of personally controlled local storage spaces on devices with data access as a service from large-scale providers with astonishing amounts of computing power and storage (Peterson, Citation2014). The availability of such large amounts of storage and immense processing power have allowed formally geographically local data services to go global, or regional and national data to go to higher resolutions (Alvares, Stape, Sentelhas, Goncalves, & Sparovek, Citation2013).
It is also worth noting that the very nature of cartographic data has changed. User contributed data, volunteered geographic information, and “digital exhaust” have become a primary supplier of publicly available spatial data (Jackson et al., Citation2013). In many cases, OpenStreetMap.org is seen as the most accurate and timely source of local street map data, a complete inversion of the trusted and authoritative model that characterized the last century and the principal digital map suppliers (Camponovo & Freundschuh, Citation2014). Added to this is a vast amount of low-cost or free satellite data, available through Google Earth and other geobrowsers, at extraordinary levels of resolution and timeliness. Tools such as Google Earth Engine facilitate not only of access to this data but large-scale analysis and sharing (Gorelick et al., Citation2017).
Theme 3: spatial analysis and applications in cartography
As the methods of spatial analysis have become increasingly sophisticated and more accessible, cartography has sought to incorporate more 3D information (e.g. in digital terrain analysis and LiDAR mapping (Jaboyedoff et al., Citation2012)), but also more 4D, by using animations, small multiples, or user interaction to reveal a time line that allows data to be explored in both time and space. Similarly, geographical research with a long tradition in time–space analysis (e.g. Miller, Citation2017) has yielded cartographic methods to explore time and space together, for example, in the software Geotime (Uncharted Software Inc.) and research on accessibility from trajectories by Kwan (Citation2000). Other research has explored cartographic models for dealing with events, duration, and change in cartographic displays (Chaix et al., Citation2012; MacEachren, Citation1995). Movement to Web tools has enabled the use of dynamic, interactive, and animated tools in mapping to an unprecedented degree. The addition of time lines to tools such as Google Earth has begun the necessary move from 2D to 4D mapping, and this trend is unlikely to end soon. Analysis tools to identify group behavior in trajectories are now beginning to be developed, and pattern- and movement-based syntaxes and semantics are now undergoing research (Gonçalves, Afonso, & Martins, Citation2015). Such analysis and its cartography have generated interest in the analysis of human mobility data, often revealed through social media and high resolution imagery (González, Hidalgo, & Barabási, Citation2008). The US National Academies and the National Geospatial Intelligence Agency are exploring this theme under the topic of Human Geography (NRC Citation2013).
Theme 4: methods and models in cartography
Some themes within cartographic research remain persistent, and among these are research on coordinate systems and global grids, map projections, and cartograms (Maling, Citation1992; Sahr, White, & Kimerling, Citation2003). The ubiquity of positioning by GNSS has made the issue of georegistration – from map to ground, image to ground, map to map, and image to image – of prime concern, and this remains a gray area for many cartographic practitioners. Global grid systems increasingly seek to pursue links between geographical places and locations on the Internet, and the Internet of Things (Taylor & Parsons, Citation2015). Research regarding location-based services continues to pursue these issues, along with the accuracy and uncertainty of location (MacEachren et al., Citation2005). This can include the vagueness associated with place names and place semantics, such as descriptors of position, length, and area. The ontologies associated with the descriptors have become important in research on linked data systems, providing a potentially new place-based rather than position-based method for web search (Janowicz, Scheider, Pehle, & Hart, Citation2012). In addition, cartography has been highly skeptical of the almost universal adoption in web tools and applications of the Web Mercator map projection for mapping applications (Battersby, Finn, Usery, & Yamamoto, Citation2014). Map projections research has recently examined formulae and transformations that can yield entire families of projections rather than single cases, and in merging and adjusting projections to reflect optimal properties of space (Šavrič & Jenny, Citation2014).
There has been an increasing awareness of the map as a valuable model of earth’s surface and properties of its inhabitants. Efforts are currently underway in developing countries to investigate and implement an Integrated Geospatial Information Framework that expands the traditional view of a spatial data infrastructure (stand-alone data themes) and offers a geospatial data ecosystem to help respond to important societal questions for which answers are needed. The National Geospatial Intelligence Agency (NGA) has embarked upon a movement in its capabilities from a map production agency to a user of maps and their integration into decision-making, with the 2016 report From Maps to Models (National Academies, Citation2016). This study notes that maps are components in data fusion in that they are a chief means to relate data by colocation in time and space, and that they provide important inputs for models that can be descriptive, interpretive, predictive, and probabilistic. As such, maps are clearly central components of more complex human decision-making systems.
The convergence of map-base modeling methods such as agent-based models, cellular automata, and multi-criterion decision models are an important link between time, space, and causality and greatly increase the value of maps (Clarke, Citation2014b). This has not gone unnoticed in the emerging field of geospatial data sciences, where maps play the same data fusion role, for example, in marketing, planning, emergency management, public health, and crime analysis. Machine learning and cyberinfrastructure are starting to automate many of the map processing stages for such analyses (Armstrong, Citation2019; Lee & Kang, Citation2015; Yang, Raskin, Goodchild, & Gahegan, Citation2010). With new directives to create a Chief Data Scientist position in every US Federal and many academic organizations, cartographic research needs to identify the cartographic tools and methods that are needed to equip this emerging discipline to be more effective. Two areas that need more attention from the US government at many levels are cybersecurity and geospatial privacy (Andrienko & Andrienko, Citation2012; Iasiello, Citation2013). While the Intelligence Community and Department of Defense have a better handle on this, the civilian side is lagging, dangerously in places – a clear gap for cartographic research.
Theme 5: GIScience
Cartographic research that overlaps with GIScience has in the last 5 years remained concerned with data structures and algorithms, but has also continued to pursue issues surrounding cartographic uncertainty and its measurement and depiction. There remains a concern for map generalization and its automation (Gould & Mackaness, Citation2016), a recurring theme in both cartography and GIS, with the former concentrating on algorithms and the latter on display. There is an increased focus on 3D compared to 2D mapping in the GIScience papers (e.g. Huang, Jiang, & Li, Citation2001), and with issues of data standards, web mapping, search and retrieval, and analysis with social media, user contributed, and sensor network data and information. This might be most evident in the transition for shape file to data frames and geo packages in the data science communities.
A theme of the early twenty-first century research in GIScience has been the emergence of user contributed, crowdsourced, citizen science (Goodchild, Citation2007; See et al., Citation2016), social media, and tracking data. Each new data type presents challenges of both data preparation and conflation and dictates new methods of analysis. New methods have increasingly found their way into GIScience from geostatistics, machine learning, visual analytics, ecology, content analysis, and many other fields. The traditional layer model of GIS, with raster, vector, and object features, is often challenged by the size or nature of the resulting data. Research has sought fundamental underlying primitives for geographical information (Goodchild, Yuan, & Cova, Citation2007). Computational needs, for example in partitioning in support of parallel and high performance computing, have led to GIScience research that expands upon what has been called cyberGIS (Wang, Citation2010; Wang & Goodchild, Citation2018). Tracking data have presented its own new sets of challenges and applications (Gonçalves et al., Citation2015; González et al., Citation2008); yet, human movement data have been shown to have a high degree of both spatial autocorrelation and predictability.
Another thread from cartographic research in GIScience has been the emergence of explorations of new and more rigorous ontologies for geographical features and objects (Varanka, Citation2011; Zhu, Hu, Janowicz, & McKenzie, Citation2016). While so far ontologies have been limited to simple geometric objects such as points and lines, and for features such as those appearing on topographic maps, the intent is to generate logically encodable relations among objects. Such “linked” data hold promise for geospatial web search, but also for data mining and location-based services (Janowicz et al., Citation2010).
The next 20 years
Information visualization and cartography
Part of the rationale behind big data science is that it can reveal patterns and relationships that are invisible to standard scientific methods of statistical analysis, and this is especially true of spatial data (Tsou, Citation2015). There are already some impressive big data cartographic success stories, including large-scale and massive data analysis, meta-analyses, and online systems for discovering structure within large amounts of geospatial data (Katzfuss, Citation2017; Tatem et al., Citation2017). Clearly, the methods of standard statistical analysis will need a major update for the research of the next 20 years. Whereas past statistical methods used data reduction, sampling, and measures of central tendency, new methods can use entire populations, data mining, simulation, and machine learning. Promising technologies are classification techniques, automated data fusion methods, and machine learning methods, including the so-called deep learning (LeCun, Bengio, & Hinton, Citation2015). Common to all these tools is the need to display multivariate and highly varied data to humans for interpretation and visual exploration. While visual and mapping tools have emerged to display such data, many are based on simple graphical and cartographic methods that date back to William Playfair and others from the eighteenth century (Playfair, Citation2005). It is more likely that future methods will automatically process data flows, and alert analysts only when new or unusual patterns emerge.
Many new mapping methods are indeed emerging, not all of them within cartography, that offer new insight into data. Old methods such as flow and dasymetric mapping have taken on new dimensions (Ngidi, Mans, McKelly, & Sogoni, Citation2017; Verbeek, Buchin, & Speckmann, Citation2011). More powerful high performance computers based on cluster and parallel computing and Graphics Processing Units will solve many of the problems of display resolution, display frame rate, base map tiling, and real-time interaction present today (e.g. Huang et al., Citation2013). Cloud computing will continue to reduce the cost of storage, but the problem of data transfer, both node to node and CPU to display, may prove more troubling. Quantum computing offers an as-yet unproven release from Moore’s law, and is likely to have a significant impact on cartography as it moves from research to application (Clarke, Citation2014a). However, quantum computing is likely to favor only certain algorithms and methods, and it may not be the silver bullet that many assume it to be.
We are likely to see more maps and visual aids embedded into everyday objects such as car windshields and web browsers. This will allow more augmentation rather than immersion, i.e. the computer map will be displayed in some way that allows the human vision system to also take in surrounding information. Such applications will permit and enable many new environments for the use of digital maps: room interiors, organizational diagrams, underwater, and public buildings are likely areas of applicability. This will involve maps with 2, 3, and 4 dimensions depending on context and purpose. An indoor cartography is emerging that links to Building Information Modeling (BIM), architecture, design, and construction. Such systems could also allow virtual travel and viewing, and gaming, in the same way that real estate websites and video games do today (Edler & Dickmann, Citation2017). We are also likely to see new and innovative hardware, wearable screens, digital paper, foldable screens, and projected virtual devices such as keyboards. We can also expect further development of the story map idea, with closer integration into online news sites and interactive information sources such as Wikipedia. Such work will likely require greater understanding of cognitive issues in interpreting maps (White, Coltekin, & Hoffman, Citation2018).
Cartographic data and mapping
Data gathering for cartography has moved into the realm of sensors, be they LiDAR, GeoSAR, or satellite. Cartographic data will continue on the path that developed in the first 20 years of the twentieth century – data will be higher resolution, across more of the electromagnetic spectrum, more accurate, and available instantaneously. Online datasets will automatically update more regularly and will support more visual exploration, more flexible discovery and retrieval, and will be increasingly reliable. These data feeds will find their way into a growing number of web mapping applications, and consumer products that integrate augmented reality. They will provide data in 2, 3, and 4 dimensions, both for the past and for the present. Google Earth’s availability of historical map and image data is a simple example of what could be possible. The vision of a “digital earth” will be largely achieved and extended (Goodchild et al., Citation2012). Is a new and versatile national map updated in real time and adapted for a myriad of mobile and ubiquitous applications possible?
Cartography is increasingly looking toward unmapped spaces: the planets, beneath the oceans, and in the earth’s interior, but also the interiors of buildings. Indoor cartography currently lacks an active positioning mechanism (Gu, Lo, & Niemegeers, Citation2009), the equivalent of GPS that works indoors, but once developed many options for aids to navigation for indoor spaces will emerge. The need for interior space base maps, for large buildings, public facilities, and cave complexes, could be rapidly accomplished by mapping robots. The success of photogrammetry from Structure-from-Motion Photogrammetry means that much processing time will be committed to building 3D models to allow interior space mapping, modeling, and use in the location-based services industry (Michael et al., Citation2012). An obvious source of data for new building maps is the Building Information Management and Computer Aided Design software that is increasing used in construction, and BIM is increasingly popularized for spatial data infrastructure considerations (Kensek & Noble, Citation2014). Could an indoor cartography emerge to supplement new mapping methods with theory, navigational guidance and support new mobile applications?
In addition, there is movement in policy and legal frameworks to better and further apply geospatial information. Policy and law have largely been ignored in cartographic research in the past, but are now coming to the surface. The way in which data are designed, displayed, and interpreted could impact cartographers in the future. How can cartographic data meet the demands of data protection and privacy law? What new cartographic methods will be necessary to achieve both transparency and the protection of personal and sensitive information?
Spatial analysis and applications in cartography
It has been half a century since Hagerstrand’s classic paper called for individual-based and not aggregate data for social science (Hagerstrand, Citation1970). Positioning technologies, wearable devices, tracking systems, and wireless communications now mean that such data are available in abundance. From the applications perspective, a first field of expansion has been the use of automated maps in personal and vehicle navigation. Data generation by mapping authorities and user contributed sources mean that the background map is universally available. Such capabilities have enabled the information economy in the form of Amazon delivery, Uber rides, and online commerce. Routing algorithms continue to improve, and network solutions developed for street networks apply equally to computer networks, social networks, and power grids. Notably, many navigation-based applications also reduce costs, materials, and environmental damage, and so assist in the green economy.
Spatial analysis has developed increasingly sophisticated methods and approaches for map applications. Many of these research-oriented methods have benefitted greatly from being coded into open source research tools such as R, leaflet, tmap, simple features, d3, and plotly for R-based approaches. These libraries and functions can then be used to generate and embed interactive maps into websites and information graphics. Will the website of 20 years from now be unvisited unless it contains interactive, animated, and creative maps and visualizations?
Methods and models in cartography
Maps are models of the earth because they are simplified abstractions of earth’s attributes distributed over space. The simple vector polygons, lines, and points that depict the earth and that were once stored in proprietary data formats are now governed by strong international standards and increasingly in the public domain. The same is becoming true of imagery, which is also becoming cheaper, more timely, and is offered at higher resolutions. Web-based formats for spatial data discovery and distribution, and for descriptive metadata, have proliferated and become increasingly integrated with scripting languages and internet protocols. Some developments are GeoJSON, Geography Markup Language, and Scalable Vector Graphics, and tools include Leaflet, D3, CartoDB, MapBox, and the Computational Geometry Algorithms Library. Such standards and tools now power a majority of interactive mapping websites. The future lies in leveraging these tools to create new and striking ways of visualizing spatial data.
In addition, many computational modeling tools are increasingly becoming embedded or distributed via web interfaces. Geographical models involving maps directly include cellular automata, agent-based models, interaction and gravity models, partitioning systems, interpolators, and decision tools. Just as in climate modeling, it is likely that tools and data will become widespread on the web, and that modeling applications will become more common, including their use in education and by the general public. Will the elementary school student of 20 years from now be running climate simulations to visualize, understand, and adapt to climate changes?
GIScience
The next 20 years for GIScience have been considered at length in a recent study (Nittel, Clarke, Raposo, & Vasardani, Citation2016). Several of the topics identified for future research imply steps toward general purpose geographic information theory, and the development of such theory holds promise for the future of cartography. Advances in linked data hold the promise of making textual and image-based information searchable by geographic place, vastly expanding the scope of location-based services. Similarly, the formalization of spatial and cartographic ontologies will have implications for data standardization and use across disparate systems and applications. The advent of CyberGIS holds the promise of placing extraordinary computational power at the fingertips of the general public and scientists alike. Will the popularization of geographical analytic methods beyond citizen science allow diverse and innovative solutions to global problems?
Conclusion
The prospects for cartographic research in the next 20 years are rosy. Just as research led the way to the digital transition, contemporary and future research can lead the way to a more ubiquitous, embedded, and functional cartography. Calls for data will be replaced by the use of maps to generate insight and knowledge. Cartographic displays will find their way into our augmented sight, assisting in learning, navigation, safety assurance and yield more efficiency. Story maps and interactive information graphics can help a diverse world to become more just, inclusive and educated. Scientific knowledge can be informed, GIScience theory developed, and each citizen will have the power to search and analyze the world. In their review of visual analytics in cartography, Andrienko et al. (Citation2007) called for interdisciplinarity in the approach to future research and development. The cartographer of the future will need a different skill set that crosses cognitive psychology, art, narrative theory, computation, database theory, social science, image science, and data science. Rarely will such a skill set exist in a single person, so the future belongs to those who can coordinate and collaborate across the many disciplines involved, and be able to integrate the result to create aesthetic and effective maps. Discipline-centered study in colleges and universities, using the standard lecture, lab format may not be adequate for this skill set. It is likely that interdisciplinary education, mixed teaching methods, online instruction, self-paced learning, and active learning methods will be required. How will our educational institutions adapt to be able to supply young people with the right blend of new skills?
Last, cartography has an opportunity to assist with the great challenges facing the world today: climate change, inequality, scarcity, and the negative environmental impacts of human settlements and industries. Cartography can assist with renewable energy, smart cities, green solutions, sustainability, and resilience. It can also promote justice by revealing unjust distributions and allocations. Just as manual cartographers were motivated by these factors, so also the era of web cartography must not neglect the powerful role than maps can play in society at large.
Acknowledgments
We thank the anonymous reviewers, who provided useful feedback and insights that improved the final version of this paper.
Disclosure statement
No potential conflict of interest was reported by the authors.
References
- Alvares, C. A., Stape, J. L., Sentelhas, P. C., Goncalves, J. L. D., & Sparovek, G. (2013). Koppen’s climate classification map for Brazil. Meteorologische Zeitschrift, 22(6), 711–728. doi:10.1127/0941-2948/2013/0507
- Andrienko, G., & Andrienko, N. (2012). Privacy issues in geospatial visual analytics. In G. Gartner & F. Ortag (Eds.), Advances in location-based services. Lecture notes in geoinformation and cartography, (Chapter 16, pp. 239–246). Berlin: Springer.
- Andrienko, G., Andrienko, N., Jankowski, P., Keim, D., Kraak, M.-J., MacEachren, A. M., & Wrobel, S. (2007). Geovisual analytics for spatial decision support: Setting the research agenda. International Journal of Geographical Information Science, 21(8), 839–857. doi:10.1080/13658810701349011
- Armstrong, M. P. (2019). Active symbolism: Toward a new theoretical paradigm for statistical cartography. Cartography and Geographic Information Science, 46(1), 72–81. doi:10.1080/15230406.2018.1509733
- Batrinca, B., & Treleaven, P. C. (2015). Social media analytics: A survey of techniques, tools and platforms. AI & Society, 30(1), 89–116. doi:10.1007/s00146-014-0549-4
- Battersby, S. E., Finn, M. P., Usery, E. L., & Yamamoto, K. H. (2014). Implications of web mercator and its use in online mapping. Cartographica, 49(2), 85. doi:10.3138/carto.49.2.2313
- Bertin, J. (1967). Sémiologie Graphique. Les diagrammes, les réseaux, les cartes. ( With Marc Barbut [et al.]). Paris:Gauthier-Villars. (Translation 1983. Semiology of Graphics by William J. Berg.)
- Bevington-Attardi, D., & Rice, M. (2015). On the map: American cartography in 2015. Cartography and Geographic Information Science, 42(suppl 1), 1–5. doi:10.1080/15230406.2015.1060112
- Blei, D. M., & Lafferty, J. D. (2007). A correlated topic model of science. Annals of Applied Statistics, 1(1), 17–35. doi:10.1214/07-AOAS114
- Burgess, J., & Bruns, A. (2012). Twitter archives and the challenges of “Big Social Data” for media and communication research. M/C Journal, 15(5), 1–7. Retrieved from http://journal.media-culture.org.au/index.php/mcjournal/article/view/561Driscoll
- Camponovo, M. E., & Freundschuh, S. M. (2014). Assessing uncertainty in VGI for emergency response. Cartography and Geographic Information Science, 41(5), 440–455. doi:10.1080/15230406.2014.950332
- Caquard, S. (2011). Cartography I: Mapping narrative cartography. Progress in Human Geography, 37(1), 135–144. doi:10.1177/0309132511423796
- Chaix, B., Kestens, Y., Perchoux, C., Karusisi, N., Merlo, J., & Labadi, K. (2012). An interactive mapping tool to assess individual mobility patterns in neighborhood studies. American Journal of Preventive Medicine, 43(4), 440–450. doi:10.1016/j.amepre.2012.06.026
- Clarke, K. C. (2014a). GeoComputation in 2061. Ch. 19. In R. J. Abrahart & L. M. See (Eds.), GeoComputation (Vol. 2e, 429–446). Boca Raton, FL: CRC Press. doi:10.1201/b17091-20
- Clarke, K. C. (2014b). Cellular automata and agent-based models. Chapter 62. In M. M. Fischer & P. Nijkamp (Eds.), Handbook of regional science, (pp. 1217–1234). Berlin: Springer.
- Crampton, J. W., Graham, M., Poorthuis, A., Shelton, T., Stephens, M., Wilson, M. W., & Zook, M. (2013). Beyond the geotag: Situating ‘big data’ and leveraging the potential of the geoweb. Cartography and Geographic Information Science, 40(2), 130–139. doi:10.1080/15230406.2013.777137
- De Paor, D. G., & Whitmeyer, S. J. (2011). Geological and geophysical modeling on virtual globes using KML, COLLADA, and Javascript. Computers & Geosciences, 37(1), 100–110. doi:10.1016/j.cageo.2010.05.003
- Dow, J. M., Neilan, R. E., & Rizos, C. (2009). The international GNSS service in a changing landscape of global navigation satellite systems. Journal of Geodesy, 83, 3–4, 191–198. doi:10.1007/s00190-008-0300-3
- Edler, D., & Dickmann, F. (2017). The impact of 1980s and 1990s video games on multimedia cartography. Cartographica, 52(2), 168–177. doi:10.3138/cart.52.2.3823
- Gonçalves, T., Afonso, A. P., & Martins, B. (2015). Cartographic visualization of human trajectory data: Overview and analysis. Journal of Location Based Services, 9(2), 138–166. doi:10.1080/17489725.2015.1074736
- González, M. C., Hidalgo, C. A., & Barabási, A.-L. (2008). Understanding individual human mobility patterns. Nature, 453, 779. doi:10.1038/nature06958
- Goodchild, M. F. (2007). Citizens as sensors: The world of volunteered geography. GeoJournal, 69, 211–221. doi:10.1007/s10708-007-9111-y
- Goodchild, M. F., Guo, H., Annoni, A., Bian, L., de Bie, K., Campbell, F., … Woodgate, P. (2012). Next-generation digital earth. Proceedings of the National Academy of Sciences of the United States of America, 109(28), 11088–11094. doi:10.1073/pnas.1202383109
- Goodchild, M. F., Yuan, M., & Cova, T. J. (2007). Towards a general theory of geographic representation in GIS. International Journal of Geographical Information Science, 21(3), 239–260. doi:10.1080/13658810600965271
- Gorelick, N., Hancher, M., Dixon, M., Ilyushchenko, S., Thau, D., & Moore, R. (2017). Google earth engine: planetary-scale geospatial analysis for everyone. Remote Sensing of Environment, 202, 18–27. doi:10.1016/j.rse.2017.06.031
- Gould, N., & Mackaness, W. (2016). From taxonomies to ontologies: Formalizing generalization knowledge for on-demand mapping. Cartography and Geographic Information Science, 43(3), 208–222. doi:10.1080/15230406.2015.1072737
- Griffin, A. L., Robinson, A. C., & Roth, R. E. (2017). Envisioning the future of cartographic research. International Journal of Cartography, 3(suppl 1), 1–8. doi:10.1080/23729333.2017.1316466
- Gu, Y., Lo, A., & Niemegeers, I. (2009). A survey of indoor positioning systems for wireless personal networks. IEEE Communications Surveys & Tutorials, 11(1), 13–32. doi:10.1109/SURV.2009.090103
- Hagerstrand, T. (1970). What about people in regional science? Papers of the Regional Science Association, 24, 7–21. doi:10.1111/j.1435-5597.1970.tb01464.x
- Haklay, M. (2010). How good is volunteered geographical information? A comparative study of OpenStreetMap and Ordnance Survey datasets. Environment and Planning B: Planning and Design, 37, 682–703. doi:10.1068/b35097
- Haklay, M., Singleton, A., & Parker, C. (2008). Web mapping 2.0: the neogeography of the geoweb. Geography Compass, 2(6), 2011–2039. doi:10.1111/j.1749-8198.2008.00167.x
- Huang, B., Jiang, B., & Li, H. (2001). An integration of GIS, virtual reality and the Internet for visualization, analysis and exploration of spatial data. International Journal of Geographical Information Science, 15(5), 439–456. doi:10.1080/13658810110046574
- Huang, Q., Yang, C., Benedict, K., Rezgui, A., Xie, J., Xia, J., & Chen, S. (2013). Using adaptively coupled models and high-performance computing for enabling the computability of dust storm forecasting. International Journal of Geographical Information Science, 27(4), 765–784. doi:10.1080/13658816.2012.715650
- Iasiello, E. (2013). Fixing U.S. national cybersecurity: A modest proposal for swallowing pride and reducing egos. Comparative Strategy, 32(4), 301–307. doi:10.1080/01495933.2013.821843
- Jaboyedoff, M., Oppikofer, T., Abellán, A., Derron, M., Loye, A., Metzger, R., & Pedrazzini, A. (2012). Use of LIDAR in landslide investigations: A review. Natural Hazards, 61(1), 5–28. doi:10.1007/s11069-010-9634-2
- Jackson, P. S., Mullen, W., Agouris, P., Crooks, A., Croitoru, A., & Stefanidis, A. (2013). Assessing completeness and spatial error of features in volunteered geographic information. ISPRS International Journal of Geo-Information, 2(2), 507–530. doi:10.3390/ijgi2020507
- Janowicz, K., Schade, S., Bröring, A., Keßler, C., Maué, P., & Stasch, C. (2010). Semantic enablement for spatial data infrastructures. Transactions in GIS, 14, 111–129. doi:10.1111/j.1467-9671.2010.01186.x
- Janowicz, K., Scheider, S., Pehle, T., & Hart, G. (2012). Geospatial semantics and linked spatiotemporal data – Past, present, and future. Semantic Web, 3, 321–332. doi:10.3233/SW-2012-0077
- Katzfuss, M. (2017). A multi-resolution approximation for massive spatial datasets. Journal of the American Statistical Association, 112(517), 201–214. doi:10.1080/01621459.2015.1123632
- Kensek, K., & Noble, D. (2014). Building information modeling: bim in current and future practice. Hoboken, NJ: Wiley.
- Kielman, J., & Thomas, J. ( Guest Eds.). (2009). Special issue: foundations and frontiers of visual analytics. Information Visualization, 8(4), 239–314. doi:10.1057/ivs.2009.25
- Kwan, M.-P. (2000). Interactive geovisualisation of activity-travel patterns using three dimensional geographical information systems: A methodological exploration with a large data set. Transportation Research C, 8, 185–203. doi:10.1016/S0968-090X(00)00017-6
- LeCun, Y., Bengio, Y., & Hinton, G. (2015). Deep learning. Nature, 521(7553), 436–444. doi:10.1038/nature14539
- Lee, J.-G., & Kang, M. (2015). Geospatial big data: challenges and opportunities. Big Data Research, 2(2), 74–81. doi:10.1016/j.bdr.2015.01.003
- MacEachren, A. M. (1994). Visualization in modern cartography: Setting the agenda. In A. M. MacEachren & D. R. F. Taylor (Eds.), Visualization in modern cartography (pp. 1–12). Oxford: Pergamon.
- MacEachren, A. M. (1995). How maps work: representation, visualization, and design. New York: Guilford.
- MacEachren, A. M., & Kraak, M.-J. (2001). Research challenges in geovisualization. Cartography and Geographic Information Science, 28(1), 3–12. doi:10.1559/152304001782173970
- MacEachren, A. M., Robinson, A., Hopper, S., Gardner, S., Murray, R., Gahegan, M., & Hetzler, E. (2005). Visualizing geospatial information uncertainty: what we know and what we need to know. Cartography and Geographic Information Science, 32(3), 139–160. doi:10.1559/1523040054738936
- Maling, D. H. (1992). Coordinate systems and map projections (2nd ed.). Oxford, UK: Pergamon.
- McMaster, R. B., & Usery, E. L. (2004). A research agenda for geographic information science. Boca Raton, FL: CRC Press.
- Michael, N., Shen, S., Mohta, K., Mulgaonkar, Y., Kumar, V., Nagatani, K., … Tadokoro, S. (2012). Collaborative mapping of an earthquake-damaged building via ground and aerial robots. Journal of Field Robotics, 29(5), 832–841. doi:10.1002/rob.v29.5
- Miller, H. J. (2017). Time geography and space-time prism. In D. Richardson, N. Castree, M. F. Goodchild, A. Kobayashi, W. Liu, & R. A. Marston (Eds.), International encyclopedia of geography: People, the earth, environment and technology, (pp. 1–19). Hoboken, NJ: Wiley-Blackwell.
- National Academies of Sciences, Engineering, and Medicine. (2016). From maps to models: augmenting the nation’s geospatial intelligence capabilities. Washington, DC: National Academies Press. doi:10.17226/23650
- National Research Council. (2012). Advancing strategic science: A spatial data infrastructure roadmap for the U.S. Geological Survey. Washington, DC: The National Academies Press. doi:10.17226/13506
- National Research Council. (2013). Future U.S. workforce for geospatial intelligence. Washington, DC: National Academies Press.
- Nativi, S., Mazzetti, P., Santoro, M., Papeschi, F., Craglia, M., & Ochiai, O. (2015). Big data challenges in building the global earth observation system of systems. Environmental Modelling & Software, 68, 1–26. doi:10.1016/j.envsoft.2015.01.017
- Ngidi, M., Mans, G., McKelly, D., & Sogoni, Z. (2017). Using a hybrid methodology of dasyametric mapping and data interpolation techniques to undertake population data (dis)aggregation in South Africa. Canadian Journal for Studies in Discourse and Writing/Redactologie, 6(2), 232–244.
- Nittel, S., Bodum, L., Clarke, K. C., Gould, M., Raposo, P., Sharma, J. and Vasardani, M. (2016). Ch 3: Emerging technological trends likely to affect GIScience in the next twenty years. In H. Onsrud & W. Kuhn (Eds.), Advancing geographic information science: The past and next twenty years, (pp. 45–48). Needham, MA: GSDI Association Press. Retrieved from http://gsdiassociation.org/images/publications/AdvancingGIScience.pdf
- Peterson, M. P. (2014). Mapping in the cloud. New York: Guilford.
- Playfair, W. (2005). The commercial and political atlas and statistical breviary. Cambridge: Cambridge University Press. 978-0-521-85554-9 (Original 1801).
- Ponweiser, M. (2012). Latent Dirichlet Allocation in R (Diploma Thesis). Vienna University of Economics and Business, Vienna.
- Sahr, K., White, D., & Kimerling, A. J. (2003). Geodesic discrete global grid systems. Cartography and Geographic Information Science, 30(2), 121–134. doi:10.1559/152304003100011090
- Šavrič, B., & Jenny, B. (2014). A new pseudocylindrical equal-area projection for adaptive composite map projections. International Journal of Geographical Information Science, 28(12), 2373–2389. doi:10.1080/13658816.2014.924628
- See, L., Mooney, P., Foody, G., Bastin, L., Comber, A., Estima, J., … Rutzinger, M. (2016). Crowdsourcing, citizen science or volunteered geographic information? The current state of crowdsourced geographic information. ISPRS International Journal of Geo-Information, 5(5), 55. doi:10.3390/ijgi5050055
- Skupin, A., & Fabrikant, S. I. (2003). Spatialization methods: A cartographic research agenda for nongeographic information visualization. Cartography and Geographic Information Science, 30(2), 99–119. doi:10.1559/152304003100011081
- Slocum, T. A., McMaster, R. B., Kessler, F. C., & Howard, H. H. (2009). Thematic cartography and geovisualization (3rd ed.). Upper Saddle River, NJ:Pearson.
- Sui, D. Z. (2004). GIS, cartography, and the “third culture”: geographic imaginations in the computer age. The Professional Geographer, 56(1), 62–72. doi:10.1111/j.0033-0124.2004.05601008.x
- Tatem, A. J., Jia, P., Ordanovich, D., Falkner, M., Huang, Z., Howes, R., … Smith, D. L. (2017). The geography of imported malaria to non-endemic countries: A meta-analysis of nationally reported statistics. The Lancet Infectious Diseases, 17(1), 98–107. doi:10.1016/S1473-3099(16)30326-7
- Taylor, K., & Parsons, E. (2015). Where is everywhere: Bringing location to the web. IEEE Internet Computing, 19(2), 83–87. doi:10.1109/MIC.2015.50
- Tsou, M.-H. (2015). Research challenges and opportunities in mapping social media and big data. Cartography and Geographic Information Science, 42(suppl 1), 70–74. doi:10.1080/15230406.2015.1059251
- Varanka, D. E. (2011). Ontology patterns for complex topographic feature types. Cartography and Geographic Information Science, 38(2), 126–136. doi:10.1559/15230406382126
- Verbeek, K., Buchin, K., & Speckmann, B. (2011). Flow map layout via spiral trees. IEEE Transactions on Visualization and Computer Graphics (Proc. InfoVis’11)., 17, 2536–2544. doi:10.1109/TVCG.2011.202
- Vierling, K. (2008). Lidar: Shedding new light on habitat characterization and modeling. Frontiers in Ecology and the Environment, 6(2), 90–98. doi:10.1890/070001
- Wang, S. (2010). A CyberGIS framework for the synthesis of Cyberinfrastructure, GIS, and spatial analysis”. Annals of the Association of American Geographers, 100(3), 535–557. doi:10.1080/00045601003791243
- Wang, S., & Goodchild, M. F. (eds.). (2018). CyberGIS for geospatial discovery and innovation. Dordrecht, Netherlands: Springer. doi:10.1007/978-94-024-1531-5
- White, R., Coltekin, A., & Hoffman, R. R. (2018). Remote sensing and cognition: human factors in image interpretation. Boca Raton, FL: CRC Press.
- Wood, J., Dykes, J., Slingsby, A., & Clarke, K. C. (2007). Interactive visual exploration of a large spatio-temporal data set: Reflections on a geovisualization mashup. IEEE Transactions on Visual Computing and Graphics, 13(6), 1176–1183. doi:10.1109/TVCG.2007.70570
- Yang, C., Raskin, R., Goodchild, M., & Gahegan, M. (2010). Geospatial Cyberinfrastructure: Past, present and future. Computers, Environment and Urban Systems, 34(4), 264–277. doi:10.1016/j.compenvurbsys.2010.04.001
- Yu, L., & Gong, P. (2012). Google Earth as a virtual globe tool for Earth science applications at the global scale: Progress and perspectives. International Journal of Remote Sensing, 33(12), 3966–3986. doi:10.1080/01431161.2011.636081
- Yuan, M., & Stewart, K. (2008). Computation and visualization for understanding dynamics in geographic domains: A. Research agenda. Boca Raton, FL:CRC Press. doi:10.1201/9781420060331
- Zhu, R., Hu, Y., Janowicz, K., & McKenzie, G. (2016). Spatial signatures for geographic feature types: Examining gazetteer ontologies using spatial statistics. Transactions in GIS, 20, 333–355. doi:10.1111/tgis.1223