
ABSTRACT
Multi-temporal and spatially explicit population data are vital in many fields, such as demography, urban planning, disaster prevention,economics, and environmental modeling. Population data used in these studies are typically aggregated at census enumeration units, which are too coarse for many applications. Accurate population downscaling methods are needed to obtain population data at finer spatial resolutions. We use a novel settlement-related database, Built-Up Property Records (BUPR) from the Historical Settlement Data Compilation for the United States (HISDAC-US) to downscale population from census tracts to block groups. The BUPR dataset provides the number of built-up property records for each 250-m grid at 5-year temporal resolution from 1810 to 2015 for most contiguous United States (CONUS). The ability of BUPR to downscale population from census tracts to block groups for four states, representing a range of population densities, is evaluated here by comparing against other commonly-used ancillary datasets. The BUPR-based method outperforms all other methods in all but one state with highly-incomplete BUPR. A more detailed accuracy assessment is performed by dividing each state into low, medium, and high population density categories. The BUPR method produces more accurate downscaled population estimates for low and medium categories, though its performance deteriorates in the high density category due to its relatively coarse spatial resolution. BUPR-based dasymetric mapping is subsequently applied to the CONUS and found to generalize well beyond the four comparison states with high downscaling accuracy. The long-term record of the HISDAC-US dataset enables the potential construction of fine-grained population data back to 1810.
Introduction
Many fields such as demography, urban planning, disaster prevention, economics, and environmental modeling rely on multi-temporal and spatially explicit population data (Bakillah et al., Citation2014; Liu et al., Citation2008). Population data are aggregated at census enumeration units, which do not always align with the underlying spatial distribution of populations (Mennis, Citation2003). The spatial extents of census enumeration units also change over time, hampering time-series analysis of demographic information (Gregory & Ell, Citation2005). Another impediment to the analysis of demographic data is that they are not always reported at the same level of census enumeration units. For instance, the United States reports population at the block, block group, and census tract level, in order of increasingly coarse spatial resolution (Zandbergen & Ignizio, Citation2010), but nation-wide census block data only became available starting in 1990.
To provide longer high-resolution population data series, some grid-based population databases are constructed based on population downscaling and integration techniques, such as the U.S. Census Grids from SocioEconomic Data and Applications Center (SEDAC) (http://sedac.ciesin.columbia.edu/about) and the Social Landscape (SocScape) project (http://www.socscape.edu.pl/). SEDAC provides 1-km resolution population data for the entire U.S. and 250-m resolution for metropolitan statistical areas for 1990, 2000, and 2010 (De Sherbinin et al., Citation2002), while SocScape provides 30-m resolution population data for CONUS for 1990, 2000, and 2010 (Dmowska, Citation2019). In addition to the construction of grid-based population databases, a wide variety of population-dependent studies require effective methods for downscaling population data to finer spatial units as well as interpolating data across unaligned administrative units (Ben-Dor et al., Citation2021; Gaffin et al., Citation2004; Tenerelli et al., Citation2015).
One commonly used family of interpolation methods relies on areal interpolation. These are mass-preserving techniques widely used to transform socio-economic data between spatial units (Wu et al., Citation2005). The most basic areal interpolation method is simple areal weighting, which redistributes population from the source zone to each target zone in proportion to the area of each target zone (Goodchild & Lam, Citation1980). One major drawback of this method is that it assumes that population density is uniform within the source zone, which is rarely the case.
Dasymetric mapping is a spatial downscaling method and cartographic technique which redistributes spatial data from source zones to corresponding target zones based on ancillary data (Mennis, Citation2009; Zandbergen & Ignizio, Citation2010). The most commonly-used ancillary information is land cover data (Dobson et al., Citation2000; Gallego & Peedell, Citation2001; Sleeter, Citation2004). In land-cover-based dasymetric mapping, land cover types are directly associated with population densities based on the analyst’s domain knowledge or are estimated using empirical sampling techniques (Mennis & Hultgren, Citation2005, Citation2006). When population density information is unavailable, binary dasymetric mapping is generally implemented, dividing the target regions into two zones with distinct population characteristics (e.g. high density versus low density) derived from ancillary datasets such as land cover maps (Mennis, Citation2003; Su et al., Citation2010). This binary dasymetric mapping method is similar to simple area weighting, but the redistribution of the population is proportional to the residential area of each target zone (Fisher & Langford, Citation1995). Some other commonly-used ancillary data for population downscaling include imperviousness, road data, and nighttime lights (Azar et al., Citation2010; Bennett & Smith, Citation2017; Reibel & Bufalino, Citation2005). Imperviousness and road networks are promising ancillary data sources for population downscaling due to their high correlation with population density (Lu et al., Citation2006; Su et al., Citation2010; Xian & Crane, Citation2005). Researchers have found that truncating non-residency-related imperviousness or roads (e.g. pixels with high imperviousness values; highways) could result in a higher population downscaling accuracy (Lu et al., Citation2006; Morton & Yuan, Citation2009; Zandbergen & Ignizio, Citation2010). Nighttime lights data have also proven to be robust for population estimation and population downscaling, but they may not be capable of handling small areas due to their relatively coarse spatial resolution (e.g. 1 km; 0.75 km) (Lo, Citation2001; Stathakis & Baltas, Citation2018). Besides these traditionally-used ancillary datasets, recent dasymetric mapping efforts have leveraged novel building-level databases. For example, Huang et al. (Citation2021) successfully disaggregated population from census tract level to 100-m grid level in the CONUS using open-source Microsoft building footprints data released in 2018.
In addition to model accuracy, spatial and temporal data coverage is another consideration when choosing an appropriate ancillary dataset for dasymetric mapping. Datasets that are available nationwide or globally are especially attractive for their generalizability, especially in regions where data is sparse. Focusing on the U.S., Zandbergen and Ignizio (Citation2010) conduct dasymetric mapping of population using different nation-wide ancillary datasets across four different states (New Mexico, Oregon, South Carolina, and Connecticut) that have a wide variation in population density. These ancillary datasets include land cover and imperviousness data from the 2001 National Land Cover Dataset (NLCD), road network data from the Topologically Integrated Geographic Encoding and Referencing (TIGER) 2000 line dataset, and nighttime lights data obtained from the Operational Linescan System (OLS) of the Defense Meteorological Satellite Program (DMSP). Zandbergen (Citation2011) further extends the analysis by comparing the performance of dasymetric mapping based on these datasets with mapping using a high-resolution address point dataset obtained from the Ohio Geographically Referenced Information Program (OGRIP). The OGRIP address point dataset provides the location of all addressable units within a given jurisdiction, including both residential and nonresidential address points. An address point dataset containing all data points and a subset containing only residential data points were tested in 16 counties of Ohio characterized by varying population density. Both the full dataset and the subset dataset greatly outperformed other data sources, with the subset dataset containing only residential address points achieving slightly better performance than the full OGRIP dataset. (Tapp, Citation2010). One major limitation of this approach is that state-wide address point data were only available for Indiana, North Carolina, Ohio, Tennessee, and Vermont at the time of the study (Zandbergen, Citation2011).
In this same vein, the settlement-related measurements from the Historical Settlement Data Compilation for the United States (HISDAC-US) have potential as an informative tool for dasymetric mapping. The HISDAC-US datasets are based on property records compiled in the Zillow Transaction and Assessment Dataset (ZTRAX), including Built-Up Areas (BUA), First Built-Up Years (FBUY), Built-Up Intensity (BUI), Built-Up Property Locations (BUPL), and Built-Up Property Records (BUPR) layers. All these layers share the same spatial resolution of 250-m and temporal resolution of 5 years from 1810 to 2015 covering most of the contiguous United States (Uhl et al., Citation2021).
BUA is a binary raster layer indicating the presence (by the value of 1) or absence (by the value of 0) of at least one built-up structure for each grid cell while FBUY shows the year the first built-up structure has been recorded. BUI provides the sum of the indoor areas of all the structures in each grid cell. BUPR is a proxy variable for building units counting the number of individual built-up property records (i.e. representing individually owned buildings, such as a single-family housing unit, an individually owned factory, and commercially used building; or individually owned building units within a multi-owner structure, such as a condominium unit and office unit within a larger building structure) while BUPL is a proxy variable for individual, physically built-up structures counting the number of unique locations of built-up property records (Leyk & Uhl, Citation2018; Uhl et al., Citation2021). The BUPR and BUPL datasets produce similar counts in areas dominated by individually-owned, single-family residential housing while subtle differences occur mainly in urban city centers dominated by high-rise and multi-unit buildings (Uhl et al., Citation2021). Research from Leyk et al. (Citation2020) show that BUPR has high overall correlation with population counts and is a robust proxy for population throughout the records. We therefore select BUPR among the various metrics available in the HISDAC-US dataset to explore its potential for the dasymetric mapping of population.
The BUPR dataset has shown high levels of reliability across the whole temporal record through comparison with multiple ancillary data sources (Microsoft building data for 2016, annual-resolution multi-temporal building print from 1800 to 2015, and county-level U.S. census housing unit counts from 1890 to 2010 with temporal resolution between 10 and 30 years), though the level of uncertainty increases prior to 1850 due to sparse information in the ZTRAX dataset. Unlike the OGRIP dataset, the BUPR dataset does not distinguish between residential and nonresidential records. Compared with the exact point locations recorded in the OGRIP dataset, BUPR provides information at a coarser spatial resolution of 250-m due to the intrinsic spatial uncertainties of the ZTRAX dataset (Uhl et al., Citation2021). However, BUPR provides far greater spatial and temporal coverage across the United States.
In this study, we conduct dasymetric mapping using BUPR as an ancillary dataset for four states representing a range of population densities, Connecticut, Oregon, South Carolina, and New Mexico. Our study specifically focuses on population downscaling from census-tract level to block-group level, for two primary reasons:
To maintain consistency with the study of Zandbergen and Ignizio (Citation2010), which facilitates comparisons between the ancillary datasets considered in their study.
Block-group level population data starting from 1970 is an important data input in our larger Integrated Coastal Modeling (ICoM) project. ICoM is a multi-year, multi-institutional project sponsored by the U.S. Department of Energy (DOE) to achieve a robust predictive understanding of coastal evolution accounting for the complex, multi-scale interactions among physical, biological, and human systems.
The performance of the BUPR-based technique was compared with those based on the ancillary datasets used in Zandbergen and Ignizio (Citation2010). The results indicate that the BUPR-based technique can achieve higher accuracy than other traditionally-used datasets in many instances. The BUPR dataset is particularly promising due to its temporal coverage back through 1810, potentially enabling the reconstruction of high spatial, temporal resolution population records for most of the United States for the past two centuries (Leyk et al., Citation2020). Such reconstructed population records could provide valuable information for a wide range of research topics including the study of population migration patterns under past climate and socioeconomic changes, environmental justice and equity, and disaster preparedness for populated areas.
Methods
Data
We obtained U.S. decennial census population data along with corresponding boundary shapefile maps for the contiguous United States at both census tract and block group level for the year of 2000 from the Integrated Public Use Microdata Series (IPUMS) (Manson et al., Citation2021). We downloaded BUPR for the year 2000 from the HISDAC-US website (https://dataverse.harvard.edu/dataverse/hisdacus). Some pixels in the BUPR dataset are designated as “incomplete” due to either limits in the geographic coverage of the ZTRAX database or incomplete coverage of the built-year attribute in the ZTRAX database. Of the 3,018 counties in the CONUS, 82 of them do not have any geospatial ZTRAX data records. These data-gap counties are scattered across the CONUS, and only constitute 2.5% of the CONUS area which accounts for 0.82% of the U.S. population in 2010. The absence of built-year attribute in the ZTRAX dataset also results in incompleteness of the BUPR dataset. Build-year information in each ZTRAX property record is vital for the creation of the multi-temporal BUPR dataset. While build-year information is widely available through most of CONUS, it is lacking in significant portions of the upper Midwest, Vermont, Louisiana, and New Mexico. The omission of publicly owned buildings in the ZTRAX records is an additional source of data incompleteness (Uhl et al., Citation2021).
Study areas
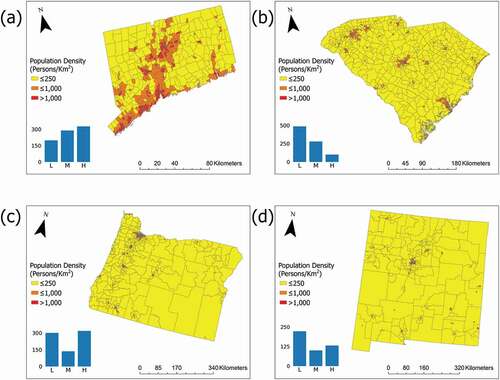
To facilitate comparisons with the results in Zandbergen and Ignizio (Citation2010), we use the four states of New Mexico, Oregon, South Carolina, and Connecticut as our initial study area. These four states represent different population densities and ecoregions. While New Mexico has an incomplete BUPR dataset, we nonetheless include it for thorough comparison with Zandbergen and Ignizio (Citation2010). In 2000, Connecticut had the highest population density of 264.30 persons/km2, followed by South Carolina with a population density of 50.04 persons/km2. Oregon and New Mexico were far less densely populated with densities of 13.61 persons/km2 and 5.78 persons/km2, respectively. shows the population density by census tract for the study areas in 2000. We inherit the same population density thresholds for defining low (< 250 persons/km2), medium (250 ~ 1,000 persons/km2), and high (> 1,000 persons/km2) population intensity areas as used in Zandbergen and Ignizio (Citation2010). A bar plot showing the number of census tracts with different population densities is included in the population density map for each state. Based on , Connecticut is dominated by low population density census tracts in terms of land area (accounting for nearly 2/3 the total land area), while high and medium population density census tracts outnumber low population density ones in terms of number of census tracts. South Carolina primarily consists of low population density census tracts in terms of both area and tract count, though nearly one-third of the census tracts by count are medium population density. Low population density census tracts account for majority of land area in Oregon and New Mexico, though high population density census tracts slightly outnumber low density ones in Oregon. Low density tracts predominate in New Mexico in terms of count.
Figure 1. Population density in 2000 by census tract in: a) Connecticut, b) South Carolina, c) Oregon, d) New Mexico. The barplot on the lower-left corner of each graph shows the number of census tracts by population density, with “L,” “M,” and “H” indicating low population density (< 250 persons/km2), medium population density (250 ~ 1,000 persons/km2), and high population density (>1,000 persons/km2) categories
Dasymetric mapping of population for the four states
Relying on results from Zandbergen and Ignizio (Citation2010), we first compare the performance of BUPR as an ancillary data source compared to those that are commonly employed in previous studies. As with the Zandbergen and Ignizio’s study, the evaluation is performed for the year 2000 such that the BUPR-based results could be directly compared to their results. All data are first projected to the U.S. Contiguous Albers Equal Area projection for consistency. Then, the BUPR values are aggregated for each block group for all four states. This aggregation process calculates the sum of the BUPR values within each block group. If one BUPR pixel lies completely within a block group, its BUPR value will be added to the sum of BUPR values for that block group. For BUPR pixels that intersect multiple block groups, its value is allocated to each block group in proportion to the pixel area within each block group. Census tract populations are then redistributed to block groups using BUPR values as redistribution weights. For instance, if a census tract consists of two block groups with BUPR values of 5 and 10, respectively, then each of these two block groups would respectively receive 1/3 and 2/3 of the total population of the census tract. Following the method above, census tracts with a BUPR value of zero would result in corresponding block groups receiving zero values, precluding the distribution of population based on BUPR values. For these block groups, simple areal weighting is used instead. shows the number of census tracts with BUPR value of zero in the four states. Almost all the census tracts in Connecticut and Oregon have a BUPR value greater than zero, while South Carolina and New Mexico have 4% and 20% of census tracts with a BUPR value of zero, respectively.
Table 1. Number of census tracts (CTs) with 0 BUPR in the four studied states
Here, we briefly describe the methods adopted in Zandbergen and Ignizio (Citation2010), while additional details can be found in the original paper. Land cover-based dasymetric mapping is used to redistributes population from the census tract level to the block group level based on the estimated population density for each land cover type. The Imperviousness-based method aggregates the pixel-level imperviousness value (representing the impervious percentage of each grid cell at a scale between 0% and100%) to the block group level and then uses the total sum of the imperviousness value for each block group as the population redistribution weight. Four different versions of imperviousness are used, including the original imperviousness, imperviousness excluding pixels with an imperviousness value greater than 75%, imperviousness excluding pixels with an imperviousness value greater than 60%, and imperviousness excluding pixels consisting of roads (the latter referred to as cleaned imperviousness). Total road length and total sum of nighttime lights values for each block group are also used to calculate population redistribution weights. Two versions of road data are used, including all roads and local roads only. Lastly, a simple area weighting is also conducted for the four states to serve as a baseline for comparison. Zandbergen and Ignizio (Citation2010) assume a linear relationship between population counts and ancillary datasets (imperviousness, road density, and nighttime lights), which is a potential limitation of their analysis.
Dasymetric mapping of population for the contiguous United States
A BUPR-based dasymetric mapping of population is further applied to the contiguous United States to test its generalization capability across the nation.
Accuracy assessment
We adopt the same method for accuracy assessment as Zandbergen and Ignizio (Citation2010) to facilitate comparison. We use three metrics to assess the agreement between the redistributed and actual population, including the number of people placed incorrectly, the median absolute value of the percentage errors for each block group, and the R2 value of the BUPR-based prediction for each block group. The number of people placed incorrectly is calculated by taking the absolute difference between the redistributed population and actual population for each block group and dividing this value by two. The reason for this division is that one incorrectly placed person would contribute to a difference of two between the projected and actual populations, as they would appear as incorrectly placed both in the block group in which they actually live and in the block group where they were mistakenly placed.
The assessment of BUPR-based dasymetric mapping accuracy is conducted for each state, and then compared to the results of Zandbergen and Ignizio (Citation2010). In addition, for each state, the accuracy is assessed for three different categories of census tracts based on population density, including less than 250 persons/km2, between 250 and 1,000 persons/km2, and more than 1,000 persons/km2. These population density thresholds are identical to those used in the study of Zandbergen and Ignizio (Citation2010) to facilitate comparisons between ancillary datasets.
Results and discussion
BUPR largely outperforms other CONUS-wide ancillary datasets in dasymetric mapping
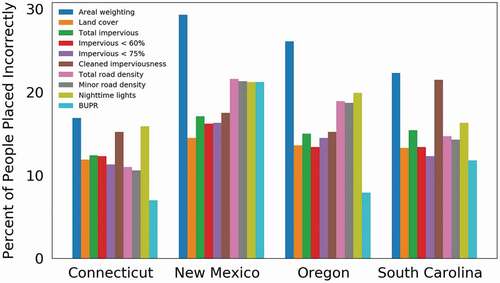
All dasymetric mapping approaches based on CONUS-wide ancillary datasets outperform simple areal weighting across each of the four studied states (see and ). However, the best non-BUPR ancillary dataset varies from state to state. Based on these results, Zandbergen and Ignizio (Citation2010) conclude that there is no single optimal ancillary dataset for dasymetric mapping, and the most appropriate dataset varies based on the characteristics of the study area. We see that the BUPR-based technique outperforms all other techniques based on CONUS-wide ancillary datasets in three of the four states, namely Connecticut, South Carolina, and Oregon. However, the BUPR-based mapping in New Mexico has a relatively lower ranking among all the dasymetric models. This is likely due to the prevalence of incomplete BUPR data in New Mexico.
Table 2. Accuracy assessment results for dasymetric mapping using different ancillary data sources. The ranks in Table 2 are based on the percentage of people placed incorrectly, though all three metrics produce similar rankings. Except for BUPR, accuracy assessment results based on ancillary data sources are directly obtained from Zandbergen and Ignizio (Citation2010)
Figure 2. Bar plot for the percent of people placed incorrectly for each technique in the four states.
shows the percentage of people placed incorrectly by population density category for each state. Zandbergen and Ignizio (Citation2010) find that the performance of dasymetric mapping techniques generally increases in high population density areas due to the more heterogeneous population distribution in rural areas relative to urban areas. However, the BUPR-based technique shows decreasing accuracy in the higher population density categories except in New Mexico. The BUPR-based technique produces inferior population downscaling performance than most of the other ancillary datasets among all the three population density areas in New Mexico, which is within our expectation due to its high level of data incompleteness. Unlike the other three states, we observe an increase in accuracy in the higher population density categories in New Mexico. One possible explanation is that the completeness of BUPR is a determining factor for the accuracy in New Mexico, and the BUPR dataset is made more complete for higher population density areas, as indicated by the decreasing percentage of block groups with zero BUPR in the higher population density categories.
Table 3. Percentage of people placed incorrectly by population density category
Considering low population density areas in Connecticut, Oregon, and South Carolina, the BUPR-based technique clearly outperforms the other methods, indicating that BUPR is a more effective proxy for population distribution patterns in low population density areas. For the medium population density category, BUPR outperforms the other techniques in certain instances, ranking No. 1 in both Connecticut and Oregon. For South Carolina, BUPR ranks as third, though its performance (11.6%) is only slightly lower than that of the best-performing model based on minor road density (10.9%). The performance of the BUPR deteriorates in high population density areas, but still ranks as first in Connecticut and fifth in Oregon. In South Carolina, the BUPR-based model has similar performance with simple areal weighting in the high population density category, though the performance differences among all the techniques are small compared with the other two population density categories.
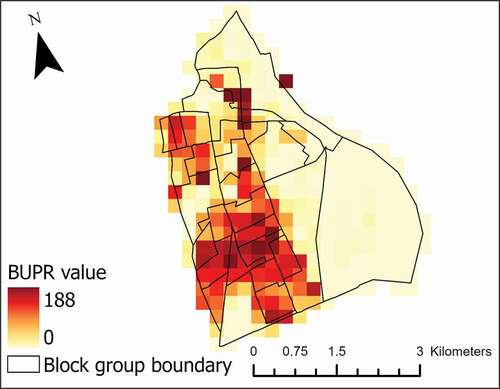
The deterioration of BUPR-based dasymetric mapping performance in high population density areas across these three states may be due to the smaller areas of these block groups. Many of these block groups only contain a few BUPR pixels (250-m). illustrates this phenomenon by showing the BUPR values for block groups in the city center and suburban areas of Hartford, Connecticut. Due to the location uncertainty of the BUPR records, the aggregated BUPR values for these smaller block groups suffer from higher inaccuracy than the larger ones. In contrast, land cover and imperviousness data have finer spatial resolutions of 30-m, which is more appropriate for small block groups.
Figure 3. BUPR values for block groups in the city center and suburban areas of Hartford, Connecticut
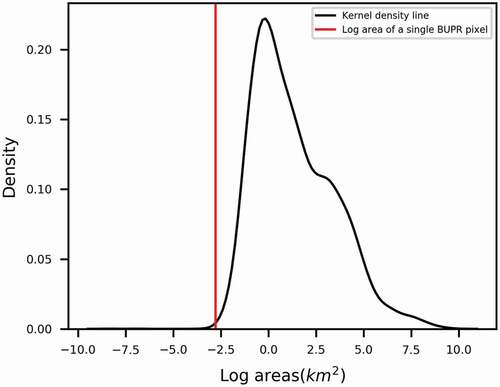
To test our assumption that the accuracy of BUPR-based dasymetric mapping deteriorates with the decrease of block group areas, we plot the log block group areas with the log absolute error percentages generated from the BUPR-based technique in Connecticut in . Connecticut is selected for the scatterplot due to its relatively complete BUPR data record. The scatterplot indicates a decreasing trend of errors with an increase of block group areas. We also plot the kernel density of the log areas for block groups in all the four states as shown in . Out of the 9,379 block groups, only 5 of them have an area smaller than the area of a single BUPR pixel (0.065 km2).
Figure 4. Scatter plot between block group areas and absolute error percentages generated from BUPR-based technique for the state of Connecticut. Both the areas and the absolute error percentages are log transformed to aid visualization (9 block groups out of a total of 2,555 with absolute error percentage values of 0 were removed as a log transformation is not applicable). The red dots denote the mean log absolute error percentage value for each log area category from −4 to 4 (incremented at an interval of 1). A secondary axis is also added to show the original values before log-transformation for easier interpretation
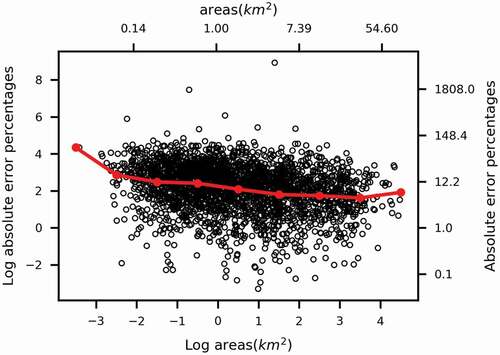
Figure 5. Kernel density plot for the block group areas (log transformed) in the four states. The red line indicates the value of a single BUPR pixel area (log transformed). Out of the 9,379 block groups, only 5 of them have an area smaller than the area of a single BUPR pixel (0.065 km2)
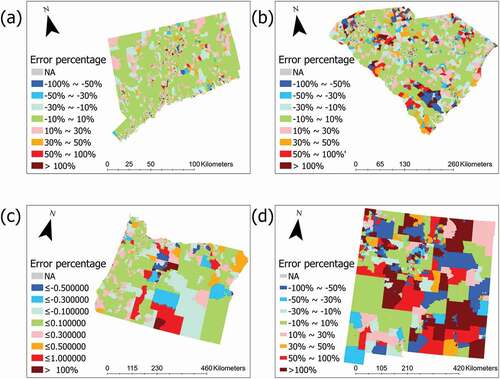
shows the error percentage between estimated and actual block group population for the four states. Most of the block groups show relatively low error percentages (−10% ~ 10%) except for those in New Mexico, where the BUPR dataset is largely incomplete. Comparing and the BUPR completeness map from Uhl et al. (Citation2021), we find that majority of the block groups with high error percentages are located in areas with low BUPR completeness. We also find that small block groups tend to have higher error percentage values than larger block groups under similar BUPR completeness conditions. For example, in Connecticut, where the BUPR data is complete across the whole state, most block groups with high error are located in the Hartford and New Haven city centers with smaller block group sizes. This finding further reinforces our hypothesis regarding the relationship between population downscaling accuracy and block group area.
Figure 6. Error percentage between estimated and actual block group population in a) Connecticut; b) South Carolina; c) Oregon; d) New Mexico. Block groups with NA values indicate block groups with an actual population of 0
Because the BUPR dataset does not account for group quarter building records (e.g. college dorms, prisons, etc), we specifically examine several block groups containing these facilities and found a general underestimation of population for these block groups, which conforms to our expectations. However, detailed statistical analysis for the quantification of the impacts of missing group quarter building records in the BUPR dataset on the dasymetric mapping accuracy is not performed due to limited information on the occurrence, location, and use of group quarter buildings.
Accuracy assessment for the contiguous United States
Extending beyond the states considered in Zandbergen and Ignizio (Citation2010), we also downscale population from the census-tract to the block-group level across the contiguous United States. The downscaled block group population and its corresponding accuracy can be downloaded at https://doi.org/10.5281/zenodo.5211098. We assess the accuracy of the downscaling for states with relatively complete BUPR datasets, as well as seven states (New Mexico, Louisiana, Vermont, Wisconsin, Michigan, South Dakota, and North Dakota) with limited datasets. For the seven states with incomplete BUPR records, 22% of the population are placed incorrectly, with a median absolute error of 25.5%, and an R2 of 0.27 between the downscaled and actual population for block groups. These metrics suggest that the BUPR-based downscaling approach has difficulties in areas where the BUPR data is largely incomplete. Two factors drive the performance declines in regions with high BUPR incompleteness: 1. For the census tracts with a non-zero BUPR value containing incomplete BUPR pixels, the aggregated BUPR value is likely underestimated due to the incomplete BUPR records; 2. For the census tracts with an aggregated BUPR value of zero, low accuracy is expected due to the intrinsic poor performance of the substitution population downscaling method (i.e. simple areal weighting). Rather than using simple areal weighting as an alternative, accuracies are expected to increase if dasymetric mapping using other ancillary datasets (e.g. land cover, imperviousness, road networks, etc) might improve downscaling accuracy for the census tracts with zero BUPR values.
For the states with relatively complete BUPR records, only 10% of the population are placed incorrectly, with a median absolute error of 13%. The R2 between the downscaled and actual population for block groups is 0.7. shows the mean absolute error percentage for each county across the contiguous U.S.
Figure 7. Mean absolute error percentage between downscaled population and actual population for each county across the contiguous United States
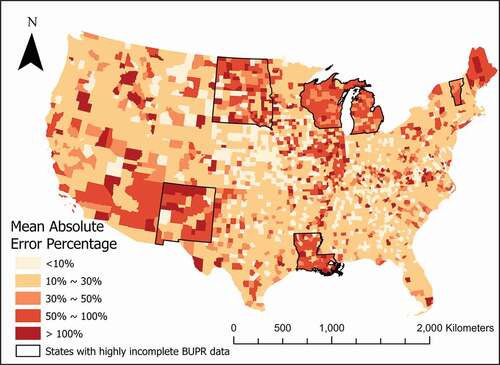
The BUPR-based mapping performs well across the contiguous U.S., especially in the eastern states which have highly complete BUPR datasets (see ). In general, there is a negative correlation between the completeness of the BUPR dataset and the absolute error percentage. For example, high error percentages are observed in counties in northern Maine, an area which has a more incomplete BUPR record according to Uhl et al. (Citation2021).
To further quantify the impacts of BUPR data completeness on population downscaling accuracy, we calculate the percent of census tracts with no BUPR records over the total number of census tracts, and the percent of people placed incorrectly for each state across the contiguous United States. The R2 between BUPR incompleteness and incorrect placement percentage is 0.77 (see ), a strong correlation between the two. From , we can see that all seven states with limited BUPR datasets also have high level of errors. Maine is an outlier, with a much higher error value relative to other states with comparable percentage of census tracts with no BUPR records. Although Maine is not included in the list of states with high level of BUPR incompleteness, it still suffers from low levels of BUPR completeness, especially in its northern part, according to the BUPR completeness map in Uhl et al. (Citation2021). As a result, the population downscaling accuracy in Maine is similar to those of the seven states due to the uncertainty introduced by high level of BUPR incompleteness.
Figure 8. Scatter plot of the percentage of people placed incorrectly against the percentage of census tracts with no BUPR records for each state across the contiguous United States
Conclusions
In this study, we have assessed the accuracy of dasymetric mapping based on BUPR, a novel settlement-related dataset. The performance for BUPR-based dasymetric mapping is compared with other traditionally-used techniques described in Zandbergen and Ignizio (Citation2010). At the State-level, BUPR-based dasymetric mapping outperforms other techniques in low population density regions (Oregon), medium population density regions (South Carolina), and high population density regions (Connecticut), and is only inferior to other ancillary datasets in New Mexico, where the BUPR dataset is largely incomplete. Errors caused by limited BUPR availability are not formally quantified, mainly due to the lack of quantitative data on BUPR incompleteness.
Even though BUPR contains commercial and industrial unit records in addition to residential unit records, it is nonetheless shown to be as a promising ancillary dataset for population downscaling. The BUPR-based technique is highly accurate for low and medium population density areas whereas other ancillary datasets produce relatively lower accuracy estimation. Its performance deteriorates for high population density areas due to its relatively coarse spatial resolution of 250-m, while the truncated imperviousness data generally achieve higher accuracy because it can easily delineate inhabited land from nonresidential land in areas with high contrast in land use (e.g. apartment buildings versus urban parks in the CBD), especially when applied at higher spatial resolution (e.g. 30-m). The location uncertainty of built-up property records in the BUPR dataset leads to less accurate aggregated BUPR values for high population density block groups characterized by small area extent. Though the study site is different, we observe that the dasymetric mapping using the high-resolution address point dataset in the study of Zandbergen (Citation2011) has achieved higher accuracy than our method based on BUPR. This can be potentially attributed to the higher spatial resolution of the address point dataset, compared with BUPR’s 250-m resolution.
Additional factors potentially contribute to the discrepancy of the final population downscaling accuracies among ancillary datasets beyond inconsistency of spatial resolution, such as the choice of the ancillary data (e.g. BUPR versus land cover) and precision and/or accuracy of the ancillary dataset. These factors interact with each other, and collectively determine the final population downscaling accuracy (Grippa et al., Citation2019; Langford, Citation2013). One limitation of this study is that we did not disentangle the impacts of these factors.
The BUPR dataset has high levels of reliability across the entire period of record, especially for years after 1850, and it has proven to be a robust proxy for population throughout the period of record at the county scale (Uhl et al., Citation2021). The BUPR dataset spans from 1810 to 2015, providing potential for population downscaling as far back as census population data are available. To evaluate whether the BUPR-population relationship identified in this study is enduring over time, one could identify location-specific high-resolution population datasets that pre-date 1990 and assess the correlation between BUPR and population for those specific regions/times. Confirmation of adequate performance across time would enable the construction of high-resolution population maps for most of the contiguous United States extending to the early 1800 s using BUPR as an ancillary data source.
While the current effort focuses on population downscaling at the block group level, the method could also be applied at different targeted spatial levels (e.g. block, 250-m grid, county, etc) based on study needs. The population reconstruction could be applied in a wide variety of research domains and topics of inquiry. For example, we anticipate utilizing the downscaled population data to perform high-resolution historical investigations of housing market and population dynamics in the context of historical natural hazards such as flood risk, informing the development of an agent-based model of coastal development patterns. The reconstructed population data could help researchers investigate additional topics of emerging interest such as population migration patterns under past climate and socioeconomic changes, environmental justice and equity, and disaster preparedness for populated areas.
Acknowledgments
We thank Tim McPherson from PNNL for reviewing our paper and giving us constructive suggestions for improvements.
Disclosure statement
No potential conflict of interest was reported by the author(s).
Additional information
Funding
References
- Azar, D., Graesser, J., Engstrom, R., Comenetz, J., Leddy, R. M., Jr, Schechtman, N. G., & Andrews, T. (2010). Spatial refinement of census population distribution using remotely sensed estimates of impervious surfaces in Haiti. International Journal of Remote Sensing, 31(21), 5635–5655. https://doi.org/https://doi.org/10.1080/01431161.2010.496799
- Bakillah, M., Liang, S., Mobasheri, A., Jokar Arsanjani, J., & Zipf, A. (2014). Fine-resolution population mapping using OpenStreetMap points-of-interest. International Journal of Geographical Information Science, 28(9), 1940–1963. https://doi.org/https://doi.org/10.1080/13658816.2014.909045
- Ben-Dor, G., Ben-Elia, E., & Benenson, I. (2021). Population downscaling in multi-agent transportation simulations: A review and case study. Simulation Modeling Practise and Theory, 108, 102233. https://doi.org/https://doi.org/10.1016/j.simpat.2020.102233
- Bennett, M. M., & Smith, L. C. (2017). Advances in using multitemporal night-time lights satellite imagery to detect, estimate, and monitor socioeconomic dynamics. Remote Sensing of Environment, 192, 176–197. https://doi.org/https://doi.org/10.1016/j.rse.2017.01.005
- De Sherbinin, A., Balk, D., Yager, K., Jaiteh, M., Pozzi, F., Giri, C., & Wannebo, A. (2002). Social science applications of remote sensing: A CIESIN thematic guides. Center for International Earth Science Information Network (CIESIN) of Columbia University. http://sedac.ciesin.columbia.edu/binaries/web/sedac/thematic-guides/ciesin_ssars_tg.pdf
- Dmowska, A. (2019). Dasymetric modelling of population distribution–large data approach. Quaestiones Geographicae, 38(1), 15–27. https://doi.org/https://doi.org/10.2478/quageo-2019-0008
- Dobson, J. E., Bright, E. A., Coleman, P. R., Durfee, R. C., & Worley, B. A. (2000). LandScan: A global population database for estimating populations at risk. Photogrammetric Engineering and Remote Sensing, 66(7), 849–857. https://doi.org/https://doi.org/10.1201/9781482264678-24
- Fisher, P. F., & Langford, M. (1995). Modelling the errors in areal interpolation between zonal systems by Monte Carlo simulation. Environment and Planning A, 27(2), 211–224. https://doi.org/https://doi.org/10.1068/a270211
- Gaffin, S. R., Rosenzweig, C., Xing, X., & Yetman, G. (2004). Downscaling and geo-spatial gridding of socio-economic projections from the IPCC Special Report on Emissions Scenarios (SRES). Global Environmental Change, 14(2), 105–123. https://doi.org/https://doi.org/10.1016/j.gloenvcha.2004.02.004
- Gallego, J., & Peedell, S. (2001). Using CORINE land cover to map population density. Towards Agri-environmental Indicators, Topic Report, 6, 92–103. European Environment Agency. http://citeseerx.ist.psu.edu/viewdoc/download?doi=10.1.1.454.5591&rep=rep1&type=pdf
- Goodchild, M. F., & Lam, -N. S.-N. (1980). Areal interpolation: A variant of the traditional spatial problem. Geo-processing, 1(3) , 297–312. https://asu.pure.elsevier.com/en/publications/areal-interpolation-a-variant-of-the-traditional-spatial-problem
- Gregory, I. N., & Ell, P. S. (2005). Breaking the boundaries: Geographical approaches to integrating 200 years of the census. Journal of the Royal Statistical Society: Series A (Statistics in Society), 168(2), 419–437. https://doi.org/https://doi.org/10.1111/j.1467-985X.2005.00356.x
- Grippa, T., Linard, C., Lennert, M., Georganos, S., Mboga, N., Vanhuysse, S., Gadiaga, A., & Wolff, E. (2019). Improving urban population distribution models with very-high resolution satellite information. Data, 4(1), 13. https://doi.org/https://doi.org/10.3390/data4010013
- Huang, X., Wang, C., Li, Z., & Ning, H. (2021). A 100 m population grid in the CONUS by disaggregating census data with open-source Microsoft building footprints. Big Earth Data, 5(1), 112–133. https://doi.org/https://doi.org/10.1080/20964471.2020.1776200
- Langford, M. (2013). An evaluation of small area population estimation techniques using open access ancillary data. Geographical Analysis, 45(3), 324–344. https://doi.org/https://doi.org/10.1111/gean.12012
- Leyk, S., Uhl, J. H., Connor, D. S., Braswell, A. E., Mietkiewicz, N., Balch, J. K., & Gutmann, M. (2020). Two centuries of settlement and urban development in the United States. Science Advances, 6(23), eaba2937. https://doi.org/https://doi.org/10.1126/sciadv.aba2937
- Leyk, S., & Uhl, J. H. (2018). HISDAC-US, historical settlement data compilation for the conterminous United States over 200 years. Scientific Data, 5(1), 1–14. https://doi.org/10.1038/sdata.2018.175
- Liu, X. H., Kyriakidis, P. C., & Goodchild, M. F. (2008). Population-density estimation using regression and area-to-point residual kriging. International Journal of Geographical Information Science, 22(4), 431–447. https://doi.org/https://doi.org/10.1080/13658810701492225
- Lo, C. P. (2001). Modeling the population of China using DMSP operational linescan system nighttime data. Photogrammetric Engineering and Remote Sensing, 67(9) , 1037–1047. https://www.asprs.org/wp-content/uploads/pers/2001journal/september/2001_sep_1037-1047.pdf
- Lu, D., Weng, Q., & Li, G. (2006). Residential population estimation using a remote sensing derived impervious surface approach. International Journal of Remote Sensing, 27(16), 3553–3570. https://doi.org/https://doi.org/10.1080/01431160600617202
- Manson, S., Schroeder, J., Van Riper, D., Kugler, T., & Ruggles, S. (2021). IPUMS national historical geographic information system: Version 16.0 [dataset]. Minneapolis, MN: IPUMS. https://doi.org/http://doi.org/10.18128/D050.V16.0
- Mennis, J., & Hultgren, T. (2005). Dasymetric mapping for disaggregating coarse resolution population data. In Proceedings of the Annual International Cartographic Conference, 22, 9–16. http://citeseerx.ist.psu.edu/viewdoc/download?doi=10.1.1.496.4768&rep=rep1&type=pdf
- Mennis, J., & Hultgren, T. (2006). Intelligent dasymetric mapping and its application to areal interpolation. Cartography and Geographic Information Science, 33(3), 179–194. https://doi.org/https://doi.org/10.1559/152304006779077309
- Mennis, J. (2003). Generating surface models of population using dasymetric mapping. The Professional Geographer, 55 (1) , 31–42. https://doi.org/https://doi.org/10.1111/0033-0124.10042
- Mennis, J. (2009). Dasymetric mapping for estimating population in small areas. Geography Compass, 3(2), 727–745. https://doi.org/https://doi.org/10.1111/j.1749-8198.2009.00220.x
- Morton, T. A., & Yuan, F. (2009). Analysis of population dynamics using satellite remote sensing and US census data. Geocarto International, 24(2), 143–163. https://doi.org/https://doi.org/10.1080/10106040802460715
- Reibel, M., & Bufalino, M. E. (2005). Street-weighted interpolation techniques for demographic count estimation in incompatible zone systems. Environment and Planning A, 37(1), 127–139. https://doi.org/https://doi.org/10.1068/a36202
- Sleeter, R. (2004). Dasymetric mapping techniques for the San Francisco Bay region, California. In M. J. Salling & G. R. Scott (Eds.), Proceedings of the Annual Urban and Regional Information Systems Association Conference,(Vol. 42, pp. 7–10). Urban and Regional Information Systems Association. https://www.researchgate.net/profile/Rachel-Sleeter-2/publication/228564837_Dasymetric_mapping_techniques_for_the_San_Francisco_Bay_region_California/links/00b7d52b878de4f391000000/Dasymetric-mapping-techniques-for-the-San-Francisco-Bay-region-California.pdf
- Stathakis, D., & Baltas, P. (2018). Seasonal population estimates based on night-time lights. Computers, Environment and Urban Systems, 68, 133–141. https://doi.org/https://doi.org/10.1016/j.compenvurbsys.2017.12.001
- Su, M.-D., Lin, M.-C., Hsieh, H.-I., Tsai, B.-W., & Lin, C.-H. (2010). Multi-layer multi-class dasymetric mapping to estimate population distribution. Science of the Total Environment, 408(20), 4807–4816. https://doi.org/https://doi.org/10.1016/j.scitotenv.2010.06.032
- Tapp, A. F. (2010). Areal interpolation and dasymetric mapping methods using local ancillary data sources. Cartography and Geographic Information Science, 37(3), 215–228. https://doi.org/https://doi.org/10.1559/152304010792194976
- Tenerelli, P., Gallego, J. F., & Ehrlich, D. (2015). Population density modelling in support of disaster risk assessment. International Journal of Disaster Risk Reduction, 13, 334–341. https://doi.org/https://doi.org/10.1016/j.ijdrr.2015.07.015
- Uhl, J. H., Leyk, S., McShane, C. M., Braswell, A. E., Connor, D. S., & Balk, D. (2021). Fine-grained, spatiotemporal datasets measuring 200 years of land development in the United States. Earth System Science Data, 13(1), 119–153. https://doi.org/https://doi.org/10.5194/essd-13-119-2021
- Wu, S., Qiu, X., & Wang, L. (2005). Population estimation methods in GIS and remote sensing: A review. GIScience & Remote Sensing, 42(1), 80–96. https://doi.org/https://doi.org/10.2747/1548-1603.42.1.80
- Xian, G., & Crane, M. (2005). Assessments of urban growth in the Tampa Bay watershed using remote sensing data. Remote Sensing of Environment, 97(2), 203–215. https://doi.org/https://doi.org/10.1016/j.rse.2005.04.017
- Zandbergen, P. A., & Ignizio, D. A. (2010). Comparison of dasymetric mapping techniques for small-area population estimates. Cartography and Geographic Information Science, 37(3), 199–214. https://doi.org/https://doi.org/10.1559/152304010792194985
- Zandbergen, P. A. (2011). Dasymetric mapping using high resolution address point datasets. Transactions in GIS, 15(s1), 5–27. https://doi.org/https://doi.org/10.1111/j.1467-9671.2011.01270.x