
ABSTRACT
Tactile cartography has always been a niche topic, but even among tactile cartographers, little attention has been paid to thematic tactile maps. Thematic maps are used in education and the lack of such materials makes it difficult to fulfill particular subjects’ curriculums. In this research, we propose a methodology for automatic compilation of legible and cartographically sound educational thematic tactile maps that bases on the concept of anchor layers and uses unequivocal parameters for generalization operators. Using such an approach we were able to automate the most complicated parts of the procedure that deal particularly with the generalization of geospatial data. We verify the proposed methodology by preparing a sample case study 3D printed map that is later evaluated by students with visual impairments. We also evaluate a novel approach of hybrid map production that consists of both graphic and tactile content. Our results suggest that the proposed methodology can be used for fast and repeatable production of fully fledged thematic tactile maps and that it forms a significant step toward completely automatic tactile maps development in the future.
1. Introduction
The difficulty of tactile maps development is related with lack of unequivocal guidelines, high costs, and specific requirements imposed by limited perception skills of the people with visual impairments (PVI) (Fleming, Citation1990; Stangl et al., Citation2019).
The perception limitations result from the fact that PVI read tactile maps using mainly the sense of touch, whose resolution is lower than the eye’s (Papadopoulos et al., Citation2018). Thus, less content can be fit on a single tactile map sheet than on its classic counterpart, and this content has to be greatly simplified or, using cartographic terms, generalized. Due to its subjectivity, generalization has always been one of the most complicated problems in cartography (Stoter et al., Citation2010).
One may think that less cartographic content on a given tactile map sheet means that less conflicts between features occur and thus, their redaction is easier. But if we consider the perception limitations of PVI along with the same information needs, it turns out that the generalization tasks on tactile maps are even more complicated. Tactile cartographers have to put as much content as possible on a single tactile map sheet on the one hand, and to make it legible on the other (Wabiński et al., Citation2020). In conclusion, a tactile cartographer, just like a classic cartographer, faces the problem of map content generalization but has other challenges, such as perception differences among individuals with visual impairments; numerous production methods with varying characteristics; or the need for tactile maps to be portable, durable, and washable.
Research on traditional maps generalization has been carried out for years. This includes developing generalization algorithms (e.g. Visvalingam & Whyatt, Citation1990; Weiss & Weibel, Citation2014), resolving graphic conflicts (Harrie & Sarjakoski, Citation2002; Mackaness, Citation1994) or automating orchestration of generalization algorithms (Brassel & Weibel, Citation1988; Cebrykow, Citation2017). With regard to tactile maps, only recently have the researchers tackled the issue of their generalization, but only in the context of orientation and mobility maps (e.g. Štampach & Muličková, Citation2016; Touya et al., Citation2018). To the best of our knowledge, no research on thematic tactile maps generalization has been carried out, and we aim to fill this gap.
In traditional cartography, especially topographic, the map preparation procedure, including the selection of the map content and its redaction, is usually standardized and accurately described (Foerster et al., Citation2013). Many countries have their own technical manuals detailing what and how should be presented on topographic maps that are often automatically developed on the basis of dedicated topographic databases (e.g. Davis et al., Citation2019; Ordnance Survey, Citation2004). Now, many of the principles developed to automate the production of topographic maps can be implemented in the process of thematic maps development (Raposo et al., Citation2020).
The last decade has brought an increase in research papers considering the automatic production of tactile maps (e.g. Barvir et al., Citation2021; Götzelmann & Eichler, Citation2016) but they focus mainly on production and technological aspects. Most of the existing solutions are based on unmodified geospatial data and do not consider proper cartographic generalization, which impacts the final products’ legibility and reduces repeatability of map compilation (Wabiński & Mościcka, Citation2019). Moreover, the issues related with tactile map compilation do not only concern generalization and production of physical copies. Numerous redaction rules affect tactile symbols design and their placement on a map sheet.
Even though some guidelines and good practices exist, they are inadequately described. Some of the possible reasons for such a state of affairs is the lack of cooperation between institutions issuing such guidelines and the excessive number of production techniques that have different limitations. Besides, the standardization is additionally complicated by the variety of sight disorders, different levels of tactile education, or even personal preferences of PVI.
All this makes tactile cartography a niche topic. National mapping agencies usually develop tactile maps production standards only for their own needs, without translation to other languages. In many countries, no official documents exist. In some cases, only collections of unofficial good practices provided by tactile map makers are available (e.g. Bris, Citation2001; Więckowska et al., Citation2012). Thus, tactile maps development is a difficult and time-consuming process. Their production is expensive, hard to systematize and standardize.
Fortunately, emerging production methods that allow fast prototyping, such as 3D printing, allow researchers in this field to verify new design approaches in a more efficient way (e.g. Gual et al., Citation2014; Holloway et al., Citation2019; Voženílek & Vondráková, Citation2015). Their application, along with the research on, at least partial, tactile maps development automation, creates possible conditions for their faster, cheaper, controllable, and repetitive production.
Therefore, our research aim was to develop a methodology for automatic compilation of legible and cartographically sound thematic tactile maps used in educational environments. Many of the existing solutions of automatic tactile map generation usually base on unmodified data and focus on orientation and mobility maps, whereas thematic maps are often neglected (Perkins, Citation2002; Wabiński & Mościcka, Citation2019). Thematic maps are used in schools as educational materials. The lack of such maps complicates the fulfillment of subjects’ curriculums. Our research aims at filling this gap and broadening the access to educational thematic tactile maps for both tactile and visual perception among students with visual impairments.
Bearing in mind our previous research in this area on information value of tactile maps (Wabiński et al., Citation2020), our proprietary design solutions increasing tactile maps legibility and/or information value (Wabiński, Śmiechowska-Petrovskij, & Mościcka, Citation2022), as well as our literature analysis in the field of automatic map development (Wabiński & Mościcka, Citation2019), we have posed the following research questions:
RQ1.
What procedures and rules allow automation and repeatability of the thematic tactile map development process?
RQ2.
Which steps in this process can be fully automated?
Finding answers to these research questions will largely fill the existing research gap by ensuring acceleration and repeatability of thematic tactile maps creation process, significantly contributing to the automation of tactile maps development and as a result, increasing their accessibility by PVI.
2. Methodology
2.1. Map development procedure
The proposed methodology is designed for semi-automatic development of small-scale tactile thematic maps by generalizing and adapting the open geospatial data. We assumed that defining the parameters of tactile symbols design and map content generalization, as well as a precise description of the procedure for the development of a selected type of tactile maps, will enable the automation of their creation and reproduction. This process greatly depends on the production method chosen but will make the whole process faster, cheaper and repetitive.
The main idea of our methodology is to first prepare a basemap that would remain unchanged across every map within a set, using so-called anchor layers, and then to adapt thematic content so that it fits to the basemap. We assume that all the maps within an atlas or a map set are in the same scale. If the scale is to be altered, one has to prepare separate generalization strategies for every basemap planned, by modifying the numerical parameters, considering the altered reference scale and, possibly, newly generated graphic conflicts.
The starting point for the presented methodology was a concept of the global master plan proposed by Ruas and Plazanet (Citation1997) that determines a general schedule of generalization actions to be taken that, in principle, remains unchanged regardless of the map’s target group or production method selected. The parameters of the global master plan should be tweaked and adapted depending on the map to be developed in the future generalization tasks, e.g. when mapping different phenomena. The following subsections describe the consecutive steps that form the master plan:
anchor layers selection and their hierarchization,
generalization constraints determination,
basemap development,
thematic content selection and its generalization,
symbolization and labeling.
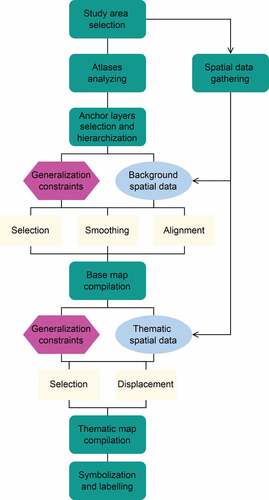
The methodology proposed can be used along with various map production techniques but for our case study map we decided to use 3D printing ().
Figure 1. The methodology applied on a case study map. In light yellow are the fully automatic processes.
2.1.1. Anchor layers selection and their hierarchization
First, one has to define the area to be mapped and select the data that would form anchor layers. These layers are meant to form a basemap and will be common for every map in a given thematic atlas or map series. Unlike thematic layers that present the map’s main topic, the base layers help the map reader to geographically contextualize the thematic content. In other words, they anchor the thematic layers into a representation of space that is known by the map reader.
Anchor layers, once generalized to a form legible by PVI, remain unchanged across different thematic maps of the same area and scale. Any additional thematic content has to fit these anchor layers. Such an approach facilitates the map reading process because a reader, once familiarizes himself/herself with the basemap, can focus only on the thematic content of the remaining maps in an atlas or map series.
The concept of anchors was introduced in spatial cognition to describe the landmarks that people use to anchor their mental representation of space (Couclelis et al., Citation1987). On a mental map, the places around one’s home are usually anchored by the location of this home. A similar concept is used in multi-scale cartography to describe the landmarks (not necessarily layers) that connect two maps at different scales (Touya et al., Citation2021).
In our methodology, only one scale is considered, but a similar vocabulary can be used. We define the important background layers as anchor layers. They are important in the context of a tactile atlas (or map series) because they appear on each of its maps facilitating perception of the thematic content.
The anchor layers should be generalized first but without a decent level of displacement and distortion to continue organizing and anchoring the remaining layers (Duchêne, Citation2014; Ruas & Plazanet, Citation1997).
One can arbitrarily choose the features forming anchor layers. Hydrographic features (oceans, seas, and rivers) or national borders are recommended as a primary choice (Grygorenko, Citation1970), but due to cultural specificity of maps in different parts of the world (Holloway et al., Citation2019), the selection of additional anchor layers might be problematic. In such cases, a more systematic approach could be used. One solution is to perform an analysis of the existing thematic atlases of the given study area, to see which layers are the most common, and use them as anchor layers.
After deciding upon the data to form the anchor layers, their hierarchy for generalization operations has to be set. As the stage of basemap development includes generalization of geospatial data, and as these data could have different geographical accuracy, some geometrical conflicts might occur. Thus, the hierarchy of anchor layers has to be set.
According to Grygorenko (Citation1970), the shorelines and rivers form a line between the two geographical environments: land and water. These features form a canvas of a map, based on which other features are mapped. For this reason, the geographical location and the level of detail of hydrographic features mapped must be precise. In the process of map development, such features are usually mapped first. All other anchor layers (e.g. national borders or cities) should then align with hydrography.
After the anchor layers and their hierarchy are determined, it is necessary to gather the geospatial data required for tactile map compilation – for both basemap and thematic content.
2.1.2. Generalization constraints determination
In our methodology, we considered different types of generalization constraints (as referred in Ruas & Plazanet, Citation1997): legibility (e.g. minimum point symbol size), spatial (e.g. maximum displacement of features), shape (e.g. alignment of two close line symbols), and semantic (e.g. the percentage of features to be preserved in the final dataset).
Considering the characteristics of tactile cartography, we have also followed the hierarchy of the constraint types in our methodology. In the case of tactile maps, legibility is the most important factor. In tactile cartography, it is sometimes even recommended to resign from adhering to the mathematical foundations of cartography in favor of increased legibility.
The spatial constraints maintain real-world topological relations on tactile maps, but at the same time, the maximum allowed displacements of features in tactile cartography are higher than in classic cartography. Finally, shape and semantic constraints should also be considered, but only to ensure adequate legibility of a tactile map.
Cartographic conflicts are configurations of the map symbols that either contravene the rules for a proper perception of the symbols or the design guidelines of the map (Mackaness, Citation1994; Touya, Citation2012). The tactile maps have three main sources of cartographic conflicts: the fact that tactile perception is less sharp than the visual perception (Klatzky & Lederman, Citation2003; Yanoff et al., Citation2009), the fact that they are thematic maps, with thematic layers on top of background layers (Duchêne, Citation2014), and the use of data from different heterogeneous sources. shows the different types of conflicts that we face designing thematic tactile maps, following the concept of anchor layers.
Table 1. Possible conflicts on thematic tactile maps.
The amount and nature of the conflicts occurring on a particular map depend mainly on the map’s topic and the data used but also on the generalization parameters applied. Enumeration of all possible parameters is not within the scope of this manuscript.
Although no holistic solution has yet been developed for automatic tactile map generation (Wabiński & Mościcka, Citation2019), a number of more or less official guidelines exist that facilitate determination of generalization constraints (e.g. Eriksson et al., Citation2003; The N.S.W. Tactual and Bold Print Mapping Committee, Citation2006; Więckowska et al., Citation2012).
2.1.3. Basemap development
Currently, we can benefit from an abundance of geospatial data available online. The problem is that these data can be messy. Another issue is that such raw geospatial data are not legible by PVI, so a decent level of generalization and adaptation is required.
To filter the original data and maintain only the most meaningful features to form an uncluttered basemap, various selection operations can be used. Selection by attributes and by location can be easily parametrized without considering particular generalization constraints.
Taking a systematic and numerical approach for the description of the generalization process allows its automation, but requires the determination of generalization constraints. Therefore, we defined the exact values for generalization constraints, such as maximum width of a line symbol or the optimal distance between two similar tactile symbols, to parametrize the whole process. These values base on the aforementioned existing guidelines for tactile maps development and our past experience in this field (Wabiński, Mościcka, & Touya, Citation2022). Such constraints allow obtaining repeatable results when working with different study areas and/or data. Our methodology involves a set of operations that can be carried out automatically after defining the generalization parameters.
To prevent linear features from being too detailed in the final map, line smoothing can be applied. Such an operation is of great importance in the case of tactile maps, as detailed polylines feel very unpleasant while touched.
The smoothing algorithm that we recommend to use is Polynomial Approximation with Exponential Kernel (PAEK). It uses a parametric continuous averaging technique to calculate the smoothed shape of the original linear symbol (Farin, Citation2002).
While generalizing the geospatial data, one must also consider topological relations that should be transferred from the real-world features into the designed map. For this reason, our methodology involves a number of alignments.
Since there are no explicit rules about the maximum distortions that can occur on tactile maps compared to the real-world features, the thresholds for the displacements can be selected arbitrarily to fulfill the original topological relations between features and maintain map’s legibility.
2.1.4. Thematic content selection and its generalization
Having a basemap that will remain unchanged across various maps in an atlas or map series, one can now add the thematic content. The main rule here is that all the additional thematic layers have to fit to the basemap content and not vice versa.
To fit thematic content to a basemap, additional generalization constraints are necessary. Apart from the constraints that govern the placement of features on a map (similar to those applied in the basemap development), one has to consider others that derive from the tactual perception limitations. For example, the maximum number of textures to be placed on a single tactile map is limited to 4–6 (Jesús Villalpando Esparza, Citation2014; Červenka et al., Citation2013), whereas the total number of distinct symbols should be limited to 10–15 (Rowell & Ungar, Citation2003).
Similar to the hierarchization of anchor layers, the priorities must also be set for the thematic layers. Two approaches can be taken here. The first is to consider the importance of particular thematic layers for the map’s comprehension and informativeness. The second is to begin with the layers, whose generalization would be the most laborious, considering, for example, their geometries – line and area symbols should be fit first.
The Python algorithm specifically written for this study adds additional parameters that determine the importance of particular thematic features to eliminate less important ones by applying a selection operator. The algorithm first counts the number of resources of a specific type (occurrences). Those with the least number of occurrences within a dataset (i.e. rare mineral resources) will be given higher priority during generalization – the algorithm will try to maintain them in the generalized dataset.
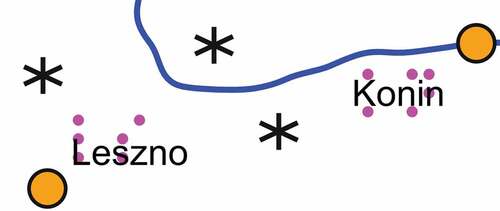
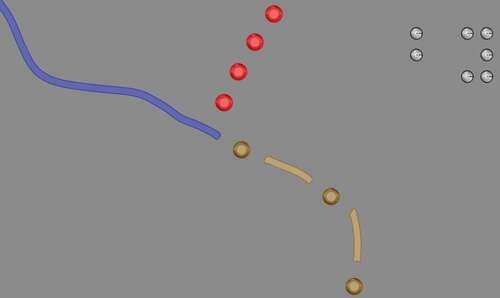
Then, for each feature in the dataset, in an iterative process, the number of conflicting features (conflicts) is counted. Those with the highest number of conflicting features will be given higher priority. Since the algorithm considers graphic conflicts, it is possible to set the desired dimensions of features to be considered including their size and the minimum horizontal distances between them ().
Figure 2. Feature priorities for generalization. Dashed lines represent proximity buffers and color represents feature type, e.g. red is coal and green is crude oil.
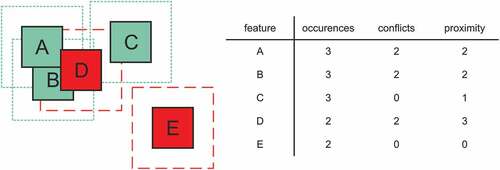
Lastly, even further proximity of every feature is considered – a number of features falling within a specified buffer around a given feature are counted (proximity). The lower the value of this attribute, the higher the priority of the feature in the generalization process – the algorithm will try to maintain more isolated features in the generalized dataset.
The algorithm then uses these values to eliminate conflicting features based on the priorities assigned. It also considers the input parameters – the reference scale, symbol dimensions, and the minimum horizontal distances between them.
The approach that we describe here for thematic content generalization was designed specifically for point geometry but could be easily modified to work with other geometry types if considered along with the other possible conflicts. For example, if the thematic content would be in the form of area symbols, additional steps of lines smoothing (similar to those described for basemap development) could be applied prior to the elimination of the irrelevant features.
Because this algorithm only considers conflicts between features within the thematic layer, we also had to handle conflicts with features forming a basemap. The resulting base and thematic features were exported and further processed in the CartAGen platform – an open-source platform designed for research in map generalization (Touya et al., Citation2019).
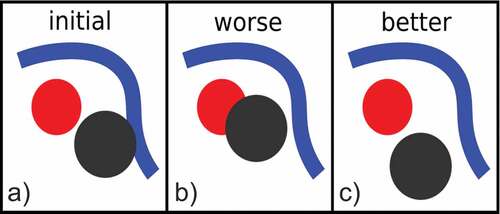
We used a displacement algorithm available on the platform, called random iterative displacement. It is based on an iterative process that tries to minimize the total number of symbol overlaps in the dataset. At a given iteration, the symbol that overlaps most of its neighbors is chosen and randomly displaced. If the overlap is the same or worse, the displacement is backtracked; else the displacement is validated and another symbol is chosen and displaced ().
Figure 3. Principles of the random iterative displacement algorithm. When the displacement worsens the symbol overlaps b), compared to the initial state a), it is backtracked. When it gets better c), it is validated and another symbol is chosen and displaced.
2.1.5. Symbolization and labeling
Although the final symbolization is applied at the end of the map development process, one has to take into account all the related constraints in advance. First, the minimum dimensions of symbols should be used as a parameter in the generalization step and the final symbology has to comply with the previously used constraints.
At this point also the maximum number of distinct symbols on a single tactile map sheet should be considered. Moreover, one has to decide, whether the final map would consist of only the tactile content suitable for tactile exploration, or also highly contrasting graphic elements for those with residual vision. These two content types could be merged to form a hybrid map. When symbolizing and labeling, they should be considered separately due to the differences between visual and tactual perception.
Just like in classic cartography, when designing symbols for PVI, the most important rule to follow is that the symbols should resemble the real-world objects they represent on a map. The problem is that complicated pictorial symbols are only meaningful to those adventitiously blind and partially sighted (Wiedel & Groves, Citation1969). Besides, tactile symbols should be as simple as possible but also ought to be differentiated along as many tactual dimensions as possible (Nolan & Morris, Citation1971).
A number of works describe recommended sets of legible symbols that can be used on tactile maps (e.g. BANA and the CBA, Citation2010; James, Citation1975; Nolan & Morris, Citation1971). The general rule of thumb is that the simpler the geometries and the bigger the distances between symbols, the more legible the map is. Unfortunately, at the same time, many of PVI prefer small portable maps (Rowell & Ungar, Citation2003), leaving tactile cartographers with limited space.
The final design step is to label the mapped features and prepare the final layout. When preparing a hybrid map, two types of labels have to be placed. Based on the guidelines and good practices in terms of inscriptions design (e.g. Edman, Citation1992; ISO, Citation2013), black print labels for readers with residual vision should use regular 14–18 pt sans-serif fonts to represent full names of the features described.
Because braille labels take much more space than the regular ones, abbreviations are commonly used for describing features using braille – usually 2–3 cell codes. Braille labels should follow particular standards in terms of elements’ dimensions, e.g. Marburg Medium (Więckowska et al., Citation2012).
When preparing tactile maps layouts, the rules are similar to those in classic cartography. Map miscellanea should be grouped together, usually in the top-left corner. A legend should be separated from the map sheet using solid thick lines, and it should explain all the abbreviations used on a map (ISO, Citation2016; Wiedel & Groves, Citation1969).
2.1.6. Map printing and its evaluation
The production method should be selected prior to the map development process as the map preparation guidelines might refer to particular methods that have their unique requirements, which greatly affects the parameters to be used in the generalization process.
The map production process might include, for example, proper coloring, scaling, extrusion to a 3D model, matrix preparation, and so on. Moreover, many production methods require post-processing to assure durability as well as proper physical and chemical properties of the final products.
Many of the solutions developed for people with special needs, including tactile maps, are only tested in laboratories and lack feedback from the end users (Albouys-Perrois et al., Citation2018; Elli et al., Citation2014). For this reason, it is necessary to perform product evaluation that would allow tweaking the proposed solutions and verify its utility in the real-world conditions. Even though this paper focuses on the conceptual work, we have decided to perform a non-systematic evaluation of our final product among students from the secondary school for children with visual impairments.
2.2. Case study map
To verify the proposed methodology, we decided to prepare a case study map. The map’s topic is the occurrences of mineral resources in Poland. Considering the map’s geographic extent and the requirements related with the suggested tactile maps formats (Bentzen, Citation1980; Edman, Citation1992), we decided to prepare a 3D printed map in 1:2,000,000 scale. This value then served as a reference scale in the generalization process.
Because we wanted the final physical map to be accessible to both tactual and visual perception, every feature on the case study map is presented in two ways: in graphic and tactile form. Thus, the map consists of two layers: a colored, flat underprint printed on regular paper (graphic map) and a transparent 3D tactile overprint prepared using resin 3D printing (tactile map).
2.2.1. Atlas analyses
In order to appropriately select the layers forming a basemap, we have decided to follow the suggested systematic approach of analyzing the existing geographic atlases. We analyzed two atlases. Both comply with the curriculum of geography for Polish primary schools. The first of them was the geographical atlas used in Polish secondary schools (Cacopulos et al., Citation2020). Even though the atlas consists of maps of the whole world, we have only considered maps representing Poland.
The second was the tactile atlas for children with visual impairments (GUGiK, & PZN, Citation2004), widely used in special schools in Poland. In this atlas only maps of Poland are published.
2.2.2. Hierarchization of the anchor layers
In our case study map, we have given hydrography the highest priority. Next, we mapped the country borders since many of them align with natural borders like rivers. Lastly, cities were aligned with the hydrography and borders layers to maintain topological relations with these features.
Once the anchor layers are drawn, they cannot be altered. For this reason, any thematic content added had to adapt (by applying appropriate generalization and redaction) to the basemap. In this case, we mapped places, where particular mineral resources are being extracted in the form of point symbols representing different types of the resources. By maintaining the layers on basemaps unchanged when adding the thematic content, we obtained a universal reference for every future map in an atlas or map series.
2.2.3. Generalization procedure
In the process of map generalization and redaction, we wanted to consider the possible conflicts described in section 2.1.2. Smoothing and alignment operations required us to follow particular numerical parameters based on the existing tactile maps design guidelines. Our methodology assumes these operations to be carried out automatically, so we needed to extract specific generalization parameters from the literature (). These parameters were implemented and described in the Results section along with the selected reference scale.
Table 2. Generalization parameters implemented in our case study map.
presents other parameters we followed that are not directly related with generalization but impact the final map’s legibility.
Table 3. Design parameters implemented in our case study map.
In our case study map, the mineral resource layer (thematic content) contains only one additional attribute, apart from the spatial ones. It determines the type of mineral resource, e.g. coal.
After the selection procedure using the proprietary Python algorithm, the displacement procedure has been carried out in CartAGen. This step only displaced the features without affecting the numbers and shapes of the features with one exception – the enhancement of the Hel Peninsula.
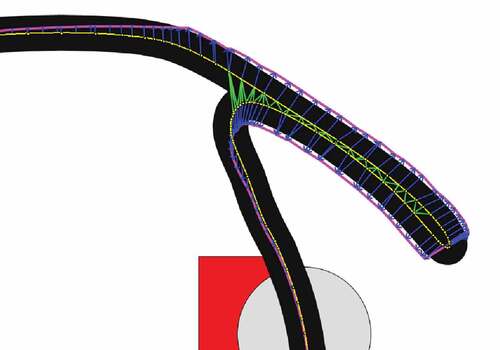
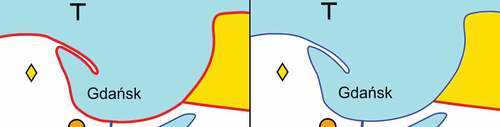
The Hel Peninsula is a very narrow strip of land in northern Poland that is greatly enlarged on maps due to its importance in orientation. The vertices forming its geometry have been moved away using the least squares algorithm, with a principle similar to the embankment distortion (Touya & Lokhat, Citation2021) to enlarge it on the final map ().
Figure 4. Displacement of lines forming the Hel Peninsula for its enhancement. The original geometry is marked in yellow, the generalized one in magenta.
For the features displacement in CartAGen, the following assumptions were made. Rivers were symbolized as 0.8 mm thick solid lines, whereas borders were symbolized as dotted lines (2 mm dot with 2 mm gap), to which inland seawater (solid area symbol) and cities (5 × 5 mm circles) were aligned.
Since the physical copy of our case study map would have height differentiation of symbols applied, the minimum horizontal distances between particular symbols were set to 2 mm. All the thematic features, whose geometry was set to 5 × 5 mm squares for the purpose of the proprietary Python algorithm, were then displaced considering the parameters given above.
2.2.4. Data used
To develop our case study map, we needed geospatial data representing rivers, cities, water reservoirs, and borders that would form a basemap and a point thematic layer representing mineral resources ().
Table 4. Data sources for the case study map.
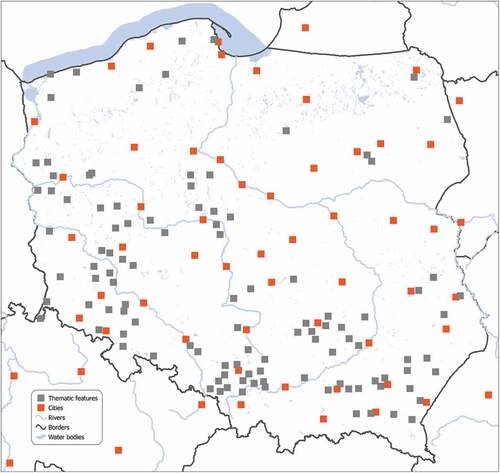
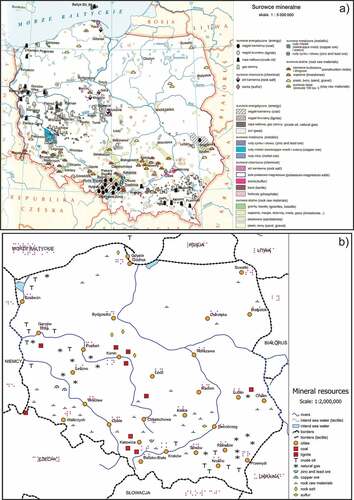
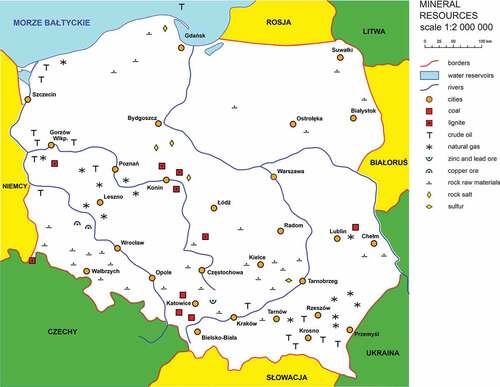
In case of country borders, we obtained the Polish national border data from the open-source dataset but had to vectorize borders of the neighboring countries on a georeferenced raster map. The input data is presented on the map in .
Figure 5. The non-generalized, original data on a map.
3. Results
3.1. Anchor layers selection – atlases analyses
In the first analyzed atlas (Cacopulos et al., Citation2020), there were four layers that appeared on each of the 46 analyzed maps: cities (point symbols and inscriptions), rivers (line symbols and inscriptions), border of Poland (line symbol), and main lakes (area symbols). Some other features appeared on almost every of the analyzed maps: borders of the neighboring countries (line symbols and inscriptions) and the Baltic Sea (area symbol and inscription).
In the second atlas (GUGiK, & PZN, Citation2004), some features appear on every map: five main cities (point symbols and inscriptions), the Vistula river (line symbol), border of Poland (line symbol), and the Baltic Sea (area symbol and inscription). On maps in a bigger scale (1:2,500,000), additional features are presented: four cities (point symbols and inscriptions) and six rivers (line symbols and inscriptions).
Based on this analysis, we had selected the layers that formed a basemap for our case study: main rivers, major cities, inland seawater, borders of Poland, and neighboring countries. In the first iteration, we also included major lakes, but they introduced unnecessary clutter and we decided not to map them.
3.2. Map development process
3.2.1. Generalization procedure
Knowing the final map scale, we were able to calculate the exact numerical values of the generalization parameters to be used in our map development process. The procedure described below has been carried out in ArcGIS software, using the Model Builder module for automatic generation of the basemap.
For the generalization of water reservoirs, we have used the selection by attributes to select only the inland seawater out of the entire dataset. We then applied the area feature smoothing using PAEK with a 20 km threshold set.
In the case of rivers layer, we have first selected the rivers longer than 100 km that flow through Poland by using attribute and location queries, respectively. Next, we applied PAEK smoothing with a 20 km threshold. The rivers were then aligned (5 km threshold) to the inland seawater features to comply with the real-world topological relations.
For cities layer, we have first selected the cities that could be presented on each of the maps in a designed atlas (those in Poland with population over 200,000) and later enhanced this group by those important in the context of our case study map’s topic – those that are within a distance of 20 km from the features in the original thematic content dataset (mineral resources). Finally, the cities were aligned with rivers to maintain topological relations (10 km threshold).
Next, the thematic content was generalized and later fitted to the basemap. The original thematic class consisted of 111 point features. After running the algorithm, 79 features remained ().
Figure 6. Count of features in the thematic layer before and after the generalization process.
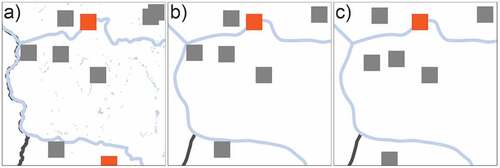
The data were then exported to CartAGen for the additional generalization steps described in the methodology section and finally imported back to ArcGIS for the purpose of symbolization and labeling ().
Figure 7. The effect of consecutive generalization steps shown on a map fragment - a) original data; b) data after selection, smoothing and alignment carried out automatically in ArcGIS; c) final data with additional selection and displacement applied in CartAGen.
3.2.2. Symbolization and labeling
Symbology was applied to the generalized data. The data were then labeled using the Maplex Label Engine. The fact that we decided our case study map to be a hybrid map, containing both graphic and tactile content, greatly affected two feature types on it.
First, the dimensions of inland seawater features, meant to be symbolized as area symbols, turned out to be too small for tactile perception. Thus, these features are presented as area symbols on the graphic map but take the form of a raised outline representing shorelines of these features on the tactile map. All the other symbols were prepared in accordance with the existing guidelines and good practices and base on one of the existing tactile maps presenting the same phenomena (Olczyk, Citation2022).
Second, the map has two label types for each labeled feature: large black print Latin labels on the graphic map and raised braille dots on the tactile map. Because the tactile overprint is transparent, it was possible to overlay the two discussed label types ().
Figure 8. Two types of labels overlap for space saving. Black print labels contain full names, whereas braille inscriptions take the form of 2-cell abbreviations.
Labels are used on the map to describe cities and neighboring countries. Black print labels use regular 14 pt Arial font to represent full names of the features described.
For tactile labels, 2-cells braille abbreviations were used to describe cities and the neighboring countries (full names were used wherever possible). All of the abbreviations are described in the legend. Braille labels were prepared using 24 pt regular RNIB Braille font (Royal National Institute of Blind People, Citation2022), whose dimensions comply with the Marburg Medium Braille Font Standard. A map automatically generated in ArcGIS with symbology applied is presented in .
Figure 9. The comparison of map from a) the classic atlas (Cacopulos et al., 2019) and b) the final symbolized map with all the content in graphic form.
The final graphic map variant consists of five layers: rivers, inland seawater, borders, cities, and mineral resources. On the tactile map, we have introduced an additional symbol – shoreline, to represent outlines of the inland seawater features. The same symbol represents the border between countries and the Baltic Sea to eliminate ambiguity related with the actual administrative borders of countries that run 12 nautical miles into the sea. On the graphic map, we have obtained a similar result by eliminating the border symbol part along the Baltic Sea shoreline ().
Figure 10. Modification of the border symbol along the shoreline to eliminate ambiguity.
The mineral resources extracted in Poland have been grouped into nine types. This results in 1 area, 2 lines, and 10 point symbol types on the graphic map, and 4 lines and 10 point symbol types on the tactile map. The extra line symbol type is a result of a slightly modified representation of borders on rivers on a tactile map ().
Figure 11. The additional line symbol of border on river on tactile map variant. River is blue, border is red and border on river is brown.
Finally, we generated the map’s title, legend, and linear scale according to the guidelines (Edman, Citation1992).
3.2.3. Preparation for printing
This section briefly describes the procedure of the minor manual edits that we carried out as well as the transformation of the flat vector map into a tactile model suitable for 3D printing.
The automatically generated map has been imported into Corel software. Although our automatic approach has left us with acceptable results, we decided to perform some final attunements manually to improve map’s legibility. First, we eliminated from the map one of the cities (Gdynia) that is usually not represented on small-scale maps of Poland due to its proximity to another major city – Gdańsk. We also deleted two rivers introducing unwanted clutter that usually do not appear on such maps: Neman and Mukhavets. Next, we had to displace some of the labels that the Maplex Engine failed to properly arrange. Finally, we applied colors to the polygons representing neighboring countries to increase the contrast of the graphic map ().
Figure 12. The final design of the graphic map variant.
The flat vector map has been uploaded into the 3D modeling software and raised to a 3D form according to the previously verified methodology (Wabiński, Citation2017).
To increase the map’s legibility, particular symbols have been raised to different heights based on the recommendations (ISO, Citation2019). Thus, the shoreline symbol has been raised to 0.3 mm, rivers and borders to 0.9 mm, all the point symbols to 1.5 mm, and braille dots to 0.7 mm.
Next, we added the orientation element in the form of a convex triangle in the top-right corner of the map sheet and prepared the tactile variant of the map legend as well as the list of all abbreviations used on the map as separate geometries.
The map sheet and legend were then exported as a 3D mesh and further processed in ChituBox slicing software. The tactile overprint map itself and the legend were printed using stereolithography 3D printing with transparent resin on the Sonic Mega Phrozen printer (). To cut the production costs and time, we decided to print the list of abbreviations using the swell paper method.
Figure 13. The stereolithography printing process using transparent resin.
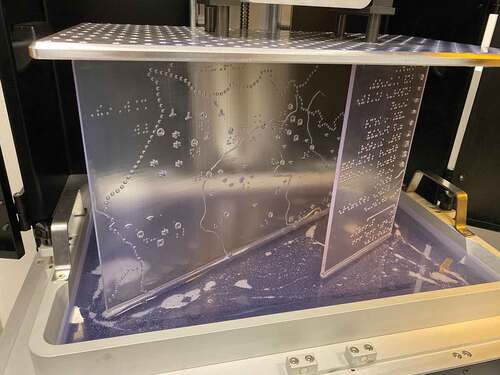
The fact that we wanted the map to be printed in one piece and the limited dimensions of the printer’s build plate required a specific arrangement of the map sheet on the printer’s build plate that dramatically increased the printing time, which lasted around 70 hours. We used approximately 500 ml resin. The printing time can be reduced to a few hours when using a different placement strategy and/or printing device.
Next, we post-processed the physical copy of the tactile map by cleaning it and solidifying it using the UV lamp. To protect the resin’s properties (e.g. prevent color change) and increase its transparency, we have also coated the elements with transparent UV resistant acrylic paint.
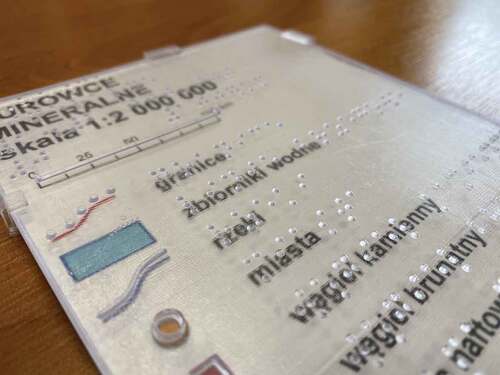
Finally, we assembled the tactile map with the graphic map previously printed using a color plotter and regular paper using specially designed clamps to form a hybrid map (). The final map’s dimensions are 36 by 34 cm, and the corresponding legend is 12 by 19 cm.
Figure 14. Assembled map legend fragment. Transparent tactile layer visible over the graphic underlay.
3.3. Map evaluation
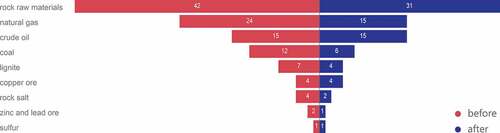
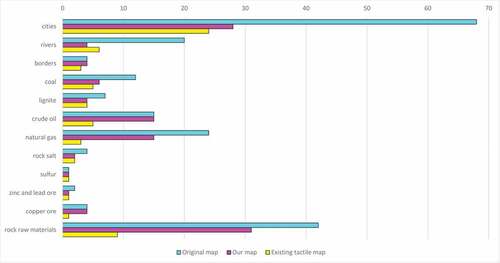
To better visualize how strong the generalization has to be in order to maintain tactile maps legibility, we have calculated the occurrences of particular symbol types on different map variants: the original one from the classic atlas (Cacopulos et al., Citation2020), the map that we generated using the presented methodology and the existing tactile map developed back in 2004 (GUGiK, & PZN, Citation2004). It is worth noting that on the original map, unlike on the tactile maps discussed, rock raw materials were divided into four separate categories. Apart from the symbol types shown in the graph (), the original map also presented lakes and areas of occurrence of particular mineral resources (cf. ) that are not included in the tactile maps discussed.
Figure 15. The occurrences of particular symbol types on the analyzed map variants.
The prepared map’s utility and usability has been verified among 13 students of the first (nine pupils) and second (four pupils) classes aged 16–18 of the Secondary School for students with visual impairments in Laski (Towarzystwo Opieki nad Ociemniałymi w Laskach, Citation2022). Eight of the students had residual vision and evaluated both – the tactile and graphic contents of the map.
The non-systematic tests aimed at simulating working with a map during geography class. Students were asked to count the number of places, where particular resources are extracted (Task 1), indicate locations of extraction sites of various mineral resources in Poland (Task 2), and to describe shapes and colors of thematic symbols used on the map (Task 3). Not every student was asked to solve all the three tasks as during the map’s evaluation process we were limited by the length of two lesson units (one for each class). We used the previously prepared map evaluation form to evaluate success rates of each spatial task and gather the participants’ feedback on map use comfort and possible amendments of the map sheet presented. The qualitative feedback was not formally analyzed.
Task 1, e.g. count the number of sites, where coal is extracted, was solved by pupils at a success rate of 75%. The reason, why the rest of the pupils failed this task, was that they mistook symbols they were looking for with the similar ones, e.g. coal and lignite. Task 2, e.g. what resource is being extracted south-east from Warsaw, was accurately solved by 78% of pupils. The same score was achieved for Task 3, e.g. describe the shape of a symbol representing sulfur. The last result cited applies only to the tactile form. Students had troubles describing the colors used for graphic representation of symbols.
The tactile content was rated as legible and comfortable to use. The material used for tactile map production was evaluated as more rigid and with sharper edges than on the maps commonly used in this school, i.e. official tactile maps occasionally issued by the Head Office of Geodesy and Cartography (e.g. Główny Urząd Geodezji i Kartografii & Polski Związek Niewidomych, Citation2006) that are characterized by softer tactile content due to the characteristics of the production methods used by them, e.g. thermoforming and swell paper.
But the vast majority of the study participants (83%) liked this feature as “it facilitated distinguishing particular symbols.” All the symbols were tactually distinguishable, even those that are mirror reflections of each other.
However, the graphic content designed for reading using residual vision was more problematic. Five of the eight students evaluating the graphic map had troubles reading the map’s content. They pointed out that the black print labels are too blurry and that the point symbols are too small – the colors applied were illegible.
The same students suggested some possible amendments that could improve the legibility. Point symbols should be bigger, and braille labels should not overwrite the black print labels – they should be placed next to each other so that the shades and light reflections caused by braille dots would not interfere with the graphic content.
The remaining three students who evaluated the graphic content were able to solve the tasks presented and distinguish colors used on the map. Two of these students were using magnifiers with additional light sources when working with the map.
4. Discussion
Our methodology is divided into a number of steps that form a parametrized pipeline and allow developing thematic tactile maps faster, cheaper, and assure their reproducibility. The case study presented proved its applicability for 3D printed hybrid tactile map used in educational setting, but we assume that it can also be used in different contexts.
The procedure adopted and rules on which each methodology step is based bring a direct answer to the RQ1. Adopting the anchor layers concept and establishing their hierarchy to form a repeatable background for a series of maps or thematic atlas reduces the time necessary for their development and ensures the repeatability of the base content. This solution also makes it easier for PVI to read the map, as they can focus on the thematic content.
With stable background, only the thematic content changes, so the newly emerging conflicts apply only to the thematic content. The amount of possible conflicts solutions is limited, which simplifies the map development process.
The methodology proposed can be used in two possible ways: developing tactile maps as a transcription of the existing visual maps, as well as a translation of the raw geospatial data into the form of tactile maps comprehensible by PVI. Whatever the approach, background, and thematic data can be distinguished. Background content can be created in exactly the same way regardless the approach taken. In the first case, thematic content is generalized directly from the original map – the content selection should be done earlier, during the original map creation, and it only has to be adjusted into the form legible by PVI.
In the second case, the procedure is a more complex task that includes generalization and adaptation. Using our methodology, it can be simplified by dividing it into two steps: traditional thematic content preparation (which is adequately described in the literature), and its generalization into a legible form (automated in our methodology).
Our results show that some steps of the proposed methodology can be fully automated. They are related strictly with the generalization process, i.e. selection, smoothing, alignment, and displacement. These operations must be based on unequivocal parameters. Such parameters are widely discussed in the literature as the standardization of these processes is the most desirable. This provides the answer for the RQ2 – processes of selection, smoothing, alignment, and displacement can be fully automated.
Although not fully automatic at this point, steps of anchor layer selection, their hierarchization, map symbolization, and labeling have been profoundly described, leaving a reader with a number of rules and parameters that could be followed when developing similar tactile maps in the future. For instance, to create a similar atlas for France, the anchor layers would be similar although the selected rivers and cities would be different. There might be a layer representing mountains instead of water bodies as they are more anchoring in French geography.
The approach of using anchor layers could be used not only in thematic atlases but also in situations where a lot of content is not suitable to fit onto one map sheet. One possible solution in such a scenario is to divide the map into fragments and produce a few map sheets presenting the phenomena in a larger scale. But since the discontinuities generated might reduce the readability, a better solution is to create several maps of the same area with a higher level of generalization applied that share the common reference layers but have different thematic content presented on each map sheet (Edman, Citation1992).
When developing maps at different scales, of different areas, and/or using different production methods, the choice of algorithms would be somehow specific, but the overall methodology involving the global master plan seems applicable to generate various tactile maps or atlases.
For maps on larger scales, one has to deal with more area features, whereas at smaller scales, it might be necessary to conduct more radical feature simplification, even including the schematization of borders. Involving maps at various scales in a single generalization process seems to be the most complex task at this point.
When using the proposed methodology along with other than the discussed production methods, the basic assumptions of the global master plan would remain unchanged, but it would be necessary to consider the selected production method characteristics that might require different map redaction approach. For example, if the production method does not allow height differentiation of tactile signs, e.g. swell paper method, it might be necessary to increase the minimum horizontal distances between symbols. If the method selected would not allow obtaining transparency of the tactile layer, preparing a hybrid map might not be possible. The redaction parameters would have to be tweaked even when using different techniques within a 3D printing domain. For example, methods using thermoplastics are characterized by lower resolution capabilities than stereolithography. For this reason, map elements would have to be bigger and geometrically less complex.
5. Conclusions
This article presents a complete methodology for thematic tactile maps development and presents a case study confirming the validity of our proposal for educational tactile maps used in schools for children with visual impairments. The methodology can be easily parametrized and modified for future use for different user groups, in different contexts and using different production methods.
The results demonstrate the correctness and usefulness of the proposed methodology. It is possible to semi-automatically prepare a hybrid thematic tactile map, legible both using the sense of touch and/or damaged sight.
It should be used along with tactile maps development guidelines designed for specific production methods in order to accurately extract the necessary generalization parameters. We aimed at making this methodology as universal and automatic as possible but identified certain limitations while preparing a case study map that we want to handle in our future research.
The assumptions made in our Python algorithm caused some important natural resources to disappear from the final map. Additional iterations with different map topics would allow us to tweak the algorithm to perform more accurate selections of features.
Due to the limited space on the designed map sheet, some of the labels appeared too close to other features. In one case, we were unable to fit the full name of a neighboring country. We could either consider using a printing device with a larger build plate or split the map sheet into parts so that maps in a bigger scale could be produced.
At this point, the methodology requires the involvement of a number of software programs, which causes compatibility issues. We believe that the conversions and transfers between software could also be automated and scripted, forming sort of a black box for the final user.
Future research might also consider the automation of the 3D map development, i.e. the transfer from a flat vector drawing of a map to a printable solid.
The feedback obtained during the map evaluation phase would help us improve the maps produced in the future. No students complained about too little distances between particular symbols on the map, which once again confirms the hypothesis from one of our previous research (Wabiński, Śmiechowska-Petrovskij, et al., Citation2022). In the future, we would like to verify, whether the presented methodology would be useful for creating maps for adults by conducting a systematic human subject testing.
The students indicated that the map format is appropriate and that “it could even be bigger.” We could possibly increase the map’s scale to make the symbols bigger, thus improving legibility of the graphic content.
We have also scheduled additional trials to avoid the blur effect caused by inappropriate cleaning of the map sheet used in the evaluation process. This includes evaluating various printing materials and post-processing methods that we aim to describe in future research papers. This could resolve the legibility issues of the graphic underlays in the future maps.
We believe that the methodology presented in this paper forms another step toward making tactile maps development process automatic, broadening the access to tactile materials among PVI, and equalizing the accessibility to open public information.
Acknowledgements
The authors would like to express their sincere gratitude to Anna Chojecka and the pupils of the Society for the Care of the Blind in Laski who took part in the map evaluation phase.
Disclosure statement
No potential conflict of interest was reported by the author(s).
Data availability statement
The resulting maps in the form of both 3D models and flat vector drawings, as well as the Python algorithms used for basemap and thematic data generalization are available at the dedicated repository: https://github.com/JakubWabinski/ThematicTactileMaps. The CartAGen plugin repository is available at https://github.com/IGNF/CartAGen.
Correction Statement
This article has been corrected with minor changes. These changes do not impact the academic content of the article.
Additional information
Funding
References
- Albouys-Perrois, J., Laviole, J., Briant, C., & Brock, A. (2018). Towards a multisensory augmented reality map for blind and low vision people: A participatory design approach. CHI’18 - CHI Conference on Human Factors in Computing Systems, 1–14. https://doi.org/10.1145/3173574.3174203
- BANA and the CBA. (2010). Guidelines and Standards for Tactile Graphics. http://www.brailleauthority.org/tg/
- Barvir, R., Vondrakova, A., & Brus, J. (2021). Efficient interactive tactile maps : A semi-automated workflow using the touchit3d technology and openStreetmap data. ISPRS International Journal of Geo-Information, 10(8), 505. https://doi.org/10.3390/ijgi10080505
- Bentzen, B. L. (1980). Orientation aids. In R. L. Welsh & B. B. Blasch (Eds.), Foundations of orientation and mobility (pp. 291–355). American Foundation for the Blind.
- Brassel, K. E., & Weibel, R. (1988). A review and conceptual framework of automated map generalization. International Journal of Geographical Information Systems, 2(3), 229–244. https://doi.org/10.1080/02693798808927898
- Bris, M. (2001). Guide de l’acheteur public de produits graphiques en relief a l’usage des personnes deficientes visuelles. Ministere de l’economie des finances et de l’industrie. https://www.economie.gouv.fr/files/directions_services/daj/marches_publics/oeap/gem/ARCHIVE-5730/5730.pdf
- Cacopulos, M., Curyło, S., Jakubiak, J., Kluczek, W., Lipowicz, A., Mazur, C., …Zaręba, K. (2020). Atlas geograficzny: Polska, kontynenty, świat (1st ed.). Nowa Era Sp. z o. o.
- Cebrykow, P. (2017). Cartographic generalization yesterday and today. Polish Cartographical Review, 49(1), 5–15. https://doi.org/10.1515/PCR-2017-0001
- Červenka, P., Hanouskov, M., Másilko, L., & Nečas, O. (2013). Tactile graphics production and its principles. Teiresiás – Support Centre for Students with Special Needs. https://www.teiresias.muni.cz/download/tactile-graphics.pdf
- Couclelis, H., Golledge, R. G., Gale, N., & Tobler, W. (1987). Exploring the anchor-point hypothesis of spatial cognition. Journal of Environmental Psychology, 7(2), 99–122. https://doi.org/10.1016/S0272-4944(87)80020-8
- Davis, L. R., Fishburn, K. A., Lestinsky, H., Moore, L. R., & Walter, J. L. (2019). US topo product standard. U.S. geological survey standards book 11, collection and delineation of spatial data (2nd p. 20). USGS. https://doi.org/10.3133/tm11b2
- Duchêne, C. (2014). Making a map from “thematically multi-sourced data”: The potential of making inter-layers spatial relations explicit. ICA Workshop on Generalisation and Multiple Representation. https://kartographie.geo.tu-dresden.de/downloads/ica-gen/workshop2014/slides/2014_ICAGeneWorkshop_duchene.pdf
- Edman, P. K. (1992). Tactile graphics. American Foundation for the Blind.
- Elli, G. V., Benetti, S., & Collignon, O. (2014). Is there a future for sensory substitution outside academic laboratories? Multisensory Research, 27(5–6), 271–291. https://doi.org/10.1163/22134808-00002460
- Eriksson, Y., Jansson, G., & Strucel, M. (2003). Tactile maps - guidelines for the production of maps for the visually impaired. The Swedish Braille Authority. https://www.mtm.se/link/1caca9f551814f268f1eb3d9c3dad23e.aspx
- Farin, G. E. (2002). Curves and surfaces for CAGD : A practical guide (5th ed.). Morgan Kaufmann. https://doi.org/10.1016/B978-1-55860-737-8.X5000-5
- Fleming, L. (1990). Tactual mapping. In C. Perkins & R. Parry (Eds.), Information sources in cartography (pp. 409–422). Bowker.
- Foerster, T., Stoter, J., & Kraak, M.-J. (2013). Challenges for automated generalisation at European mapping agencies: A qualitative and quantitative analysis. The Cartographic Journal, 47(1), 41–54. https://doi.org/10.1179/000870409X12525737905123
- Główny Urząd Geodezji i Kartografii, & Polski Związek Niewidomych. (2006). Atlas geograficzny Europy. Tyflograf. https://tyflomapy.pl/Atlas_Geograficzny_Europy.html
- Götzelmann, T., & Eichler, L. (2016). Blindweb maps – an interactive web service for the selection and generation of personalized audio-tactile maps. In K. Miesenberger, C. Bühler, & P. Penaz (Eds.), Computer helping people with special needs. ICCHP 2016. Lecture notes in computer science (Vol. 9759, pp. 139–145). Cham: Springer https://doi.org/10.1007/978-3-319-41267-2_19
- Grygorenko, W. (1970). Redakcja i Opracowanie map ogólnogeograficznych. Państwowe Przedsiębiorstwo Wydawnictw Kartograficznych.
- Gual, J., Puyuelo, M., & Lloveras, J. (2014). Three-Dimensional tactile symbols produced by 3D printing: Improving the process of memorizing a tactile map key. The British Journal of Visual Impairment, 32(3), 263–278. https://doi.org/10.1177/0264619614540291
- GUGiK, & PZN. (2004). Atlas geograficzny Polski. Tyflograf. https://tyflomapy.pl/Atlas_Geograficzny_Polski.html
- Harrie, L., & Sarjakoski, T. (2002). Simultaneous graphic generalization of vector data sets. GeoInformatica 2002 GeoInformatica 2002, 6(3), 233–261. https://doi.org/10.1023/A:1019765902987
- Head Office of Geodesy and Cartography. (2022a). Database of general geographic objects (BDOO). Retrieved January 12,2022, from https://www.geoportal.gov.pl/en/dane/baza-danych-ogolnogeograficznych-bdo
- Head Office of Geodesy and Cartography. (2022b). National register of boundaries. Retrieved January 12, 2022, from https://www.geoportal.gov.pl/en/dane/panstwowy-rejestr-granic
- Heath, W. R. (1958). Maps and graphics for the blind: Some aspects of the discriminability of textural surfaces for use in areal differentiation. University of Washington.
- Holloway, L., Marriott, K., Reinders, S., & Butler, M. (2019). 3D printed maps and icons for inclusion: Testing in the wild by people who are blind or have low vision. In J. Bigham, S. Azenkot, & S. Kane (Eds.), ASSETS 2019 - 21st International ACM SIGACCESS Conference on Computers and Accessibility (pp. 183–195). Association for Computing Machinery. https://doi.org/10.1145/3308561.3353790
- ISO. (2013). ISO 17049 - Accessible design — Application of braille on signage, equipment and appliances. 2013.
- ISO. (2016). ISO 19028 - accessible design — information contents, figuration and display methods of tactile guide maps (Vol. 2016).
- ISO. (2019). ISO 24508 - ergonomics — accessible design — guidelines for designing tactile symbols and characters.
- James, G. A. (1975). A kit for making raised maps. The Cartographic Journal, 12(1), 50–52. https://doi.org/10.1179/caj.1975.12.1.50
- Jesús Villalpando Esparza, J. (2014). Proceso de elaboración de cartografía táctil para ciegos y débiles visuales. Revista Geográfica, 155, 47–69. https://doi.org/10.35424/regeo.v0i155.319
- Klatzky, R. L., & Lederman, S. J. (2003). Touch. In A. F. Healy & R. W. Proctor (Eds.), Handbook of psychology, volume 4: Experimental psychology (pp. 147–176). John Wiley & Sons, Inc.
- Mackaness, W. A. (1994). An algorithm for conflict identification and feature displacement in automated map generalization. Cartography and Geographic Information Science, 21(4), 219–232. https://doi.org/10.1559/152304094782540646
- Nolan, C., & Morris, J. (1971). Improvement of tactual symbols for blind children. In Final report. https://files.eric.ed.gov/fulltext/ED070228.pdf
- The N.S.W. Tactual and Bold Print Mapping Committee. (2006). A guide for the production of tactual and bold print maps (Third). https://printdisability.org/wp-content/uploads/2018/02/TabMap-Tactual-Maps-Guide-3-2006.pdf
- Olczyk, M. (2022). Tyflomapy.pl. https://tyflomapy.pl/Spoleczenstwo_i_gospodarka.html
- Ordnance Survey. (2004). OS MasterMap user guide: product specification, v5.1-2. https://www.geos.ed.ac.uk/ gisteac/proceedingsonline/SourceBook2004/SDI/National/UK/OrdnanceSurvey/MasterMap/OS_Mastermap_UserGuide_ProductSpecification_v5-1_Feb04.pdf
- Papadopoulos, K., Barouti, M., & Koustriava, E. (2018). Differences in spatial knowledge of individuals with blindness when using audiotactile maps, using tactile maps, and walking. Exceptional Children, 84(3), 330–343. https://doi.org/10.1177/0014402918764300
- Perkins, C. (2002). Cartography: Progress in tactile mapping. Progress in Human Geography, 26(4), 521–530. https://doi.org/10.1191/0309132502ph383pr
- Raposo, P., Touya, G., & Bereuter, P. (2020). A change of theme: The role of generalization in thematic mapping. ISPRS International Journal of Geo-Information, 9(6), 371. https://doi.org/10.3390/ijgi9060371
- Regis, T., & Nogueira, R. E. (2013). Contribuição para o ensino-aprendizagem degeografia: A padronizacao de mapas tateis. In 14° Encontro de Geógrafos da América Latina: “Reencuentro de Saberes Territoriales Latinoamericanos.”Lima, Peru. Retrieved from http://observatoriogeograficoamericalatina.org.mx/egal14/Ensenanzadelageografia/Metodologiaparalaensenanza/56.pdf
- Rowell, J., & Ungar, S. (2003). The world of touch: Results of an international survey of tactile maps and symbols. The Cartographic Journal, 40(3), 259–263. https://doi.org/10.1179/000870403225012961
- Royal National Institute of Blind People. (2022). Braille fonts. https://www.rnib.org.uk/braille-and-other-tactile-codes-portal-writing-and-producing-braille/braille-fonts
- Ruas, A., & Plazanet, C. (1997). Strategies for automated generalization. In M.-J. Kraak, M.-J. Kraak, & M.-J. Kraak (Eds.), Proceedings of the 7th international symposium on spatial data handling SDH (pp. 319–336). Delft, the Netherlands.
- Štampach, R., & Muličková, E. (2016). Automated generation of tactile maps. Journal of Maps, 12(sup1), 532–540. https://doi.org/10.1080/17445647.2016.1196622
- Stangl, A., Cunningham, A., Blake, L. A., & Yeh, T. (2019). Defining problems of practices to advance inclusive tactile media consumption and production. In A. Hurst (Ed.), ASSETS ’19 - 21st International ACM SIGACCESS Conference on Computers and Accessibility (pp. 329–341). https://doi.org/10.1145/3308561.3353778
- Stoter, J., Baella, B., Blok, C., Burghardt, D., Duchêne, C., Pla, M., Regnauld, N., & Touya, G. (2010). State-Of-The-Art of automated generalisation in commercial software. EuroSDR. https://repository.tudelft.nl/islandora/object/uuid:40b5475f-3276-404f-afcb-1746c7492387/datastream/OBJ/download
- Touya, G. (2012). Social welfare to assess the global legibility of a generalized map. In Lecture Notes in Computer Science (including subseries lecture notes in artificial intelligence and lecture notes in bioinformatics): Vol. 7478 LNCS (pp. 198–211). Springer. https://doi.org/10.1007/978-3-642-33024-7_15
- Touya, G., Christophe, S., Favreau, J.-M., and Rhaiem, A. (2018). Automatic derivation of on-demand tactile maps for visually impaired people: First experiments and research agenda. International Journal of Cartography, 5(1), 67–91. https://doi.org/10.1080/23729333.2018.1486784
- Touya, G., Lokhat, I., & Duchêne, C. (2019). CartAgen: An open source research platform for map generalization. In H. Fujita (Ed.), Proceedings of the ICA (Vol. 2). Copernicus GmbH. https://doi.org/10.5194/ICA-PROC-2-134-2019
- Touya, G., Lobo, M.-J., Mackaness, W. A., & Muehlenhaus, I. (2021). Please, help me! I am lost in zoom. In P. Zamperlin, A. Cantile, & M. Milli (Eds.), Proceedings of the ICA (Vol. 4 Issue 107). Copernicus GmbH. https://doi.org/10.5194/ICA-PROC-4-107-2021
- Touya, G., & Lokhat, I. (2021). ReBankment: Displacing embankment lines from roads and rivers with a least squares adjustment. International Journal of Cartography, 8(1), 37–53. https://doi.org/10.1080/23729333.2021.1972787
- Towarzystwo Opieki nad Ociemniałymi w Laskach. (2022). Society for the Care of the Blind in Laski. https://www.laski.edu.pl/en
- Visvalingam, M., & Whyatt, J. D. (1990). The Douglas-Peucker algorithm for line simplification: Re-evaluation through visualization. Computer Graphics Forum, 9(3), 213–225. https://doi.org/10.1111/j.1467-8659.1990.tb00398.x
- Voženílek, V., & Vondráková, A. (2015). Tactile maps based on 3D printing technology. Proceedings of the International Scientifical Conference, 3, 193. https://doi.org/10.17770/sie2014vol3.732
- Wabiński, J. (2017). Methodology of creating tactile maps using 3D printing [Military University of Technology in Warsaw]. https://doi.org/10.13140/RG.2.2.26509.38887
- Wabiński, J., & Mościcka, A. (2019). Automatic (tactile) map generation—a systematic literature review. ISPRS International Journal of Geo-Information, 8(7), 293. https://doi.org/10.3390/ijgi8070293
- Wabiński, J., Mościcka, A., & Kuźma, M. (2020). The information value of tactile maps: Comparison of maps printed with the use of different techniques. The Cartographic Journal, 58(2), 123–134. https://doi.org/10.1080/00087041.2020.1721765
- Wabiński, J., Mościcka, A., & Touya, G. (2022). Tactile maps design guidelines standardization: Literature and best practices review. The Cartographic Journal. Advance Online Publication. https://doi.org/10.1080/00087041.2022.2097760
- Wabiński, J., Śmiechowska-Petrovskij, E., & Mościcka, A. (2022). Applying height differentiation of tactile symbols to reduce the minimum horizontal distances between them on tactile maps. PLoS One, 17(2), e0264564. https://doi.org/10.1371/journal.pone.0264564
- Weiss, R., & Weibel, R. (2014). Road network selection for small-scale maps using an improved centrality-based algorithm. Journal of Spatial Information Science, 9(9), 71–99. https://doi.org/10.5311/JOSIS.2014.9.166
- Więckowska, E., Chojecka, A., Mikołowicz, B., Fuksiński, C., Mendruń, J., Olczyk, M., & Rudnicka, M. (2012). Standardy tworzenia oraz adaptowania map i atlasów dla niewidomych uczniów. https://tyflomapy.pl/files/33160/Standardy_tworzenia_oraz_adaptowania_map_i_atlasow_dla_niewidomych_uczniow.pdf
- Wiedel, J. W., & Groves, P. A. (1969). Tactual mapping: Design, reading, and interpretation (Final Report No. RD-2557-S).
- Yanoff, M., & Duker, J. S. (2009). Ophthalmology (Wiggs, J. L., Miller, D., Azar, D. T., Goldstein, M. H., Rosen, E. S., Duker, J. S., Rao, N. A., Augsburger, J. J., Sadun, A. A., Schuman, J. S., Diamond, G. R. Ed., J. J. Dutton (3rd ed.) Mosby Elsevier.