
 ?Mathematical formulae have been encoded as MathML and are displayed in this HTML version using MathJax in order to improve their display. Uncheck the box to turn MathJax off. This feature requires Javascript. Click on a formula to zoom.
ABSTRACT
Humans increasingly rely on GPS-enabled mobile maps to navigate novel environments. However, this reliance can negatively affect spatial learning, which can be detrimental even for expert navigators such as search and rescue personnel. Landmark visualization has been shown to improve spatial learning in general populations by facilitating object identification between the map and the environment. How landmark visualization supports expert users’ spatial learning during map-assisted navigation is still an open research question. We thus conducted a real-world study with wayfinding experts in an unknown residential neighborhood. We aimed to assess how two different landmark visualization styles (abstract 2D vs. realistic 3D buildings) would affect experts’ spatial learning in a map-assisted navigation task during an emergency scenario. Using a between-subjects design, we asked Swiss military personnel to follow a given route using a mobile map, and to identify five task-relevant landmarks along the route. We recorded experts’ gaze behavior while navigating and examined their spatial learning after the navigation task. We found that experts’ spatial learning improved when they focused their visual attention on the environment, but the direction of attention between the map and the environment was not affected by the landmark visualization style. Further, there was no difference in spatial learning between the 2D and 3D groups. Contrary to previous research with general populations, this study suggests that the landmark visualization style does not enhance expert navigators’ navigation or spatial learning abilities, thus highlighting the need for population-specific mobile map design solutions.
Introduction
Mobile maps have become ubiquitous in our spatially enabled society (Dahmani & Bohbot, Citation2020), and we rely on these GPS-equipped mobile maps to reach our destinations (Ishikawa, Citation2019). Prior research has demonstrated that location-aware navigation aids negatively affect spatial learning of novel traversed environments in the general population (Dahmani & Bohbot, Citation2020; Gardony et al., Citation2015; Ishikawa & Montello, Citation2006; Ishikawa, Citation2019; Münzer et al., Citation2012; Ruginski et al., Citation2019). For some navigators, the consequences of reduced spatial knowledge can be severe. For instance, if a military unit required to intervene in an unknown area affected by a natural disaster is hindered in accurately perceiving the task-relevant information on a location-aware mobile map display and thus is limited in efficiently learning their surroundings, this could be very costly. Even though GPS-enabled mobile maps were originally developed to facilitate military and emergency operations in unknown areas, the existing research studying their effects on spatial learning focuses mainly on general populations. Therefore, it is of notable importance to study the impact of mobile maps on expert wayfinding populations (i.e. military professionals, search and rescue teams, etc.), especially if it is required to use mobile maps to make timely and mission-critical wayfinding decisions.
Navigation and wayfinding, especially in unfamiliar environments, is a complex and cognitively challenging process (Farr et al., Citation2012). Landmarks have proven to moderate the challenge of these tasks by helping to scaffold human mental representations of space (Couclelis et al., Citation1987). Landmarks are geographic features that structure human mental representation of space by acting as anchors or reference points for orientation, wayfinding, and route communication (Richter & Winter, Citation2014). Therefore, landmarks hold high practical importance for human wayfinding (Raubal & Winter, Citation2002). Despite the evidence that landmark visualization can mediate spatial learning from navigation aids in the general population (see reviews by Richter & Winter, Citation2014; Yesiltepe et al., Citation2021), how to effectively visualize landmarks on mobile map displays is still an open research question (Richter & Winter, Citation2014).
While there is a plethora of research on landmarks as navigation aids (Richter & Winter, Citation2014; Yesiltepe et al., Citation2021) using symbols with various levels of saliency and dimensionality, the majority of these studies are conducted in lab-based settings with wayfinders sampled from the general population and do not necessarily include mobile maps as navigation aids (Franke & Schweikart, Citation2017; Hilton et al., Citation2021; Keil, Edler, Dickmann et al., Citation2022; Keil, Edler, Reichert, et al., Citation2020; Lokka et al., Citation2018; Röser, Citation2017). What we can learn from these studies is that different features of landmarks (e.g. placement, dimensionality, saliency, etc.) impact their effectiveness for navigation, and the human response to those landmarks varies across different populations (e.g. aging adults, etc.). Hence, while recent research motivates the parts of the present study that focuses on landmarks at navigation decisions points, the depiction of landmarks on maps, and the focus on a specific subset of the population for a specific navigation task, they do not pertain to the communication of those landmarks on a navigation aid in the real world and to an expert navigation population. There is a lack of studies providing empirical evidence on the effects of landmark visualization styles on mobile maps as navigation aids to assess expert wayfinders’ spatial learning during a real-world navigation task.
To fill this gap, previous studies have proposed graphical depictions of landmarks using various levels of abstraction, including 2D and 3D visualizations (Döllner, Citation2007; Elias & Paelke, Citation2008; Liao et al., Citation2017; Lokka & Çöltekin, Citation2019; Plesa & Cartwright, Citation2008). Elias and Paelke (Citation2008) have proposed a graphic design continuum from 2D abstract (labels) to 3D photorealistic (images) for depicting point features serving as landmarks on mobile maps. Specifically, they propose that buildings with a characteristically architectural style, a salient facade, a specific function, or a prominent location might be easily recognized in the real world if depicted using an image, a detailed drawing, or at least a sketch of the landmark outline on the mobile map (Elias & Paelke, Citation2008; see ).
Figure 1. Graphical design continuum for depicting landmarks on mobile maps (after Elias & Paelke, Citation2008, p. 44).
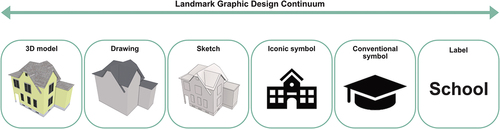
Depicting landmarks as 3D buildings with great fidelity on mobile maps provides a more naturalistic representation and facilitates landmark identification between the map display and the physical environment (Liao et al., Citation2017; Plesa & Cartwright, Citation2008; Richter & Winter, Citation2014). This arguably makes the realistic-looking 3D visualization more desirable, intuitive, effective, and enjoyable for novice and expert map users compared to the well-known abstract 2D visualizations (Hegarty et al., Citation2009; Liao et al., Citation2017; Lokka & Çöltekin, Citation2019; Oulasvirta et al., Citation2009). Nevertheless, while people might prefer 3D, navigators may not perform more effectively or efficiently using 3D maps (Hegarty et al., Citation2009; Kray et al., Citation2003; Oulasvirta et al., Citation2009; Thrash et al., Citation2019).
Still, in a lab-based study comparing 2D abstract maps and 3D photorealistic geo-browsers with participants sampled from the general population, Liao et al. (Citation2017) found that the participants using a 3D geo-browser to navigate to the destination performed better than the 2D map group in making navigation decisions at complex intersections. The 3D group navigated faster and performed more efficiently at self-localization and orientation at decision points because they focused more on the task-relevant landmarks and because they learned the environment from an oblique perspective that is closer to a real-world experience than a top-down (orthographic) perspective of a standard 2D map. However, compared to the 2D group, the 3D group was less effective on the map reading and memorizing tasks during which participants acquired spatial knowledge. Liao et al. (Citation2017) found that participants of the 3D group spent a longer time and had to search a wider area on the screen than the 2D group to obtain the necessary spatial information for the map reading and memorization task. A reason for the worse map reading and memorizing performance of the 3D group was due to the higher visual complexity of the 3D geo-browser display, leading possibly to information overload. Therefore, some researchers have opted for simplified abstract 2D visualizations due to fewer not-task relevant extraneous details or visual clutter (Rosenholtz et al., Citation2007; Thrash et al., Citation2019). Taken together, map users’ performance with and/or preferability for either abstract 2D or realistic 3D visualizations in reviewed studies are still inconclusive and possibly interact with navigators’ domain expertise and assessed navigation tasks and contexts (Hegarty et al., Citation2009; Liao et al., Citation2017; Maggi et al., Citation2016; Thrash et al., Citation2019).
Specifically, expertise and individual skills influence how people retrieve and incorporate spatial information from the environment to orient and navigate in space (Thrash et al., Citation2019). According to previous studies (Hegarty et al., Citation2009; Keehner et al., Citation2004; Woollett & Maguire, Citation2010; Woollett et al., Citation2009), experience and expertise in a particular application domain make task performance less subject to interpersonal variability in individual spatial abilities. In other words, navigation expertise may overcome poor spatial abilities. For example, Hegarty et al. (Citation2009) found that realistic weather maps negatively affected novice users’ task performance on map inference but not that of experts. Previous studies comparing the effect of expertise on the distribution of visual attention on a map showed that experts were more efficient at directing visual attention to task-relevant information than novices and, in turn, were less distracted by irrelevant information (Kapaj et al., Citation2021b; Lanini-Maggi et al., Citation2021; Ooms et al., Citation2014). Familiarity with the task and respective targeted training enabled participants to process visual information in a more focused and goal-directed way, predominantly using top-down information processing compared to novices, who were more likely to use bottom-up processing.
In addition to expertise and individual spatial skills, how people retrieve a mental representation of the environment to find their way is also influenced by wayfinders’ stress and spatial anxiety (Ishikawa, Citation2022; Newcombe et al., Citation2022). Hence, acquiring an accurate representation of the environment to make destination-relevant decisions under time pressure (Brunyé et al., Citation2017; Credé et al., Citation2019) while suppressing the fear of becoming lost in the immediate surroundings induces higher stress on wayfinders during navigation tasks, which in turn might impact their spatial knowledge acquisition (Credé et al., Citation2020; Gardony & Taylor, Citation2011; Ishikawa, Citation2022). However, given that stress responses are strongly context-dependent (Credé et al., Citation2019), spatial knowledge acquisition is highly dependent on a person’s spatial ability skills, expertise and experience (i.e. experts and novices), and affective states (Ishikawa, Citation2022; Lanini-Maggi et al., Citation2021). For instance, in their study with experts and novice air traffic controllers, Lanini-Maggi et al. (Citation2021) found that while the experts self-reported lower stress levels and higher engagement with the task, the differences were not statistically significant between the expertise groups. However, they found that when experts performed a familiar task, their level of engagement was significantly higher than the engagement of the novice group for the same task (Lanini-Maggi et al., Citation2021).
On account of different visual encoding strategies, spatial abilities, stress and spatial anxiety, and engagement with the task between experts and novices, our study focuses on experienced Swiss military personnel activated in the event of natural disasters and civil emergencies. This group of expert navigators is arguably more stress-tolerant wayfinders because they have been specifically trained for stressful navigation contexts. Because they often work in time and psychological pressure contexts, in which spatio-temporal decision-making must occur promptly and accurately, we used a map design that would highlight only the task-relevant information. More specifically, to reduce visual clutter (Rosenholtz et al., Citation2007) and direct expert wayfinders’ visual attention to task-relevant information in the environment (Gardony et al., Citation2015), task-relevant landmarks were depicted as 3D buildings with high fidelity or as commonly known abstract 2D building footprints at navigation decision-relevant intersections (Liao et al., Citation2017; Lokka & Çöltekin, Citation2019). We were interested in assessing how different landmark visualization styles – shown to help general populations – might affect the spatial learning of an expert population during a real-world navigation task for which these experts were trained. Specifically, we sought to answer the following research questions (RQ) and associated hypotheses (H):
RQ1: What are the differences in task performance, gaze behavior, and spatial learning of expert navigators during a civil emergency wayfinding task with the assistance of a mobile map depicting task-relevant landmarks as abstract 2D building footprints compared to 3D buildings with high fidelity?
We hypothesize (H1) that due to a more straightforward visual matching process between the mobile map display and the environment, the 3D expert wayfinding group will show greater visual attention to task-relevant information, better spatial learning, with greater navigation efficiency compared to the 2D expert wayfinding group.
RQ2: How does experts’ gaze behavior during navigation influence their spatial learning?
We hypothesize (H2) that higher visual attention on task-relevant information (i.e. the traversed environment and the landmarks), and lower attention on the mobile map display, will improve wayfinding experts’ spatial learning (Hejtmánek et al., Citation2018; Koletsis et al., Citation2017).
The in-situ assessment of pedestrian navigation in the real world can contribute to new insights critical to better understanding expert wayfinders’ navigation behavior. It allows us to directly assess how different landmark visualization styles may aid the spatial learning of an expert navigation group in real-world use contexts (Ishikawa et al., Citation2008; Kiefer et al., Citation2014; Münzer et al., Citation2006). Therefore, this study presents a highly ecologically valid in situ ambulatory assessment approach to investigate the role of landmark visualization style on expert wayfinders’ navigation performance, gaze behavior, and spatial learning during a real-world navigation task.
Methods
Participants
This study was conducted in collaboration with Swiss Armed Forces professionals. Twenty-two participants (2 females) took part in the experiment. Participants were voluntarily recruited with the help of our contact person in the Swiss Armed Forces, and no incentives were provided. Due to the challenges of recruiting from an expert population, our sample size was the maximum we could achieve within a reasonable time period for data collection. The mean age of participants was 37.1 years, ranging from 24 to 58 years (M = 37.1, SD = 11.7). They were all fully-trained personnel of the Engineer and Rescue Troops with various functions, ranks, and years of experience. Based on the role of navigational experience and expertise in task performance (Hegarty et al., Citation2009; Woollett & Maguire, Citation2010), map training, participants’ self-reported spatial abilities, and a keen interest in improving map design for more effective support in their daily work, this sample group was deemed appropriate for our study.
Ethical approval (No. 19.6.10) for this study was provided by the Ethics Committee of the University of Zurich. Participants with eyesight problems (i.e. myopia or hyperopia) could only participate in our study by wearing contact lenses since eyeglasses interfered with eye-tracking equipment. All participants gave written informed consent for participation and were aware that they could end the experiment at any time without consequence.
Experimental design
For our experiment, we tested participants’ incidental spatial learning. We used a matched-groups, between-subjects design to control for individual differences between groups of participants. Therefore, the 22 participants were evenly distributed across two groups (2D and 3D) based on their self-reported spatial strategies and gender. To control for a landmark and route ordering effect, we counterbalanced the starting position of the predefined route by reversing the direction of travel for half the sample.
The independent variable for the experiment was the landmark visualization style (2D abstract building footprints vs. 3D realistic-looking buildings). As dependent variables, we measured navigation task performance (i.e. task accuracy and completion time), visual attention (i.e. experts’ gaze behavior during navigation), and spatial learning (i.e. experts’ incidentally gained knowledge of relevant environmental features). In addition, to the measures outlined in this section, we recorded 64-channel mobile electroencephalogram (EEG) data from participants throughout the navigation stage of the experiment. The EEG data analysis (see Kapaj et al., Citation2021a) is not the subject of this paper, which focuses on the behavior and gaze metrics, and thus will not be mentioned further.
Materials and apparatus
Navigation route
The study was conducted in a residential area unfamiliar to participants in Brugg, Aargau, Switzerland. We used a 1 km long route that contained 11 intersections (4 right turns, 6 left turns, and 1 straight movement). We selected five buildings (from five different intersections) to serve as target landmarks in our study. These landmarks are referred to as task-relevant landmarks throughout the rest of this manuscript and were selected due to meeting the criteria for good landmarks as defined by Yesiltepe et al. (Citation2021). Specifically, they were highly visually salient in color, salient and unique in form, and structurally well placed at decision points.
Stimuli design
We designed two mobile maps () for navigation purposes that differed in their depiction of landmarks visible along the route:
Figure 2. Landmark visualization on the interactive mobile map applications as a) abstract 2D building footprints and b) realistic 3D buildings. The inset shows a zoomed-in view of one of the landmarks across both visualization styles.
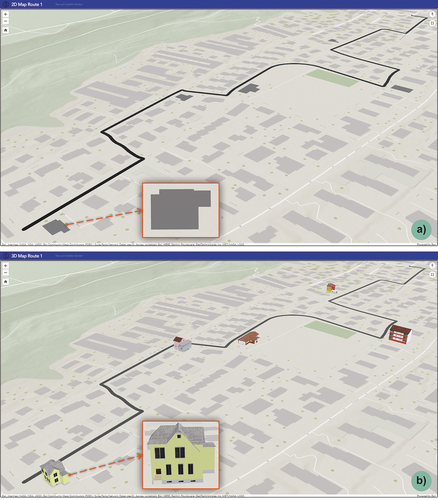
Abstract 2D building footprints ()
Realistic 3D buildings ()
The mobile maps were presented to the experts as map applications displayed on a 10.1” SAMSUNG Galaxy tablet with 1920 × 1200 resolution. The map applications were set to display a north-up map at the route’s start and provide a realistic navigation experience. Participants could freely interact with the mobile map (e.g. zoom, pan, rotate, and tilt the map display) as desired. However, experts’ interactions with the mobile map aid were not recorded. In addition, the map application did not show or track participants’ location during the navigation task.
We designed the 3D buildings in ArcGIS CityEngine 2018.1 (Esri, CA, USA; https://www.esri.com/en-us/arcgis/products/arcgis-cityengine), used photographs of respective landmarks to texturize 3D building models, and designed the maps in ArcGIS Pro 2.4 (Esri, CA, USA; https://www.esri.com/en-us/arcgis/products/arcgis-pro). We took photos of landmarks on the same day and under the same weather conditions to control for lighting effects (Winter et al., Citation2005). The stimuli were developed as mobile map applications through the ArcGIS Online platform (Esri, CA, USA; https://www.esri.com/en-us/arcgis/products/arcgis-online).
Mobile eye-tracking
We recorded gaze behavior using an ETG 2W binocular head-mounted mobile eye-tracker (MET) from SensoMotoric Instruments (SMI; no longer active). Eye movements were recorded at a fixed rate of 60 Hz and were calibrated with a three-point calibration using iView software. The tracker contained a front-facing scene camera with a 1280 × 960px resolution, fixed at 24 frames per second. We used shaded or non-shaded lenses depending on weather conditions to reduce infrared interference and prevent participants from squinting. The MET glasses were connected to a mobile device, which participants carried in a backpack.
Spatial ability, spatial learning, and questionnaire measures
We used three other test instruments in addition to a demographic questionnaire (such as gender, age, and profession). First, participants’ spatial strategy skills were assessed with a standardized questionnaire, the German Questionnaire on Spatial Strategies (QSS; Münzer & Hölscher, Citation2011). The QSS uses 19 items to capture the extent to which wayfinders rely on landmark, route, and survey knowledge and is a predictor of wayfinders’ spatial learning and orientation in various real-world environments (i.e. familiar, unfamiliar, indoor, and outdoor environments; Münzer & Hölscher, Citation2011; Münzer et al., Citation2016). It was developed with a European, German-speaking population which fits our present sample.
Second, we assessed participants’ abilities to imagine different perspectives or orientations in space with the Perspective Taking/Spatial Orientation Test (PT/SOT; Hegarty & Waller, Citation2004). PT/SOT uses a two-dimensional array of objects where participants imagine themselves facing a particular direction within the array. Then they should indicate the direction of a target object in the array (Hegarty & Waller, Citation2004).
Third, we administered a paper-based version of the Judgment of Relative Direction (JRD) test to assess participants’ incidental survey knowledge acquisition of the traversed route. We chose the JRD as a validated test method for assessing spatial learning (Credé et al., Citation2019, Citation2020; Huffman & Ekstrom, Citation2019). The JRD test is a pointing task that asks participants to recall the position, direction, and distance of landmarks relative to each other, irrespective of their current egocentric position and heading (Huffman & Ekstrom, Citation2019). That is, “Imagine you are standing at landmark 1, facing landmark 2. Please point to landmark 3.” We modified the JRD test with pictures of landmarks as seen from participants’ viewpoints during navigation for better recognizability (Christou & Bülthoff, Citation1999). Thirty landmark triplets out of 60 possible permutations (5 * 4 * 3) were randomly chosen per participant by excluding one of the triplet pairs with symmetrical angles (i.e. −60° and 60°; Credé et al., Citation2019).
Experimental procedure
The experiment was conducted in the native German language of the participants during August, September, and October 2019 in suitable weather conditions with no precipitation. Participants completed the demographic questionnaire and QSS online before the outdoor experiment and the PT/SOT on the day of the experiment after informed consent procedures.
While participants were getting familiar with the mobile navigation device using a test map application, we set up the MET glasses and the EEG device. We then led participants to the starting position of the navigation route, where they were introduced to the study scenario (translated from German):
Imagine that this area is in a civil emergency and urgently needs assistance. According to a predefined priority list, five buildings have been selected to be immediately assessed for possible damages. These buildings are highlighted on the mobile map application. Please follow the route as fast as possible without running to identify the five target buildings along the given route. Raise your hand once you are next to a target building, and then reach the destination point.
We shadowed the participants discreetly during their walk without interfering with their navigation task. If participants made a wrong turn during navigation, the experimenters allowed them to correct their direction. If no correction happened and they continued in the wrong direction, they were called back to the intersection where the wrong decision was made. After finishing the navigation task, we removed the EEG device and the MET glasses and then blindfolded, disoriented, and moved participants to a nearby location without visibility over the study area. They were asked to complete the JRD test to assess their incidental spatial learning.
Results
Data analysis
We analyzed our data using independent t-tests. In some cases with minor violations of the assumption of normality, we confirmed the results with non-parametric Mann-Whitney U tests. As both tests revealed consistent results in all cases, we report the outcomes of the independent t-test. We used R (v.4.0) to compute NHST with the alpha level (significance threshold) set at p < .05 (see supplementary material for complementary Bayesian analyses; Kruschke, Citation2014).
Task performance
We first examined participants’ task accuracy to test whether the different map designs would impact participants’ navigation performance. Accuracy was measured by participants’ navigation errors (deviations from the predefined route) and errors in identifying the given landmarks. In total, there were three navigation task errors across groups: two wrong turns at intersections and a failure to identify one of the given landmarks. The two turning errors were made at the same intersection (first intersection; ) by two participants across the conditions, and the missed landmark by a participant in the 2D condition was building four (). Three participants across conditions made all three errors, so there were no differences in task accuracy between groups.
Next, we analyzed participants’ completion time, which refers to the total time each group completed the navigation task from the starting point to the destination. Overall, the time to route completion ranged from 9 to 15 minutes (M = 11.6, SD = 1.35). The results revealed that the completion time between the 2D group (M = 11.4, SD = 1.26), and the 3D group (M = 11.7, SD = 1.48) did not differ significantly, t(20) = −0.5, p = .60, r = .11.
Visual attention
MET data processing
Due to technical and data quality issues, we analyzed only 14 out of 22 participants’ MET recordings. We only processed the recordings with a tracking ratio, i.e. the percentage of the experimental time in which eye movements were measured, higher than 65%. The eye-tracking data from seven participants were not recorded at all, and the data of one participant was removed from the analyses as it had a tracking ratio below the 65% threshold. Even after removing eight participants from our sample due to technical and tracking issues, the spatial abilities average score between the groups was not affected. We performed the MET data analysis using SMI BeGaze 3.5 software, utilizing the SMI event detection algorithm to classify gaze samples. The algorithm classifies gaze data into four categories: fixations, saccade, blink, and undefined. All fixations shorter than 50 ms are marked as undefined (SMI, Citation2015).
We annotated fixation data in two ways. First, manual assignment of fixations was conducted to three AOIs: the first AOI corresponds to the “Mobile Map” display, while the remaining two AOIs refer to the features in the environment, which are categorized into “Landmarks” (the five task-relevant buildings), and “Environment” (i.e. environmental features except for landmarks). Second, specifically for fixations on the “Mobile Map” AOI, we additionally manually marked locations of fixations onto the respective map overlay (SMI, Citation2015) and computed a kernel density map ().
We used fixation duration (as a percentage) and computed a kernel density map for the subsequent analysis of participants’ gaze behavior across the previously defined AOIs. Fixation duration was normalized by participants’ trial completion time (Holmqvist et al., Citation2011) and computed according to the following equation:
Visual attention results
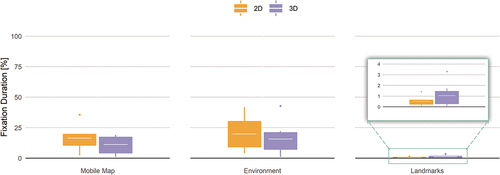
There was no significant difference in the normalized fixation duration (see ) on the mobile map AOI between the 2D (M = 16.3, SD = 10.7) and 3D (M = 11.2, SD = 7.7) groups (t(11) = 1, p = .30). However, it did represent a medium-sized effect r = .30. Additionally, there was no significant difference in normalized fixation duration on the environment AOI between the 2D (M = 19.8, SD = 15.1) and 3D (M = 15.7, SD = 14.05) groups (t(12) = 0.5, p = .60, r = .15). Finally, there was no significant difference in the normalized fixation duration on the landmark AOI between the 2D (M = 0.51, SD = 0.45) and 3D (M = 1.05, SD = 1.15) groups (t(8) = −1, p = .30). However, it did represent a medium-sized effect r = .38.
Figure 3. Landmark visualization style did not influence participants’ fixation duration on AOIs (zoomed-in view for the Landmarks AOI) across experimental groups. White lines show means and dots outliers.
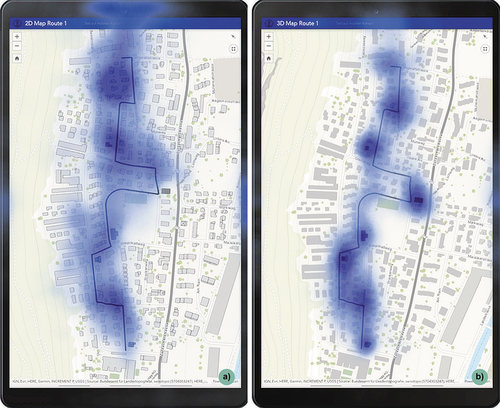
To explore the distribution of participants’ visual attention on the mobile map AOI, we generated a kernel density map of participants’ gaze fixations (). Visual inspection of the density map shows that the realistic 3D landmark models attracted more visual attention than the abstract 2D footprints. By looking at the visual attention dispersion, we can observe that the 2D group searched a wider area around the route on the mobile map display to obtain the necessary information to complete the navigation task.
Figure 4. Landmark visualization style a) 2D, b) 3D influenced participants’ distribution of visual attention on the mobile map display.
These effects were quantified using a post-hoc assessment of participants’ gaze behavior in a previously published paper on this study (Kapaj et al., Citation2021b) and thus are not a focus of this paper. We employed a two-step method, (1) gaze transition matrices (TMs) and (2) gaze entropy measures, to predict participants’ eye-movement sequences across AOIs (Krejtz et al., Citation2015). The TMs results revealed that when participants of the 2D group fixated on the landmarks visualized on the mobile map, the subsequent fixation most likely remained on the mobile map area around these landmarks (Kapaj et al., Citation2021b). The entropy results revealed a significant difference across the experimental conditions. The 3D group exhibited a more evenly distributed visual attention allocation among AOIs than the 2D group. This means that the participants of the 3D group considered the displayed task-relevant landmarks, the mobile map, and the environment equally important to complete the navigation task (Kapaj et al., Citation2021b). In this paper, we focused on AOI fixation duration and spatial learning, which Kapaj et al. (Citation2021b) did not cover.
Incidental spatial learning
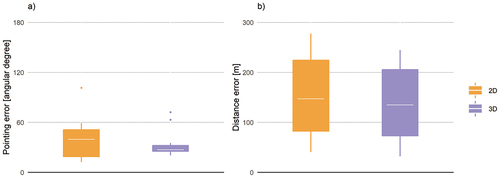
The independent t-test revealed that the performance between the 2D group (M = 39.7, SD = 26.3) and the 3D group (M = 34.1, SD = 17.2) did not differ significantly (t(17) = 0.6, p = .60, r = .14) in recalling landmarks position in the environment. Visual examination of indicates differences in group variance for angular error. However, a posthoc Levene test revealed no significant difference in variance between the groups (F(1,20) = 2.18, p = .16). Additionally, there was no significant difference in recalling the distance among landmarks (t(20) = 0.3, p = .70, r = .08) between the 2D (M = 147, SD = 84.1) and 3D (M = 135, SD = 77.5) groups (see ).
Figure 5. Visualization style did not influence participants’ recall of landmarks’ a) position and b) distance in the environment. White lines show means and dots outliers.
The effect of visual attention on spatial learning
We performed a post-hoc assessment of participants’ visual attention behavior and how it influenced their spatial learning of the traversed environment. For this assessment, we utilized a multilevel modeling approach with the significance threshold set at p < .05.
Multilevel modeling is a generalized form of regression analysis appropriate for nested study designs (Gelman & Hill, Citation2006) as we administered multiple JRD trials nested within participants. Multilevel models were implemented using the lme4 package in R (v.4.0; Bates et al., Citation2015; Lüdecke, Citation2020; Wickham, Citation2011). First, we created a model that includes JRD errors as a response variable, without any fixed effects, to determine the experimental design’s maximal random effect structure (Barr et al., Citation2013). Next, we iteratively reduced the random effects structure and selected the model with the simplest random effects structure, which reached convergence and the best model fit according to the Aikake information criterion for the following model:
Where i represents spatial learning trials, and j represents individual participants.
The mixed two-level regression equation models the effect of AOI fixation duration (level 2, between-subject) on spatial learning while controlling for PT/SOT ability and experimental condition (level 2, between-subject). We fit three separate models, only varying the AOI fixation duration predictor (i.e. landmark, environment, and mobile map). We did this to separately model the effect of fixation duration on spatial learning for each AOI while preserving the largest number of experimental spatial learning trials, thus avoiding averaging over within-person variance. We contrast coded categorical variables to −0.5 and 0.5 and centered continuous variables at the mean value.
The environment AOI model revealed that gaze behavior influenced participants’ spatial learning. We found a significant relationship between time spent fixating on the environment and participants’ pointing errors that showed that greater fixation duration on the environment is associated with small pointing errors. Specifically, a one percent increase in fixation duration is associated with a 0.72° reduction in pointing error, even after controlling for the experimental group and spatial ability. The landmark and the mobile map AOIs models revealed no significant relationship between fixation duration on the respective AOI and spatial learning. For a complete overview of the results of the multilevel models, see and .
Figure 6. The relationship between fixation duration on a) mobile map, b) environment, c) landmarks AOIs, and pointing errors per condition. Each point indicates participants’ average error and fixation duration per AOI, and shaded areas correspond to 95% confidence intervals.
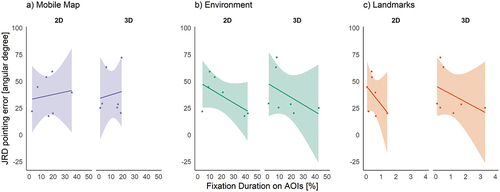
Table 1. Fixation duration on the AOIs influences participants' spatial learning.
Discussion
We conducted a real-world navigation study outdoors to examine the effects of visualizing either 2D or 3D landmarks on mobile map displays on expert navigators’ wayfinding efficiency, gaze behavior, and incidental spatial learning during a real-world navigation task.
Our expert navigators completed the task with few navigation errors, as expected, and performed very well in the JRD test. Previous work relying mostly on regular populations reports average judgment errors of 55–70 degrees on first route exposure (e.g. Credé et al., Citation2020; Huffman & Ekstrom, Citation2019). In contrast, our expert participant sample produced much lower angular errors after only one exposure to the route (M = 36.9 degrees), which gives us confidence in the navigation expertise of our sample.
Overall, these behavioral navigation outcomes (navigation accuracy and task completion time) did not vary significantly between landmark visualization styles. This is in contrast to our predictions (H1) and the finding of Liao et al. (Citation2017), who found a benefit of the 3D visualization style for navigation in a regular population. This result highlights the importance of population-specific solutions for navigation aids. The main explanation for a realistic 3D landmark benefit was to enable better identification of relevant landmarks (Liao et al., Citation2017). It is possible that expert navigators do not suffer from reduced landmark encoding as a result of using navigation aids in the same way normal populations do (Dahmani & Bohbot, Citation2020), and thus this is not a limiting factor to navigation or spatial learning. Indeed, the efficiency of encoding landmark configurations has been shown to relate to spatial working memory capacity (Credé et al., Citation2020), which is higher in more skilled navigators (Newcombe, Citation2018). In fact, the same benefit of enhanced small-scale spatial skills (visuospatial abilities, spatial working memory, etc.) for navigation performance is evident in other populations, such as expert athletes (Meneghetti et al., Citation2022). Hence, not all populations may require or benefit from improvements to navigation aids that normal populations would require.
Considering the better spatial skills of our sample group, their familiarity with the general architecture of the area, and their habitual use of 2D maps, the translation and matching from abstract 2D landmark design to real-world 3D features might not have posed a challenge for our expert wayfinders. Perhaps, their familiarity with the cultural and geographical properties of the traversed environment may have aided our participants in knowing what a 2D building in this area should look like, similar to how recent research shows that people are better at navigating environments with similar street layouts to their home town (Coutrot et al., Citation2022). Our results could have been different if the study had been conducted with a population group completely novel to the chosen area’s architecture, environmental style, and street network, such as first-time tourists. Moreover, the benefit of 3D visualization may extend to experts if they were in a new environment, for example, military units deployed to foreign countries to support against a natural disaster, who thus no longer benefit from architectural familiarity. It is possible that those benefits could diminish quicker in experts vs. non-experts, who may acquire familiarity with an environment more rapidly. These questions would be ideal candidates for future consideration of the relationship between navigation aid design and target user groups.
Whilst our expert sample did not benefit from the cartographic design changes made to the mobile map display, it is reassuring that adding more information to the mobile map, which map users tend to prefer, did not adversely affect navigation efficiency for wayfinding experts, which is important for emergency scenarios our target population may experience. This could mean that adding more visual information (e.g. not just spatial but about specific tasks and situations) to the mobile map display does not hinder experts’ task performance due to their domain expertise and knowledge-driven approach to focus on task-relevant information (Hegarty et al., Citation2009; Lanini-Maggi et al., Citation2021; Maggi et al., Citation2016). This finding is important for mobile map designers concerned about information overload affecting map-assisted task performance (Hegarty et al., Citation2009; Kray et al., Citation2003; Liao et al., Citation2017; Plesa & Cartwright, Citation2008). This preserved performance could be attributed to the fact that realistic-looking 3D buildings on the 2D map did not shift experts’ attention away from the environment to the mobile map, which otherwise would negatively affect spatial learning (Brügger et al., Citation2019; Gardony et al., Citation2015).
We observed differences in the distribution of wayfinding experts’ gaze fixations on the mobile map when landmarks were visualized as abstract 2D building footprints and realistic 3D buildings. Contrary to Liao et al. (Citation2017) findings, the kernel density map () revealed that the 2D group had to search a wider area around the navigation route and landmarks to obtain the necessary spatial information to complete the task. This is in line with previous findings, suggesting that landmarks with a higher level of visual saliency attract more visual attention (Wenczel et al., Citation2017) and do not negatively affect incidental spatial learning. In our previous work (Kapaj et al., Citation2021b), we suggested that this could be because participants in the 2D group focused more on the area around the navigation route on the mobile map to search for spatial clues to match seen features in the environment with the map display (Keil, Edler, Kuchinke, et al., Citation2020). On the one hand, salient realistic 3D buildings contain more visual information to process, and one would thus expect them to require longer visual processing time. However, our expert navigators spent less visual attention overall on the mobile map. This might be because the realistic 3D buildings served as salient bottom-up guidance of visual attention (Wolfe & Horowitz, Citation2017) and thus directed experts’ attention toward these task-relevant landmarks and less to the adjacent areas on the mobile map. This, in turn, might leave more time available for the experts to attend to the environment, which, in line with previous research, improved their spatial learning (Hejtmánek et al., Citation2018).
Fixation duration is widely acknowledged to measure deep cognitive processes (Holmqvist et al., Citation2011). Therefore, we expected (H2) that longer fixation on task-relevant features (i.e. environment and landmarks) would have improved experts’ memory for the location of these task-relevant features (Tatler et al., Citation2005) and, in turn, would lead to better incidental spatial learning (Liao et al., Citation2017). We only found partial support for the hypothesis that more attention to the environment and task-relevant landmarks would significantly improve wayfinding experts’ spatial learning. We discovered that when participants paid more attention to the environment, their spatial learning improved, regardless of the 2D or 3D visualization of the landmarks on the mobile map, even after controlling for their baseline level of spatial ability. On the other hand, there were no significant indicators suggesting a relationship between fixation duration on the landmarks and the mobile map display and spatial learning.
This pattern of results is not necessarily surprising as fixations on individual landmarks do not provide information about the allocentric relationship between those features in the environment (reflected in the non-significant models here). However, when traveling between landmark locations, humans integrate continuous idiothetic information (e.g. vestibular, proprioception) to acquire metric information about those relationships (Etienne & Jeffery, Citation2004), which our data suggest is aided by visual monitoring of the traversed environment. Put simply, focusing on the environment while traversing between task-relevant locations is important for spatial survey learning, thus, good navigation aids must not consume too much attention (Brügger et al., Citation2019; Gardony et al., Citation2015; Hejtmánek et al., Citation2018; Koletsis et al., Citation2017). We believe this effect is strong in our study due to the realistic active walking component of our design. Previous studies utilizing desktop setups may underestimate this impact of navigation aids due to the restriction of idiothetic inputs to the human navigation system (see also De Sanctis et al., Citation2021).
Previous studies show that when the general population navigates in novel environments, they need to sustain their attention to the environment to improve their spatial learning (Gardony et al., Citation2015; Hejtmánek et al., Citation2018). If not, the presence of navigational aids and the divided attention between the mobile map and the environment would negatively affect wayfinders’ spatial learning (Gardony et al., Citation2015; Hejtmánek et al., Citation2018). This is because wayfinders “get lost in the map” and spend too much visual attention on the mobile map and not enough in the traversed environment (Koletsis et al., Citation2017). However, the expert wayfinders in our study were immune to such adverse effects of divided attention on spatial learning. Our work complements and extends past research by emphasizing the role of wayfinding expertise on map-assisted navigation performance, visual attention, spatial learning, and the relationship between experts’ gaze behavior and spatial learning in novel environments. Specifically, greater attention to the environment and highlighted task-relevant landmarks instead of the mobile map display might improve spatial learning. Importantly, this effect was found regardless of the landmark visualization style used for this study, suggesting an effect that generalizes beyond specific map design choices, which is indeed an important result for the cartographic community interested in designing personalized mobile maps for various map user groups (Ricker & Roth, Citation2018).
Limitations and future directions
Contrary to our hypothesis (H1), there were no significant differences in task performance, gaze behavior, and incidental spatial learning across the two tested landmark visualization styles. On the one hand, these results could indicate that the landmark visualization styles were generally sufficient for navigation experts to complete the navigation task and support spatial learning. Alternatively, we may have lacked statistical power owing to the small sample size in our study. Unfortunately, this was unavoidable due to the limited availability of navigation experts, which is a general challenge in empirical expertise research and is one reason why there is little prior related cartographic research.
We performed a post-hoc power analysis to determine what effect size on our spatial learning measure we could have hoped to detect, given our achieved sample size. We found that given the variance shown in our sample and using the same statistical tests, we were sufficiently powered (0.8) to detect a difference in pointing error of 26 degrees. This is not an unreasonable size. For example, Craig et al. (Citation2016) observed improvements of ~ 20 degrees in the general population just by allowing participants to rest between learning and testing. We thus believe that our study would have detected any effects large enough to be of practical importance to the design of navigation aids. However, for a more fine-grained insight, future studies with expert populations could speak to the replicability of our results, ideally with larger samples than we were able to achieve to examine more subtle effects. Our study can serve as an initial indicator of task performance and group differences as a foundation for future hypotheses. That being said, we also performed a power analysis to determine the sample size required to achieve a power of 0.8 to detect a pointing error effect of the size shown between our groups (if, in fact, it were a real effect), revealing a required sample of 84 expert navigators.
Our study used an emergency navigation scenario co-developed with the Swiss Armed Forces. It is possible that the emergency scenario might have influenced participants’ map display interactions (i.e. zooming, tilting, and rotation in the case of the 3D landmarks; Wilkening & Fabrikant, Citation2013) and their spatial knowledge acquisition of the environment. Additionally, it might be that our navigation experts did not benefit from the 3D landmark visualization as the 2D building footprint style still seems to be the dominant map symbol style for decision-making in real-world emergency scenarios (Wilkening & Fabrikant, Citation2013), often still performed with paper maps, and thus our wayfinding experts were already habituated to this map design style (Dahmani & Bohbot, Citation2020). Nevertheless, experts’ interactions with the mobile map aid constitute an interesting future work suggestion, as we did not record their interactions with the mobile map in the present study.
In addition, even though an experienced sample group, it could be that our emergency scenario might have induced higher stress on our expert wayfinders and affected their spatial learning. The higher induced stress could have deep ramifications for our military emergency respondents, who face stronger affective states and require solid navigational skills to complete their duties (Gardony & Taylor, Citation2011) despite an emotionally laden context. Therefore, it would be beneficial that future research investigating experts’ performance under stress-induced navigation tasks (e.g. time pressure) included stress-related self-reports collected with standardized questionnaires (Lanini-Maggi et al., Citation2021) coupled with physiological measures such as electrodermal activity and facial electromyography (Credé et al., Citation2019, Citation2020).
Future work should also consider other types of spatial knowledge assessments, including, for instance, route knowledge, landmark recognition, and other kinds of survey knowledge tests (e.g. egocentric pointing), for a more nuanced analysis of participants’ spatial learning during a real-world navigation task (Hegarty et al., Citation2006). It could be that landmark-based instructions improve the categorical encoding of spatial information more than metric knowledge, which our data suggests is more related to the processing of the environment during the navigation of connecting paths. Indeed, prior research investigating place-direction knowledge (but not survey knowledge) found that gaze behavior at intersections and not at connecting paths was a significant predictor of performance (Hilton et al., Citation2020).
We focused on two specific landmark visualization styles dependent on dimensionality and abstraction of the landmark symbol displayed on the mobile map. Related to the dimensionality of the landmark depictions, we suggest that future research further examines the role of various landmark design styles (Elias & Paelke, Citation2008). Furthermore, future work should disentangle landmark visualization styles with varying levels of realism and dimensionality presented to wayfinders on mobile map aids. In addition, future work should further assess the interplay between mobile map displays and verbal instructions for decision-relevant landmarks (Gramann et al., Citation2017), focusing on how these affect spatial learning and wayfinding behaviors.
Our study tested the effect of the design of local landmarks (along the route) on incidental spatial learning. It thus did not assess the effect that global landmarks (Credé et al., Citation2019) and intentional spatial learning (Wenczel et al., Citation2017) might have on participant performance. The effect of visual attention we found in our study could be because attention to the environment likely predicts better incidental spatial learning. Therefore, participants may have distributed their visual attention differently had they known that spatial knowledge formation would be assessed. Still, we felt that incidental learning more closely mirrors real-world navigation, as navigators might traverse familiar and less familiar environments during one map-based navigation task, and wayfinders using mobile maps might prioritize arriving at a destination quickly for familiar environments or learning the environment more slowly and carefully for unfamiliar environments. We also suggest future work to assess the role of local and global landmarks, whose distinction is considered equally important (Steck & Mallot, Citation2000), and intentional learning on participants’ spatial learning during real-world navigation tasks.
Conclusions and implications
Existing research has shown that an over-reliance on location-aware mobile maps shifts users’ attention away from task-relevant features in the environment and thus deteriorates spatial learning in general populations (Dahmani & Bohbot, Citation2020; Gardony et al., Citation2015; Hejtmánek et al., Citation2018; Ishikawa, Citation2019; Ruginski et al., Citation2019). Still, people will continue to use location-aware mobile maps to ease the challenges of their daily navigation needs. However, for some wayfinders, the consequences of relying on location-aware map-assisted navigation can be severe, as they might need to make critical and life-threatening wayfinding decisions using these mobile maps or relying on their own spatial knowledge (for example, in the case of a broken device, or an empty battery). In general populations, landmark visualization has been shown to mitigate the negative effects of mobile map use and to support spatial learning (see reviews by Richter & Winter, Citation2014; Yesiltepe et al., Citation2021). Our real-world navigation study extends the matter of assessing the helpfulness of different landmark visualization styles to an expert navigation population (i.e. military personnel) for which the matter is life-critically important, and there is a gap in research.
Our study found that the wayfinding experts’ spatial learning improved when they focused their visual attention more on the features in the environment, regardless of the landmark visualization condition. Overall, our highly ecologically valid methodological approach suggests that the map design styles that benefit general populations might not have the same effect on expert populations. Additionally, expertise seems to mitigate the negative effects of added visual complexity on mobile map displays. Hence, designers can be more ambitious with this target group, not just in terms of navigation but in general information delivery as well. Therefore, the primary take-home message of the present study is that when designing mobile maps for wayfinding purposes, cartographers and the GIScience community should move past the “one fits all” mobile map design solution and start to consider wayfinders’ individual and group differences in spatial abilities (i.e. novice vs. experts), and different navigation tasks and use contexts (i.e. emergency tasks; Fabrikant, Citation2022; Griffin & Fabrikant, Citation2012; Griffin & White et al., Citation2017). Thus, developing mobile maps that would primarily accommodate the needs of novice users for efficient and effective wayfinding tasks and improved spatial learning. These mobile map design considerations will direct wayfinders’ visual attention to task-relevant features in the traversed environment for enhanced spatial knowledge acquisition while mitigating affect and cognitive demands related to navigation (Chrastil & Warren, Citation2012; Fabrikant, Citation2022; Willis et al., Citation2009).
Supplemental Material
Download MS Word (459.1 KB)Acknowledgments
The authors thank Stefano Villa for his help recruiting the participants and organizing the necessary logistics to run the experiment, and all the experts for participating in our study. The authors thank Dr. Tyler Thrash and Dr. Ian T. Ruginski for their invaluable comments on our evolving research program and this manuscript.
Supplementary material
Supplemental data for this article can be accessed online at https://doi.org/10.1080/15230406.2023.2183525.
Disclosure statement
No potential conflict of interest was reported by the author(s).
Data availability statement
The data and statistical analyses (R-code) that support the findings of this study are openly available in OSF at https://doi.org/10.17605/OSF.IO/QDTVW
Correction Statement
This article has been corrected with minor changes. These changes do not impact the academic content of the article.
Additional information
Funding
References
- Barr, D. J., Levy, R., Scheepers, C., & Tily, H. J. (2013). Random effects structure for confirmatory hypothesis testing: Keep it maximal. Journal of Memory and Language, 68(3), 255–278. https://doi.org/10.1016/j.jml.2012.11.001
- Bates, D., Mächler, M., Bolker, B., & Walker, S. (2015). Fitting linear mixed-effects models using lme4. Journal of Statistical Software, 67(1), https://doi.org/10.18637/jss.v067.i01
- Brügger, A., Richter, K. -F., & Fabrikant, S. I. (2019). How does navigation system behavior influence human behavior? Cognitive Research: Principles and Implications, 4(1), 5. https://doi.org/10.1186/s41235-019-0156-5
- Brunyé, T. T., Wood, M. D., Houck, L. A., & Taylor, H. A. (2017). The path more travelled: Time pressure increases reliance on familiar route-based strategies during navigation. The Quarterly Journal of Experimental Psychology, 70(8), 1439–1452. https://doi.org/10.1080/17470218.2016.1187637
- Chrastil, E. R., & Warren, W. H. (2012). Active and passive contributions to spatial learning. Psychonomic Bulletin & Review, 19(1), 1–23. https://doi.org/10.3758/s13423-011-0182-x
- Christou, C. G., & Bülthoff, H. H. (1999). View dependence in scene recognition after active learning. Memory & Cognition, 27(6), 996–1007. https://doi.org/10.3758/BF03201230
- Couclelis, H., Golledge, R. G., Gale, N., & Tobler, W. (1987). Exploring the anchor-point hypothesis of spatial cognition. Journal of Environmental Psychology, 7(2), 99–122. https://doi.org/10.1016/S0272-4944(87)80020-8
- Coutrot, A., Manley, E., Goodroe, S., Gahnstrom, C., Filomena, G., Yesiltepe, D., Dalton, R. C., Wiener, J. M., Hölscher, C., Hornberger, M., & Spiers, H. J. (2022). Entropy of city street networks linked to future spatial navigation ability. Nature, 604(7904), 104–110. https://doi.org/10.1038/s41586-022-04486-7
- Craig, M., Wolbers, T., Harris, M. A., Hauff, P., Della Sala, S., & Dewar, M. (2016). Comparable rest-related promotion of spatial memory consolidation in younger and older adults. Neurobiology of Aging, 48, 143–152. https://doi.org/10.1016/j.neurobiolaging.2016.08.007
- Credé, S., Thrash, T., Hölscher, C., & Fabrikant, S. I. (2019). The acquisition of survey knowledge for local and global landmark configurations under time pressure. Spatial Cognition & Computation, 19(3), 190–219. https://doi.org/10.1080/13875868.2019.1569016
- Credé, S., Thrash, T., Hölscher, C., & Fabrikant, S. I. (2020). The advantage of globally visible landmarks for spatial learning. Journal of Environmental Psychology, 67(October 2019), 101369. https://doi.org/10.1016/j.jenvp.2019.101369
- Dahmani, L., & Bohbot, V. D. (2020). Habitual use of GPS negatively impacts spatial memory during self-guided navigation. Scientific Reports, 10(1), 6310. https://doi.org/10.1038/s41598-020-62877-0
- De Sanctis, P., Solis-escalante, T., Seeber, M., Wagner, J., Ferris, D. P., & Gramann, K. (2021). Time to move: Brain dynamics underlying natural action and cognition. The European Journal of Neuroscience, 54(12), 8075–8080. https://doi.org/10.1111/ejn.15562
- Döllner, J. (2007). Non-photorealistic 3D geovisualization. In Multimedia cartography (pp. 229–240). https://doi.org/10.1007/978-3-540-36651-5_16
- Elias, B., & Paelke, V. (2008). User-centered design of landmark visualizations. In L. Meng, A. Zipf, & S. Winter (Eds.), Map-based mobile services (issue lecture notes in geoinformation and cartography (pp. 33–56). https://doi.org/10.1007/978-3-540-37110-6_3
- Etienne, A. S., & Jeffery, K. J. (2004). Path integration in mammals. Hippocampus, 14(2), 180–192. https://doi.org/10.1002/hipo.10173
- Fabrikant, S. I. (2022). Neuro-adaptive LBS: Towards human- and context-adaptive mobile geographic information displays (mGIDs) to support spatial learning for pedestrian navigation. In J. Krisp, L. Meng, H. Kumke, & and H. Huang (Eds.), Proceedings, 17th International Conference on Location Based Services (LBS 2022), Munich/Augsburg, Germany. (pp. 48–58).
- Farr, A. C., Kleinschmidt, T., Yarlagadda, P., & Mengersen, K. (2012). Wayfinding: A simple concept, a complex process. Transport Reviews, 32(6), 715–743. https://doi.org/10.1080/01441647.2012.712555
- Franke, C., & Schweikart, J. (2017). Mental representation of landmarks on maps: Investigating cartographic visualization methods with eye tracking technology. Spatial Cognition and Computation, 17(1–2), 20–38. https://doi.org/10.1080/13875868.2016.1219912
- Gardony, A. L., Brunyé, T. T., & Taylor, H. A. (2015). Navigational aids and spatial memory impairment: The role of divided attention. Spatial Cognition & Computation, 15(4), 246–284. https://doi.org/10.1080/13875868.2015.1059432
- Gardony, A. L., & Taylor, H. A. (2011). Affective states influence spatial cue utilization during navigation. Presence Teleoperators and Virtual Environments, 20(3), 223–240. https://doi.org/10.1162/PRES_a_00046
- Gelman, A., & Hill, J. (2006). Data analysis using regression and multilevel/hierarchical models. Cambridge University Press.
- Gramann, K., Hoepner, P., & Karrer-Gauss, K. (2017). Modified navigation instructions for spatial navigation assistance systems lead to incidental spatial learning. Frontiers in Psychology, 8, 193. https://doi.org/10.3389/fpsyg.2017.00193
- Griffin, A. L., & Fabrikant, S. I. (2012). More maps, more users, more devices means more cartographic challenges. The Cartographic Journal, 49(4), 298–301. https://doi.org/10.1179/0008704112Z.00000000049
- Griffin, A. L., White, T., Fish, C., Tomio, B., Huang, H., Sluter, C. R., Bravo, J. V. M., Fabrikant, S. I., Bleisch, S., Yamada, M., & Picanço, P. (2017). Designing across map use contexts: A research agenda. International Journal of Cartography, 3(sup1), 90–114. https://doi.org/10.1080/23729333.2017.1315988
- Hegarty, M., Montello, D. R., Richardson, A. E., Ishikawa, T., & Lovelace, K. (2006). Spatial abilities at different scales: Individual differences in aptitude-test performance and spatial-layout learning. Intelligence, 34(2), 151–176. https://doi.org/10.1016/j.intell.2005.09.005
- Hegarty, M., Smallman, H. S., Stull, A. T., & Canham, M. S. (2009). Naïve cartography: How intuitions about display configuration can hurt performance. Cartographica: The International Journal for Geographic Information and Geovisualization, 44(3), 171–186. https://doi.org/10.3138/carto.44.3.171
- Hegarty, M., & Waller, D. (2004). A dissociation between mental rotation and perspective-taking spatial abilities. Intelligence, 32(2), 175–191. https://doi.org/10.1016/j.intell.2003.12.001
- Hejtmánek, L., Oravcová, I., Motýl, J., Horáček, J., & Fajnerová, I. (2018). Spatial knowledge impairment after GPS guided navigation: Eye-tracking study in a virtual town. International Journal of Human-Computer Studies, 116, 15–24. https://doi.org/10.1016/j.ijhcs.2018.04.006
- Hilton, C., Johnson, A., Slattery, T. J., Miellet, S., & Wiener, J. M. (2021). The impact of cognitive aging on route learning rate and the acquisition of landmark knowledge. Cognition, 207, 104524. https://doi.org/10.1016/j.cognition.2020.104524
- Hilton, C., Miellet, S., Slattery, T. J., & Wiener, J. (2020). Are age-related deficits in route learning related to control of visual attention? Psychological Research, 84(6), 1473–1484. https://doi.org/10.1007/s00426-019-01159-5
- Holmqvist, K., Nyström, M., Andersson, R., Dewhurst, R., Jarodzka, H., & Van de Weijer, J. (2011). Eye tracking: A comprehensive guide to methods and measures. OUP Oxford.
- Huffman, D. J., & Ekstrom, A. D. (2019). Which way is the bookstore? A closer look at the judgments of relative directions task. Spatial Cognition and Computation, 19(2), 93–129. https://doi.org/10.1080/13875868.2018.1531869
- Ishikawa, T. (2019). Satellite navigation and geospatial awareness: Long-term effects of using navigation tools on wayfinding and spatial orientation. The Professional Geographer, 71(2), 197–209. https://doi.org/10.1080/00330124.2018.1479970
- Ishikawa, T. (2022). Individual differences and skill training in cognitive mapping: How and why people differ. Topics in Cognitive Science, 00(1), 1–24. https://doi.org/10.1111/tops.12605
- Ishikawa, T., Fujiwara, H., Imai, O., & Okabe, A. (2008). Wayfinding with a GPS-based mobile navigation system: A comparison with maps and direct experience. Journal of Environmental Psychology, 28(1), 74–82. https://doi.org/10.1016/j.jenvp.2007.09.002
- Ishikawa, T., & Montello, D. R. (2006). Spatial knowledge acquisition from direct experience in the environment: Individual differences in the development of metric knowledge and the integration of separately learned places. Cognitive Psychology, 52(2), 93–129. https://doi.org/10.1016/j.cogpsych.2005.08.003
- Kapaj, A., Lanini-Maggi, S., & Fabrikant, S. I. (2021a). The impact of landmark visualization style on expert wayfinders’ cognitive load during navigation. Abstracts of the ICA, 3, 1–3. https://doi.org/10.5194/ica-abs-3-138-2021
- Kapaj, A., Lanini-Maggi, S., & Fabrikant, S. I. (2021b). The influence of landmark visualization style on expert wayfinders’ visual attention during a real-world navigation task. UC Santa Barbara: Center for Spatial Studies, 3, 1–6. https://doi.org/10.25436/E2NP44
- Keehner, M. M., Tendick, F., Meng, M. V., Anwar, H. P., Hegarty, M., Stoller, M. L., & Duh, Q. -Y. (2004). Spatial ability, experience, and skill in laparoscopic surgery. American Journal of Surgery, 188(1), 71–75. https://doi.org/10.1016/j.amjsurg.2003.12.059
- Keil, J., Edler, D., Dickmann, F., & Kuchinke, L. (2022). Uncertainties in spatial orientation: Critical limits for landmark inaccuracies in maps in the context of map matching. KN - Journal of Cartography and Geographic Information, 72(3), 243–254. https://doi.org/10.1007/s42489-022-00105-7
- Keil, J., Edler, D., Kuchinke, L., & Dickmann, F. (2020). Effects of visual map complexity on the attentional processing of landmarks. Plos One, 15(3), e0229575. https://doi.org/10.1371/journal.pone.0229575
- Keil, J., Edler, D., Reichert, K., Dickmann, F., & Kuchinke, L. (2020). Structural salience of landmark pictograms in maps as a predictor for object location memory performance. Journal of Environmental Psychology, 72, 101497. https://doi.org/10.1016/j.jenvp.2020.101497
- Kiefer, P., Giannopoulos, I., & Raubal, M. (2014). Where am i? Investigating map matching during self-localization with mobile eye tracking in an urban environment. Transactions in GIS, 18(5), 660–686. https://doi.org/10.1111/tgis.12067
- Koletsis, E., van Elzakker, C. P. J. M., Kraak, M. -J., Cartwright, W., Arrowsmith, C., & Field, K. (2017). An investigation into challenges experienced when route planning, navigating and wayfinding. International Journal of Cartography, 3(1), 4–18. https://doi.org/10.1080/23729333.2017.1300996
- Kray, C., Elting, C., Laakso, K., & Coors, V. (2003). Presenting route instructions on mobile devices. In Proceedings of the 8th International Conference on Intelligent User Interfaces (pp. 117–124). https://doi.org/10.1145/604045.604066
- Krejtz, K., Duchowski, A., Szmidt, T., Krejtz, I., Perilli, F. G., Pires, A., Vilaro, A., & Villalobos, N. (2015). Gaze transition entropy. ACM Transactions on Applied Perception, 13(1), 1–20. https://doi.org/10.1145/2834121
- Kruschke, J. K. (2014). Doing Bayesian data analysis: A tutorial with R, JAGS, and stan (2nd ed.). Academic Press.
- Lanini-Maggi, S., Ruginski, I. T., Shipley, T. F., Hurter, C., Duchowski, A. T., Briesemeister, B. B., Lee, J., & Fabrikant, S. I. (2021). Assessing how visual search entropy and engagement predict performance in a multiple-objects tracking air traffic control task. Computers in Human Behavior Reports, 4, 100127. https://doi.org/10.1016/j.chbr.2021.100127
- Liao, H., Dong, W., Peng, C., & Liu, H. (2017). Exploring differences of visual attention in pedestrian navigation when using 2D maps and 3D geo-browsers. Cartography and Geographic Information Science, 44(6), 474–490. https://doi.org/10.1080/15230406.2016.1174886
- Lokka, I. E., & Çöltekin, A. (2019). Toward optimizing the design of virtual environments for route learning: Empirically assessing the effects of changing levels of realism on memory. International Journal of Digital Earth, 12(2), 137–155. https://doi.org/10.1080/17538947.2017.1349842
- Lokka, I. E., Çöltekin, A., Wiener, J., Fabrikant, S. I., & Röcke, C. (2018). Virtual environments as memory training devices in navigational tasks for older adults. Scientific Reports, 8(1), 10809. https://doi.org/10.1038/s41598-018-29029-x
- Lüdecke, D. (2020). sjPlot: Data visualization for statistics in social science (R package version 2.8.6).
- Maggi, S., Fabrikant, S. I., Imbert, J. -P., & Hurter, C. (2016). How do display design and user characteristics matter in animations? An empirical study with air traffic control displays. Cartographica: The International Journal for Geographic Information and Geovisualization, 51(1), 25–37. https://doi.org/10.3138/cart.51.1.3176
- Meneghetti, C., Miola, L., Feraco, T., Muffato, V., & Miola, T. F. (2022). Individual differences in navigation: An introductory overview. In P. Raj (Ed.), Prime archives in psychology (2nd ed., pp. 1–52). Vide Leaf. https://videleaf.com/individual-differences-in-navigation-an-introductory-overview/
- Münzer, S., Fehringer, B. C. O. F., & Kühl, T. (2016). Validation of a 3-factor structure of spatial strategies and relations to possession and usage of navigational aids. Journal of Environmental Psychology, 47, 66–78. https://doi.org/10.1016/j.jenvp.2016.04.017
- Münzer, S., & Hölscher, C. (2011). Entwicklung und Validierung eines Fragebogens zu räumlichen Strategien. Diagnostica, 57(3), 111–125. https://doi.org/10.1026/0012-1924/a000040
- Münzer, S., Zimmer, H. D., & Baus, J. (2012). Navigation assistance: A trade-off between wayfinding support and configural learning support. Journal of Experimental Psychology Applied, 18(1), 18–37. https://doi.org/10.1037/a0026553
- Münzer, S., Zimmer, H. D., Schwalm, M., Baus, J., & Aslan, I. (2006). Computer-assisted navigation and the acquisition of route and survey knowledge. Journal of Environmental Psychology, 26(4), 300–308. https://doi.org/10.1016/j.jenvp.2006.08.001
- Newcombe, N. S. (2018). Individual variation in human navigation. Current Biology, 28(17), R1004–1008. https://doi.org/10.1016/j.cub.2018.04.053
- Newcombe, N. S., Hegarty, M., & Uttal, D. (2022). Building a cognitive science of human variation: Individual differences in spatial navigation. Topics in Cognitive Science, 0(1), 1–9. https://doi.org/10.1111/tops.12626
- Ooms, K., De Maeyer, P., & Fack, V. (2014). Study of the attentive behavior of novice and expert map users using eye tracking. Cartography and Geographic Information Science, 41(1), 37–54. https://doi.org/10.1080/15230406.2013.860255
- Oulasvirta, A., Estlander, S., & Nurminen, A. (2009). Embodied interaction with a 3D versus 2D mobile map. Personal and Ubiquitous Computing, 13(4), 303–320. https://doi.org/10.1007/s00779-008-0209-0
- Plesa, M. A., & Cartwright, W. (2008). Evaluating the effectiveness of non-realistic 3D maps for navigation with mobile devices. In L. Meng, A. Zipf, & S. Winter (Eds.), Map-based mobile services (pp. 80–104). Springer. https://doi.org/10.1007/978-3-540-37110-6_5
- Raubal, M., & Winter, S. (2002). Enriching wayfinding instructions with local landmarks. In International conference on geographic information science (pp. 243–259). https://doi.org/10.1007/3-540-45799-2_17
- Richter, K. -F., & Winter, S. (2014). Landmarks. Springer.
- Ricker, B., & Roth, R. (2018). Mobile maps and responsive design. Geographic Information Science & Technology Body of Knowledge, 2018, CV–40. https://doi.org/10.22224/gistbok/2018.2.5
- Rosenholtz, R., Li, Y., & Nakano, L. (2007). Measuring visual clutter. Journal of Vision, 7(2), 17. https://doi.org/10.1167/7.2.17
- Röser, F. (2017). A cognitive observer-based landmark-preference model. KI - Künstliche Intelligenz, 31(2), 169–171. https://doi.org/10.1007/s13218-016-0475-3
- Ruginski, I. T., Creem-Regehr, S. H., Stefanucci, J. K., & Cashdan, E. (2019). GPS use negatively affects environmental learning through spatial transformation abilities. Journal of Environmental Psychology, 64, 12–20. https://doi.org/10.1016/j.jenvp.2019.05.001
- SMI. (2015). Begaze manual version 3.5.
- Steck, S. D., & Mallot, H. A. (2000). The role of global and local landmarks in virtual environment navigation. Presence Teleoperators and Virtual Environments, 9(1), 69–83. https://doi.org/10.1162/105474600566628
- Tatler, B. W., Gilchrist, I. D., & Land, M. F. (2005). Visual memory for objects in natural scenes: From fixations to object files. The Quarterly Journal of Experimental Psychology Section A, 58(5), 931–960. https://doi.org/10.1080/02724980443000430
- Thrash, T., Fabrikant, S. I., Brügger, A., Do, C. T., Huang, H., Richter, K. F., Lanini-Maggi, S., Bertel, S., Credé, S., Gartner, G., & Münzer, S. (2019). The future of geographic information displays from giscience, cartographic, and cognitive science perspectives. In S. Timpf, C. Schlieder, M. Kattenbeck, B. Ludwig, & K. Stewart (Eds.), 14th International Conference on Spatial Information Theory (Vol. 142, pp. 19:119:119:11). https://doi.org/10.4230/LIPIcs.COSIT.2019.19
- Wenczel, F., Hepperle, L., & von Stülpnagel, R. (2017). Gaze behavior during incidental and intentional navigation in an outdoor environment. Spatial Cognition & Computation, 17(1–2), 121–142. https://doi.org/10.1080/13875868.2016.1226838
- Wickham, H. (2011). ggplot2. Wiley Interdisciplinary Reviews Computational Statistics, 3(2), 180–185. https://doi.org/10.1002/wics.147
- Wilkening, J., & Fabrikant, S. I. (2013). How users interact with a 3D geo-browser under time pressure. Cartography and Geographic Information Science, 40(1), 40–52. https://doi.org/10.1080/15230406.2013.762140
- Willis, K. S., Hölscher, C., Wilbertz, G., & Li, C. (2009). A comparison of spatial knowledge acquisition with maps and mobile maps. Computers, Environment and Urban Systems, 33(2), 100–110. https://doi.org/10.1016/j.compenvurbsys.2009.01.004
- Winter, S., Raubal, M., & Nothegger, C. (2005). Focalizing measures of salience for wayfinding. In Map-based mobile services (pp. 125–139). https://doi.org/10.1007/3-540-26982-7_9
- Wolfe, J. M., & Horowitz, T. S. (2017). Five factors that guide attention in visual search. Nature Human Behaviour, 1(3), 0058. https://doi.org/10.1038/s41562-017-0058
- Woollett, K., & Maguire, E. A. (2010). The effect of navigational expertise on wayfinding in new environments. Journal of Environmental Psychology, 30(4), 565–573. https://doi.org/10.1016/j.jenvp.2010.03.003
- Woollett, K., Spiers, H. J., & Maguire, E. A. (2009). Talent in the taxi: A model system for exploring expertise. Philosophical Transactions of the Royal Society B: Biological Sciences, 364(1522), 1407–1416. https://doi.org/10.1098/rstb.2008.0288
- Yesiltepe, D., Conroy Dalton, R., & Ozbil Torun, A. (2021). Landmarks in wayfinding: A review of the existing literature. Cognitive Processing, 22(3), 369–410. https://doi.org/10.1007/s10339-021-01012-x