
 ?Mathematical formulae have been encoded as MathML and are displayed in this HTML version using MathJax in order to improve their display. Uncheck the box to turn MathJax off. This feature requires Javascript. Click on a formula to zoom.
ABSTRACT
Cryoconite holes are the most active and diverse microbial habitats on glacier and ice-sheet surfaces. In this article the authors demonstrate that the shape of cryoconite holes varies depending on ice-surface topography and that this has implications for the carbon cycling regime within. Net ecosystem production is shown to be controlled primarily by sediment thickness within holes. The authors show that irregular hole shapes are indicative of hole migration away from topographic shade, which promotes carbon fixation at the mesoscale on ice surfaces. A cellular automaton is used in conjunction with sediment-delivery experiments to show that migration is the result of simple sediment transfer processes, implying a relationship between ice-surface evolution and cryoconite biogeochemistry that has not previously been examined.
Introduction
Melt features called cryoconite holes are ubiquitous on ablating glacial ice worldwide. In Arctic and lower latitude environments during summer these are usually water-filled depressions containing small (1–10 mm) granules of organic and inorganic matter on their floors (Hodson et al. Citation2008). They form because cryoconite granules have sufficient density to resist removal by meltwater and settle in microtopographic lows on ice surfaces (Langford et al. Citation2010). There, because of their low albedo (Agassiz Citation1846; Nordenskjold Citation1875; Phillip Citation1912; Gribbon Citation1979; McIntyre Citation1984; Wharton et al. Citation1985; Bøggild et al. Citation1997; Takeuchi, Nishiyama, and Li Citation2010) they locally enhance the transfer of solar energy to the ice surface and accelerate ablation (Gribbon Citation1979), descend into the shallow subsurface, and create holes (Wharton et al. Citation1985; McIntyre Citation1984). The depth of the holes is controlled by the local optical properties of the ice, the albedo of the cryoconite, and the solar irradiance incident on the hole floor (Gribbon Citation1979). An “equilibrium depth” is attained when the melt rate at the hole floor is equal to the lowering of the wider ice surface. Importantly, this equilibrium depth varies according to the irradiance of the hole floor. The diameter of these holes is controlled primarily by sediment supply, since a process of “lateral equilibration” has been identified (Cook et al. Citation2010), whereby thick layers of granules spread out to cover the maximum possible surface area and drive hole expansion.
Cryoconite holes have long been recognized as sites of high microbial diversity and activity in the supraglacial zone (Hodson et al. Citation2008); however, only recently have cryoconite holes been suggested to be biocryomorphic (Cook et al. Citation2015a) features resulting from engineering by microbiota (Cook et al. Citation2015b; Edwards et al. Citation2014; Langford et al. Citation2010). Filamentous cyanobacteria facilitate the entangling of supraglacial debris into coherent granules and cement them with extracellular polymeric substances (Langford et al. Citation2010). This process of growth and stabilization allows granules to settle for long enough to form cryoconite holes. The holes are then shaped by spatial heterogeneities in melt rates, creating favorable habitats for primary production (Cook et al. Citation2016a, Citation2010), which in turn feeds back into granule growth and stability, thus providing quasi-stable habitats for diverse microbiota in an otherwise hostile glacial environment. The ecosystems inhabiting cryoconite holes are known to cycle carbon (Anesio et al. Citation2009; Stibal et al. 2012; Chandler et al. Citation2015), and may influence the quantity and quality of carbon exports to extraglacial systems (Hood et al. Citation2009), depending on local physical controls, including slope-driven surface hydrology (Stibal et al. Citation2012).
The structure and function of microbial communities in cryoconite holes have recently been shown to be sensitive to environmental conditions (Cook et al. Citation2016a; Edwards et al. Citation2011). Together with the knowledge that hole floor irradiance is a primary environmental variable controlled by the hole morphology (Cook et al. Citation2016a, Citation2010; Gribbon Citation1979), it is surprising that no studies to date have examined microbial activity in holes with contrasting shapes. Furthermore, given the well-known influence of surface topography on spatial patterns of ice-surface ablation (e.g., Arnold et al. Citation2006), it is also surprising that no previous studies have explicitly examined the shape and microbial activity of cryoconite in different topographic regimes. Given the potential for cryoconite holes to change their shape in response to environmental conditions and the sensitivity of cryoconite ecosystems to hole-floor conditions, deeper understanding of the relationships between biota, hole shapes, and surface topography may well be crucial for predicting mesoscale (between plot and landscape scales) energy balance, microbial activity, and their associated interactions. Furthermore, cryoconite hole formation and evolution processes might be crucial for characterizing dark ice on the Greenland Ice Sheet (Shimada, Takeuchi, and Aoki Citation2016).
This study, therefore, aimed to test the hypotheses that (1) distinct hole shapes are associated with different topographic settings on ice surfaces, (2) hole shapes influence rates of microbial activity, and (3) irregular hole shapes arise when migration of the cryoconite occurs (moving away from shade driven by slope-induced sediment dynamics). These hypotheses were tested by analyzing images from UAV flights, measuring net ecosystem productivity in a range of aspects, and applying a novel cellular automaton governed by simple sediment-transfer rules.
Field site
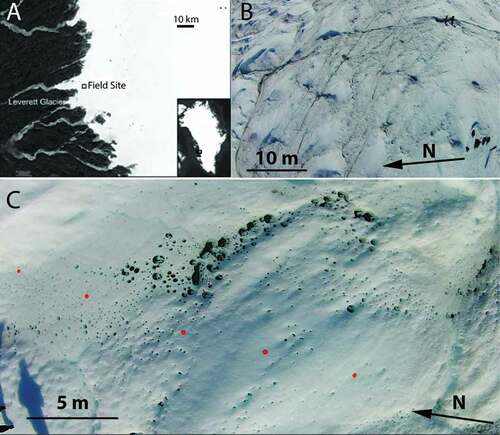
This work was carried out at a 200 × 200 m field site about 3 km from the western margin of the Greenland Ice Sheet, near Kangerlussuaq (67 09.833ʹN 050 00.89ʹW; ) between July 25 and August 1, 2015. The site was selected because it exhibited a range of ice topographies, including long slopes with northerly and southerly aspects, as well as areas of flat ice on topographic plateaus and in depressions. North- and south-facing slopes were selected for study because they show the greatest variation in illumination conditions during diurnal timescales and therefore represent end-member scenarios for testing our hypothesis of shade-driven cryoconite migration. The slope aspect was measured using a compass aligned parallel to the main slope. The selected north and south slopes were oriented within 10 degrees of the compass-measured north and south aspects. The ice surface at this site is characterized by large (101 m) steeply sloping hummocks resulting from active ice motion and deformation (Chandler, Waller, and Adam Citation2005), crevassing because of tensile extension (e.g., Hubbard et al. Citation1998; Colgan et al. Citation2016) and relief exaggeration by rapid surface melting (van de Wal et al. Citation2012). The cryoconite holes observed in this study were all water filled to some extent, although the water levels were not measured.
Figure 1. (A) Map of southern west Greenland with the field site marked with a black square. (B) Aerial photograph of the field site with three persons plus rucksacks for scale. (C) Example aerial image from our UAV footage with orange scale markers (90 mm diameter) visible
Methods
UAV imagery
A DJI Phantom Vision +2 Quadcopter (hereafter UAV) was flown along north–south-oriented transects. Footage was recorded using the UAV’s in-built HD (1080/60i) camera, controlled using the DJI Phantom app on a Sony Xperia smartphone. The footage was split into still images covering the ice surface between each marker (e.g., ). ImageJ’s (Version 1.48, http://imagej.nih.gov/) “color split” tool was used to isolate the blue channel, which maximized the contrast among ice surface, cryoconite, and shadow. Image brightness and contrast were then manually adjusted to enhance the distinction between ice and cryoconite. Scale markers, along with any remaining shadows or dark areas of waterlogged ice, were manually erased using ImageJ’s brush tool. The image was then converted to binary, and ImageJ’s “analyze particles” tool was used to obtain frequency, coverage, and geometric data for cryoconite holes. We only included holes where the area exceeded 3 cm2, because holes smaller than this were often indistinguishable from shadows or microtopographic features of weathered ice. ImageJ was used to quantify hole area, perimeter, Feret diameter, aspect ratio, circularity, roundness, and solidity for each image. Roundness and circularity are distinct in that roundness is a measure of surface irregularity, whereas circularity measures the relationship between the area and perimeter of an object (see the ImageJ user guide for equations: https://imagej.nih.gov/ij/docs/guide/146-30.html#toc-Subsection-30.7). The data from each image were also binned according to topography (north-sloping, south-sloping, or flat ice). Because our sample populations in each topographic type were typically large (n ≫ 20) it was possible to obtain landscape-level perimeter-area fractal dimensions (Dp) for each of the topographic settings. This metric provides a statistical measure of shape complexity for the cryoconite holes in each binary image. This was achieved using the following equation related to perimeter-area relationship (Burrough Citation1986):
Where A is hole area, P is hole perimeter, and Dp is fractal dimension. The slope of the regression line (s) between log(A) and log(B) is equal to 2/Dp, so that Dp is equal to 2/s (Klinkenberg Citation1994; O’Neill et al. Citation1988). Landscapes containing only perfectly circular patches are characterized by Dp = 1, while increasingly convoluted patch shapes increase the value of Dp to a maximum of 2. Finally, the slope and aspect of the ice in each image was verified using a compass-clinometer.
Overload experiments
We hypothesized that cryoconite hole morphodynamics result in, and from, sediment transfer between merging holes. We simulated this by “dumping” excess cryoconite into already formed “natural” cryoconite holes, thereby artificially overloading the natural sediment volume. Holes in each of the four topographic settings (north-sloping [8°], south sloping [12°], high flat, and low flat) were selected on the basis of their apparent stability, as indicated by circular shapes in plan view and flat floors occupied by single grain layers of cryoconite. Cryoconite sourced from nearby cryoconite holes was added to each using a sterile syringe to increase the initial volume by a factor of either 3 or 5. In Overload Experiment 1, holes were selected that were apparently unaffected by hydrologic flow and were far from any supraglacial hydrologic features. In Overload Experiment 2, holes in close proximity to rills and streams were selected. The hole floor diameter was then measured daily using callipers and the sediment thickness, measured using a graded skewer along six radial axes. Because these experiments were undertaken in small cryoconite holes on gently north-sloping ice, we compared our findings with data obtained from the same experiment undertaken at a field site 38 km from the ice margin, also on the K-transect, in July 2014. There, the mesoscale ice-surface slope was diminished, but the holes were shaded by steep topographic “wind sail” features (see Cook et al. Citation2016a for site description).
Net ecosystem productivity
Net ecosystem productivity (hereafter NEP) was measured using the well-established “total dissolved inorganic carbon” method (Hodson, Cameron, and Bøggild et al. Citation2010; Telling et al. Citation2010). In brief, holes were selected randomly in each of four topographic settings, with the only selection criteria being that holes were within the middle 60 percent of ice slopes, or in the case of flat ice, positioned away from topographic features that may have shaded the hole floors, and that the holes were large enough to accommodate a 60 mL cylindrical, snap-lid NEP pot (Azlon Plastics, Cambridge). Sediment was carefully added to the NEP pots using a sterile syringe with thicknesses equal to that in the holes in which they were incubated, thereby simulating the conditions at the hole floor.
In cryopools (cryoconite features with >200 cm2 area, as discussed later in the article), NEP incubations were established in the upslope and downslope areas of the hole floor simultaneously. In both cases the local sediment thicknesses were recreated in the NEP pots after careful measurement with a graded skewer. All NEP incubations were left in situ for 24 ± 1 hr before the change in total dissolved inorganic carbon was measured by acidifying the sample with 1 mL 1 percent HCl, degassing into a 25 mL CO2-scrubbed headspace and injecting into a PP Systems EGM4 Infrared gas analyzer.
Cellular automaton
A simple cellular automaton was developed in Python 3.4 (using packages in the Anaconda 2.3.0 Windows 64-bit distribution) to test whether the morphology of cryoconite holes on north-sloping ice could be explained using simple rules of downslope sediment transfer. We simulated a patch of north-sloping ice, seeded with cryoconite holes containing granules in random thicknesses between one and six grains. At each timestep any cell where the cryoconite thickness was greater than one granule reduced its granule thickness by one. The thickness of cryoconite in one of three randomly selected adjacent downslope cells (straight down, diagonally left, diagonally right) simultaneously increased by one, representing melting of the downslope hole wall and redistribution of sediment into the newly formed space (Cook et al. Citation2010). The automaton was run five times with identical initial conditions (45,000 cells in a 200 × 225 grid, 1 percent total areal coverage by cryoconite, equal probability of each granule thickness in cryoconite-filled cells) over 200 time steps. We included a flat area at the base of the slope where migration was slower (simulating the diminished influence of slope effects on hole migration) in order to determine whether the same rules can explain the formation of cryopools at breaks in slope. The modeled ice surfaces were analyzed using ImageJ to determine values for circularity, aspect ratio, solidity, and roundness for the UAV imagery. Time was dimensionless in this model, with one timestep representing the time taken for a layer of cryoconite in a cryoconite hole to melt its downslope wall a distance of one pixel, and cryoconite sediment is assumed to instantaneously spread to fill the newly created space. Only north-facing slopes were modeled here because we found no net migration of sediment in loaded or natural cryoconite holes in our field experiments. To model south-facing slopes under this framework is simply to remove the drivers of sediment migration, which results in no change to the initial cryoconite distribution.
Results
Hole shapes
The shapes of 2,344 cryoconite holes were characterized using semiautomated analysis of UAV images. These comprised 1,534 holes on north-facing slopes, 352 on south-facing slopes, and 458 on flat ice. Across all slopes and aspects, small cylindrical cryoconite holes (<10 cm2) were the most common type (comprising 72 percent of the total measured). However, irregularly shaped cryoconite holes were also common on north-sloping ice. All six shape descriptors showed significant differences between holes on north-sloping ice and the other topographic settings (ANOVA with post-hoc Tukey test; F > 5.8, p < .003; ). The average area of holes on north-sloping ice was 16.5 cm2, compared to 7.9 cm2 on south-facing slopes and 9.2 cm2 on flat ice. Only 56.85 percent of all holes on north slopes had circularity greater than 0.8 (representing cylindrical holes), compared to 86.07 percent and 93.45 percent on south-facing slopes and flat ice, respectively. In terms of spatial coverage, 25.6 percent of the total areal coverage by cryoconite on north-sloping ice comprised cylindrical holes (circularity >0.8) and almost the same proportion (24.08%) had circularity <0.5. In contrast, no holes on flat ice and just 2.8 percent of holes on south-sloping ice had circularity <0.5. Aspect ratios were significantly higher and solidity significantly lower for cryoconite holes on north-sloping ice than flat or south-sloping ice (). The average fractal dimension was highest for north slopes (Dp = 1.31 for north-slope ice; Dp = 1.24 for south-slope ice; Dp = 1.10 for flat ice).
Table 1. One-way ANOVA to test for significant differences among any of north-sloping, south-sloping, or flat ice for each shape descriptor. The significant pairs were identified using a post-hoc Tukey test
Cryopools
At the base of north slopes we identified several large (>200 cm2) cryoconite features. The apex of their convex walls invariably pointed north. We deemed these features to be cryopools formed by the coalescence of several cryoconite holes. The area of these cryopools ranged from 220.7 cm2 to 1558.5 cm2. While accounting for just 0.65 percent of the cryoconite holes on north-facing slopes, cryopools contributed 26 percent of the total area covered by cryoconite on north-facing slopes. For example photographs, see the large features in .
Figure 2. Mean sediment thickness for all holes (A) and after removal of hydrologically connected holes (B). Mean slope of linear trend fit to sediment thickness data for all holes (C) and after removal of hydrologically connected holes (D). In all four panels error bars are 1 sigma
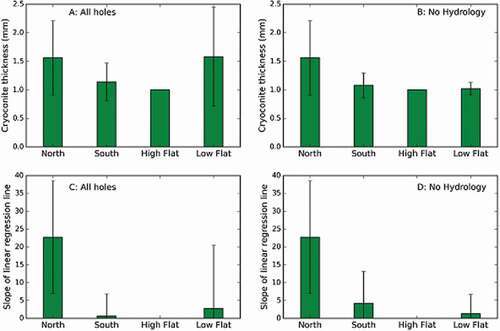
Figure 3. Sequential snapshots of the hole sediment thickness on the hole floor in four holes. The three columns are three time points after initial overload (on Day 2, Day 5 and Day 7). The rows are different holes. North = hole on north slope; Flat = hole on flat ice; South = hole on south-sloping ice; Hydro = hole on flat ice that was invaded by hydrological flow. The color bar refers to the thickness of cryoconite. Measurements were made every 10 mm along each axis and joined with straight lines. These are examples selected from the full dataset
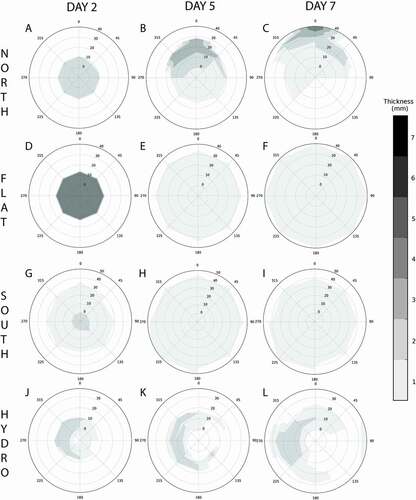
Figure 4. (A) Plot of NEP values for holes in each of the four topographic settings. (B) Plot of NEP values at the downslope (blue) and upslope edges of cryopools
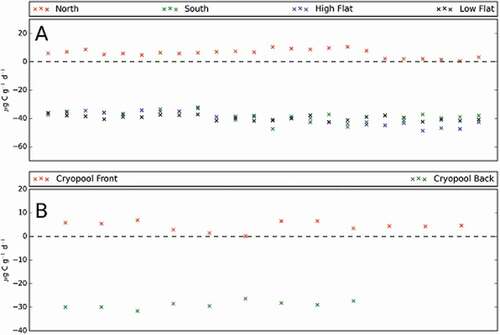
Figure 5. Sequential snapshots of the simulated ice surface at timesteps 1, 5, 10, 50, 100, and 200. Each grid consists of 100 columns and 150 rows. The upper 125 rows are sloping from the top to bottom of the frame and the lower 25 rows are flat. The initial conditions were: 2 percent surface coverage, sediment delivery to one row every five timesteps, single layer speed = 0.25, multilayer speed = 0.6, flat speed = 0.05. The color bar refers to the thickness of cryoconite in each cell
Figure 6. Change in cryoconite hole frequency (A), area (B), circularity (C), and roundness (D) over time as predicted by our cellular automaton
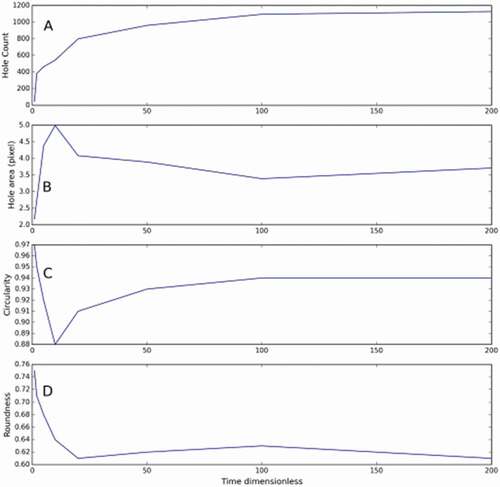
Figure 7. Schematic showing the proposed mechanism of cryoconite hole migration driven by topographic shading. In (A) the hole is shaded by the topographic rise, leading to heterogeneous hole-floor irradiance. This enhances melting in the illuminated areas, causing the hole floor to slope. The result of this is that cryoconite slumps downslope because of gravity, banking up against the downslope wall. Because of thermal fluxes through the dark sediment layer, this downslope wall melts more rapidly, ceating space for the cryoconite granules to slump into, advancing the hole wall further. In (B) the mechanism of cryopool formation is illustrated, whereby holes that migrate downslope eventually coalesce at the break of the slope, where the driving force of topographic shading is diminished. In (C) a south-facing slope is shown for contrast. The more prolonged illumination at more vertical solar angles prevents uneven melting of the hole floor and promotes a deep, flat-floored, cylindrical hole morphology rather than complex shapes and hole migration. The North arrow applies to all subfigures
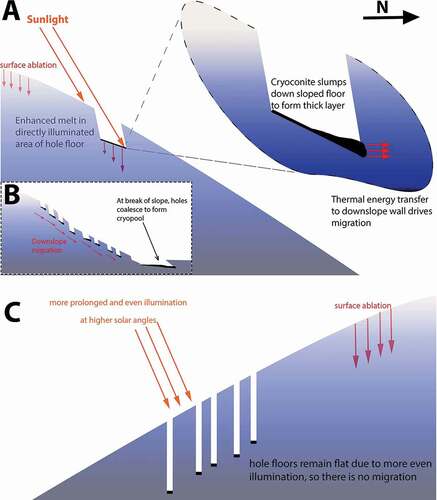
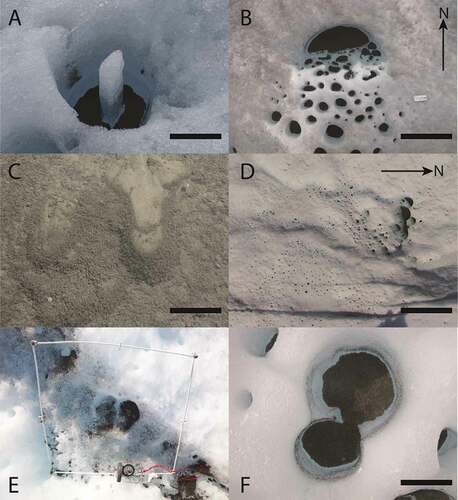
Figure 8. (A) A naturally occurring pinnacle formed by exposure of bare ice during sediment migration (scale bar = 30 cm). (B) A sequence of cryoconite holes becoming more irregularly shaped with distance down a short north slope, and a cryopool at the slope base (scale bar = 50 cm). (C) Mass-movement morphology in the upslope area of a cryopool, immediately downslope of a relict cryoconite hole (scale bar = 10 cm). (D) An example image from a UAV flyover showing cryoconite holes on a north slope with a series of cryopools at the slope base (scale bar = 5 m). (E) A quadrat over a “track” running top left to bottom right (quadrat = 50 cm). (F) Two cryoconite holes merging because of hole migration (scale bar = 30 cm)
Sediment distribution
Irregular hole shapes were also associated with nonuniform sediment distribution. In general, holes in flat or south-sloping ice had flat hole floors and uniform, single-grain layers of cryoconite. In contrast, north-sloping ice tended to have uneven sediment arrangements with thicker deposits toward the northern, downslope hole wall. The mean slopes of linear trend lines fit to thickness measurements along each intra-hole transect indicate a much stronger positive N-S trend in layer thickness in holes in north-sloping ice than in the other topographic settings. This is further supported by a greater mean sediment thickness (). In some cases, nonuniform sediment arrangements were observed on flat and south-sloping ice, but these all occurred in close proximity to a supraglacial rill or stream where there was increased hydrologic disturbance. Data from all holes, and after removal of those holes particularly strongly influenced by hydrological disturbance, are presented separately in . Within cryopools very uneven sediment distributions were observed, ranging from single grain layers at the upslope areas to 10 mm near the northern walls.
Overloaded holes
Overloaded cryoconite holes expanded symmetrically in flat and south-sloping ice where the holes were away from hydrologic flow. On north-sloping ice, overloaded holes preferentially expanded toward the north, accompanied by a northward shift in cryoconite granules (mean centroid displacement = 30 mm, compared to <8 mm and in no consistent direction on south-sloping and flat ice and in the control holes). There was a significant difference in the hole area (p < .001) between the start and end of the overload period for all overloaded holes and no significant difference for the control holes. The aspect ratios, roundness, and circularity of overloaded holes on north-sloping ice were not significantly different to those of south-sloping or flat ice at the start of the experiment; however, by day 7 all showed significant differences (two-sample t test assuming equal variance, t = −5.46, df = 10, p < .05 for circularity; t = 3.57, df = 10, p < .05 for AR; t = −3.22, df 10, p < .01 for roundness).
Hydrologic influence on hole development
Some holes were particularly strongly influenced by hydrologic flow, as was clearly indicated by visible water flow within cryoconite holes or the motion of small debris on the hole-water surface. The sediment thickness in these holes generally increased across the hole floors aligned with the flow direction (). In the overload experiments, these hydrologically influenced holes developed assymetrically, preferentially expanding in the direction of prevailing flow following a shift in sediment toward the downstream hole wall, in some cases exposing bare ice that ablated more slowly than the surrounding cryoconite-covered ice, causing ice pinnacles to form (, ).
NEP
Cryoconite holes on north-sloping ice were consistently net heterotrophic (although occasionally close to balance) while those on south-sloping and flat ice were net autotrophic. Single-factor ANOVA revealed significant variation between the NEP data in each setting (F = 24.76, p = 1.26 × 10⁻¹²) and a post-hoc Tukey HSD analysis revealed that this was driven by a significant difference between the north slopes and the other three topographic settings (). In cryopools, there was significant variation in NEP between the upslope and downslope areas (), where thin sediment layers upslope were net autotrophic while thick sediment layers at the downslope periphery were net heterotrophic.
Table 2. Results of post-hoc Tukey HSD test between NEP data in each topographic setting (significant differences marked with asterisk)
Cellular automaton
On the basis of our observations, a cellular automaton was developed to test the hypothesis that the complex hole shapes and sediment arrangements observed in north-sloping ice could be explained by simple gravity-driven sediment transfer rules. The modeled north-sloping surfaces developed irregularly shaped holes that approximate the shape of holes in our UAV images (, ). The model ran for 200 timesteps. Simulated surfaces were plotted after 1, 5, 10, 50, 100, and 200 timesteps ( and ). As time progressed, the mean areal coverage and mean aspect ratio of the cryoconite holes increased to a maximum at t = 10. After this, the values of these shape descriptors gradually declined. Hole circularity and roundness decreased to their minimum values at t = 10, before gradually increasing to t = 200. During the same period, the total number of cryoconite holes increases logarithmically (: r2 = 0.97, p = 1.21 × 10⁻⁵). This suggests that distinct periods of response to sediment delivery or slope exaggeration are followed by a maturation of the ice surface, characterized by more numerous, smaller, circular holes. The simulated ice surface was most similar to our UAV imagery after ten timesteps, suggesting that the real slope was in the early stages of responding to either sediment delivery or slope exaggeration. During the time period cryoconite was observed to accumulate at the base of the slope and form complexes broadly consistent with cryopools observed in the field (, , , ). The model tended to overestimate the average circularity, roundness, and aspect ratios of cryoconite holes because the straight edges of the square pixels impose a circularity limit on the simulated cryoconite holes. It should also be noted that both ice-surface heterogeneities and near-surface hydrology were not accounted for in this model.
Table 3. Mean, standard deviation, maximum, and minimum values for shape descriptors for modeled and real cryoconite holes in flat and north-sloping ice
Discussion
Our results indicate that surface slope and aspect influence cryoconite hole shape, and that this in turn influences cryoconite biogeochemistry. We suggest that topographically controlled spatial patterns of irradiance cause hole floors to slope, promoting the formation of thick layers of granules against downslope walls driving hole migration away from shade toward more evenly illuminated areas of ice surfaces (). This is a mechanism of equilibration toward symmetrical shapes and net autotrophic carbon regimes. However, we also show that ice-surface evolution and hydrologic disturbance appear to frequently disrupt this equilibration process and create zones of thickly stacked, net heterotrophic cryoconite.
Topographic controls on hole shape and position
Cryoconite holes on north-sloping ice receive less sunlight than those on south-sloping and flat ice, because in the northern hemisphere north-facing slopes are shaded by topographic rises for longer each day, with greater effect at higher latitudes. Shading by topography effectively reduces the range of solar angles at which cryoconite on the hole floor becomes illuminated. More sunlight per day is incident on northerly parts of the hole floor than on southerly parts because their greater horizontal distance from the apex of the topographic shade means they are illuminated at a wider range of solar zenith angles. This heterogeneous irradiance results in uneven melting and, consequently, sloping of hole floors. Gravity then causes cryoconite granules to move downslope and bank against the downslope wall. Such processes have at least two important consequences. Initially, granules overlap to form thicker layers, which results in a shift of the net ecosystem productivity in the hole toward net heterotrophy. Second, the thick layers of cryoconite promote lateral melting of the downslope wall (Cook et al. Citation2010, Citation2016a). This in turn creates complex and irregular hole morphologies and provides a mechanism of migration away from topographic shading. McIntyre (Citation1984) also noticed that some cryoconite holes on a Canadian glacier were D-shaped, with both the apex of the curved wall facing north and north-sloping hole floors. He recreated this morphology by shading holes from the south. These processes may be further enhanced by the formation of ice lids. Interestingly, these were observed more frequently in cryoconite holes on north-sloping ice, where they persisted for longer periods each day and tended to ablate from the northern edge. The likely reason south-sloping ice had smaller, more circular cryoconite holes is that direct illumination of hole floors is more prolonged across a wider range of solar zenith angles, meaning solar energy receipt at the hole floors is more homogeneous. A schematic of this migratory process is provided in .
The development of irregular cryoconite hole shapes as a result of topographically induced nonuniformity in hole-floor irradiance was demonstrated by our overload experiments (). Following the addition of cryoconite granules, holes on south-facing and flat ice expanded symmetrically where there was no hydrological disturbance, whereas on north-sloping ice holes preferentially expanded northward. This resulted in more irregularly shaped holes, as confirmed by image analysis. Importantly, cryoconite holes were frequently observed (during both 2014 and 2015 field seasons) that were not artificially disturbed in any way, but still showed strong morphological evidence of downslope redistribution of cryoconite within holes and migration of cryoconite holes away from shade (), indicating that these processes are not limited to artificially overloaded holes. By applying the same analyses to 2,344 cryoconite holes in our drone imagery, we show that the development of more irregular morphology on north-sloping ice is not limited to artificially overloaded holes. Furthermore, we developed a cellular automaton governed by a sediment transfer rule (overlapping grains move downslope one cell per timestep). This represents a deliberate reduction of cryoconite hole morphodynamics to the simplest possible mechanisms, and indicates emergent complexity arising from interactions between holes that produced similar shapes to those observed in UAV imagery. This suggests that simple sediment transfer processes can explain the irregular shapes of cryoconite holes on north-sloping ice and that these phenomena are probably not site specific.
Not only did the hole walls expand northward, but there was a concomitant shift in cryoconite granules. This supports our proposed mechanism of hole migration. The displacement measured was modest, but we note that the slope gradient was relatively gentle and observations across a longer period or on steeper slopes may illustrate migration over larger distances. Furthermore, with more extreme shading by wind sails at the 2014 field site the rates and magnitudes of hole migration were greater. “Tracks” of dirty ice, stranded cryoconite granules (both intact and disaggregated), and relict portions of cryoconite hole walls were commonly observed on north slopes, beginning mid-slope and ending in cryopools on lower gradient ice (), providing cryomorphological evidence of cryoconite migration downslope. Due to the rapid melt and deformation processes operating close to the margin, our field site is not broadly representative of ice-surface topography elsewhere on the ice sheet; however, the same processes of migration away from “wind sail” features and sediment thickness-controlled carbon cycling (Cook et al. Citation2016a) at a site 35 km further inland indicates that this is common wherever hole-floor illumination is strongly heterogeneous. We acknowledge that our study does not characterize the behavior of cryoconite on east- or west-sloping ice, which could be examined in future work.
Hole coalescence and cryopool formation
Cryoconite holes on north-sloping ice were larger than those in other topographic settings. We suggest that this is because of more frequent hole coalescence () as a result of migration, which also exacerbates hole asymmetry and naturally overloads holes with cryoconite. McIntyre (Citation1984) also identified hole coalescence as an explanation for irregular shapes. Our cellular automaton showed holes coalescing as they migrated downslope, forming irregular shapes and creating patches of overlapping cryoconite granules. On plateaus and at the base of north slopes very large features with areas greater than 200 cm2 were regularly identified. These were arcuate features with the apex of their convex wall oriented northward (, ) and we refer to these as cryopools. Cryopools comprised only 0.65 percent of the holes on north slopes, but accounted for 26 percent of the total areal coverage by cryoconite and are therefore important cryoconite features. Within these cryopools, extremely uneven sediment distributions were observed, ranging from single grain layers at the upslope edges to thicknesses of up to 10 mm nearer to the northern wall (). This is likely indicative of frequent sediment inputs into these pools and the continued downslope migration of granules.
We suggest that our proposed mechanism of sediment-driven shape evolution and migration for cryoconite holes also explains the development of cryopools. On flatter ice the drivers of hole migration weaken and cryoconite creeps more slowly, allowing rapidly migrating cryoconite to catch up and coalesce with cryoconite on lower gradient ice. This creates large cryoconite features that act as attractors for granules migrating downslope. However, there remains some heterogeneity in hole-floor irradiance so overlapping of granules and lateral melting continues at the northern wall. We directly observed several small cryoconite holes migrating into cryopools. As their downslope wall ablated, sediment was dumped into the cryopool. Relict holes and cryoconite “smudges” were often found immediately upslope of thick patches of overlapping cryoconite granules in southern areas of cryopool floors that were otherwise characterized by cryoconite distributed in single-grain layers (), providing additional morphological evidence for sediment dumping from migrating holes. Our cellular automaton also supports this. At the juncture between the sloping and flat ice, coalescence of cryoconite holes created features approximating the morphology of cryopools (). Although we find that random downslope movements of cryoconite can produce cryopool-like features in our cellular automata, we speculate that the microtopography and hydrology of the ice around real cryopools influences the local sediment dynamics. Real systems are therefore probably more deterministic than our simulation and there are also subtle hydrological influences, all of which likely contribute to the shape and size of cryopools.
Cellular automaton
Cellular automata have been used extensively to study the geomorphology of extraglacial landscape evolution (e.g., Smith Citation1991; Fondstat Citation2007; Ting, Zhou, and Cai Citation2009) as well as glacier flow mechanics (e.g., Barr and Rundle Citation1996). Using this approach in a biocryomorphic context (Cook et al. Citation2015a) allowed us to explore underlying drivers of ice-surface evolution and observe the behavior of the ice surface throughout much longer periods than was possible in the field, and under constant experimental conditions that could not possibly be achieved empirically. Despite the simplicity of the rules driving the model, we were able to simulate the development of hole shapes and sizes that approximated those observed in UAV imagery. This indicates that the evolution of cryoconite hole shape, size, and position can be explained by simple sediment-transfer rules. The largest, most irregularly shaped holes occurred after ten timesteps. Beyond ten timesteps, cryoconite holes gradually disbanded into smaller, more circular units with thinner sediment layers migrating downslope at decreasing speed. The model therefore suggests distinct periods of maturity, characterized by an early stage during which holes expand to spread thicker sediment layers, resulting in irregular shapes. This is followed by a prolonged period, characterized by holes with thin sediment layers dividing and migrating slowly. More mature ice surfaces are also characterized by larger cryopools at the slope base, because the longer time has allowed more coalescence. Our UAV images most closely resembled the simulation after ten timesteps, suggesting that the surface we were measuring was responding to a relatively recent sediment delivery or slope exaggeration event, which is unsurprising in this dynamic near-margin area on the southern west Greenland Ice Sheet.
Hydrological controls on hole shape
Cryoconite holes penetrate a porous “weathering crust” through which water flows down-glacier, providing hydrological connectivity between cryoconite holes and the wider glacier hydrologic regime (Cook, Hodson, and Irvine-Fynn Citation2016b; Irvine-Fynn and Edwards Citation2014). While we have not undertaken a focused hydrological study, our results do imply that hydrological connectivity might be important for cryoconite hole morphodynamics. In the overload experiments, holes that were particularly strongly influenced by water flow developed irregular shapes and were characterized by nonuniform sediment distributions, regardless of the ice-surface topography. This created irregularly shaped cryoconite holes in areas unaffected by topographic shading. Slope-driven hydrology has been previously suggested to impact cryoconite biogeochemistry (Stibal et al. 2012). However, while that article used surface slope as a proxy for water flow, we suggest that slope itself influences cryoconite carbon cycling independently of hydrological processes.
Implications for mass balance
Topography, slope, and aspect influence spatial patterns of melt on ice surfaces (e.g., Arnold et al. Citation2006). We have shown that this propagates through to the heterogeneous melting of cryoconite hole floors and the development of distinct hole shapes. Our results indicate that cryoconite holes continually alter their shapes and positions on the ice surface and must therefore contribute to surface ablation. In agreement with previous studies (e.g., Cook et al. Citation2010; Cook et al. Citation2016a), we propose the existence of an equilibrium state characterized by cylindrical, flat-floored holes at their equilibrium depth experiencing even illumination. Whether this state is attained is a function of external factors, such as shading by ice topography. While the equilibrium state represents the attractor the system evolves toward, not attaining this equilibrium state simply means that the hole remains in a state of constant motion, during which time it must contribute to surface ablation. Given the abundance of cryoconite holes on ice surfaces and their potential to migrate in response to continual relief inversion and exaggeration, their impact on surface mass balance should be quantified. There is a secondary, indirect impact arising from complex feedbacks between ice-surface sculpting by migrating holes, irradiance, and melt that merits further investigation.
Ecological significance
Our NEP data show contrasting carbon cycling between the topographic settings, with cryoconite on north slopes much more likely to exist in a state of net heterotrophy compared to south-sloping and flat ice. This can be explained by the greater sediment thicknesses and lower irradiance on north slopes, which have previously been identified as primary controls on net ecosystem productivity in cryoconite (Cook et al. Citation2016a, Citation2010; Telling et al. Citation2010, Citation2012). Our cellular automaton also lends credence to this explanation, since interactions between holes can lead to the formation of thick accumulations of granules, which are associated with net heterotrophy.
The great variation in NEP between upslope and downslope areas in cryopools implies that biogeochemical cycling probably varies within individual cryoconite holes where irradiance and sediment thicknesses are nonuniform, as is often the case on north-sloping ice. Upslope areas were characterized by thin sediment layers and, despite being the shadier areas of cryopool floor, were net autotrophic. At the downslope periphery, sediment layers were thick and, despite being more abundantly illuminated, were in a state of net heterotrophy. This indicates that for these systems, sediment-layer thickness is the dominant control of NEP, with spatial patterns of irradiance likely playing a secondary role. We therefore suggest that spatial variability in biogeochemistry exists not only across individual hole floors (as indicated by our measurements in cryopools and the well-known association between sediment thickness and NEP) but also across ice surfaces at the mesoscale, driven by nonuniform patterns of illumination and shade and uneven sediment distributions. These local scale physical drivers may explain why such large variations in NEP values have been reported in previous studies (see the summary in Cook et al. Citation2015b), including those in southern west Greenland (Stibal et al. 2012; Cook et al. Citation2010; Hodson, Cameron, and Bøggild et al. Citation2010).
We have identified a possible mechanism of migration for cryoconite away from shady north slopes where net heterotrophy is common toward more abundantly, evenly illuminated areas of ice surface associated with net autotrophy. We therefore suggest that this proposed mechanism of cryoconite migration could also be a mechanism of biogeochemical equilibration favoring carbon capture for swarms of cryoconite holes. However, landscape evolution and hydrological influences often disrupt this equilibration and create zones of net heterotrophy.
Conclusions
Cryoconite melts depressions into ice surfaces to form structures called cryoconite holes. These are often cylindrical and flat-floored, but can also exhibit diverse shapes in both plan view and profile. It has previously been shown that individual cryoconite holes can change their shape in response to changes in light intensity and sediment delivery (Cook et al. Citation2010, Citation2016a). In this article we showed that an extension of the same mechanism can enable cryoconite holes to migrate over ice surfaces when there is persistent nonuniformity in the illumination of the hole floor. This can arise as a result of topographic shading. Migration of cryoconite holes has biogeochemical implications, because the migration promotes movement away from shade and onto flatter, more evenly illuminated areas of ice that are associated with net autotrophy.
Acknowledgments
We would like to sincerely thank Jason Box, Marek Stibal, and Karen Cameron from the Dark Snow Project for sharing camp resources in the summer of 2014. Plots were produced using Matplotlib (Hunter Citation2007) and Python 3.4 (using packages in the Anaconda 2.3.0 distribution, Continuum Analytics).
Additional information
Funding
References
- Agassiz, L. 1846. Systeme Glaciere: Ou recherches sur les glaciers leur mécanisme, leur ancienne extension et le rôle qu’ils ont joué dans l’histoire de la terre. Paris: Victor Masson.
- Anesio, A. M., A. J. Hodson, A. Fritz, R. Psenner, and B. Sattler. 2009. High microbial activity on glaciers: Importance to the global carbon cycle. Global Change Biology 15 (4):955–60. doi:https://doi.org/10.1111/gcb.2009.15.issue-4.
- Arnold, N. S., W. G. Rees, B. J. Devereux, and G. S. Amable. 2006. Evaluating the potential of highresolution airborne lidar data in glaciology. International Journal of Remote Sensing 27:1233–51. doi:https://doi.org/10.1080/01431160500353817.
- Barr, D. B., and J. B. Rundle. 1996. Stick-slip statistical mechanics at the bed of a glacier. Geophysical Research Letters 23 (16):2073–76. doi:https://doi.org/10.1029/96GL02069.
- Bøggild, C. 1997. Different melt regimes indicated by surface albedo measurements at the Greenland ice sheet margin: Application of TM image. EARSeL. Advances in Remote Sensing 5:82–88.
- Burrough, P. A. 1986. Principles of geographical information systems for land resources assessement. Oxford: Clarendon.
- Chandler, D. M., J. D. Alcock, J. L. Wadham, S. L. Mackie, and J. Telling. 2015. Seasonal changes of ice surface characteristics and productivity in the ablation zine of the Greenland Ice Sheet. The Cryosphere 9:487–504. doi:https://doi.org/10.5194/tc-9-487-2015.
- Chandler, D. M., R. I. Waller, and W. G. Adam. 2005. Basal ice motion and deformation at the ice-sheet margin, West Greenland. Annals of Glaciology 42:67–70. doi:https://doi.org/10.3189/172756405781813113.
- Colgan, W., H. Rajaram, W. Abdalati, C. McCutchan, R. Mottram, M. S. Moussavi, and S. Grigsby. 2016. Glacier crevasses: Observations, models, and mass balance implications. Reviews of Geophysics 54 (1):119–161. doi:https://doi.org/10.1002/2015RG000504.
- Cook, J., A. Edwards, and A. Hubbard. 2015a. Biocryomorphology: Integrating Microbial Processes with Ice Surface Hydrology, Topography, and Roughness. Frontiers in Earth Science 3:78. doi: https://doi.org/10.3389/feart.2015.00078
- Cook, J. M., A. Edwards, N. Takeuchi, and T. D. I. Irvine-Fynn. 2015b. Cryoconite: The dark biological secret of the cryosphere. Progress in Physical Geography 40 (1):66–111. doi:https://doi.org/10.1177/0309133315616574.
- Cook, J. M., A. Edwards, M. Bulling, L. A. J. Mur, S. Cook, J. K. Gokul, K. A. Cameron, M. Sweet, and T. D. L. Irvine-Fynn. 2016a. Metabolome-mediated biocryomorphic evolution promotes carbon fixation in Greenlandic cryoconite holes. Environmental Microbiology 18:4674–86. doi:https://doi.org/10.1111/1462-2920.13349.
- Cook, J. M., A. J. Hodson, and T. D. L. Irvine-Fynn. 2016b. Supraglacial weathering crust dynamics inferred from cryoconite hole hydrology. Hydrological Processes 30:433–46. doi:https://doi.org/10.1002/hyp.10602.
- Cook, J. M., A. Hodson, J. Telling, A. Anesio, T. Irvine-Fynn, and C. Bellas. 2010. The mass-area relationship within cryoconite holes and its implications for primary production. Annals of Glaciology 51 (56):106–10. doi:https://doi.org/10.3189/172756411795932038.
- Edwards, A., A. M. Anesio, S. M. Rassner, B. Sattler, B. Hubbard, W. T. Perkins, M. Young, and G. Griffith. 2011. Possible interactions between bacterial diversity, microbial activity and supraglacial hydrology of cryoconite holes in Svalbard. ISME Journal 5 (1):150–60. doi:https://doi.org/10.1038/ismej.2010.100.
- Edwards, A., L. Mur, S. Girdwood, A. Anesio, M. Stibal, S. Rassner, K. Hell, J. Pachebat, B. Post, J. Bussell, et al. 2014. Coupled cryoconite ecosystem structure-function relationships are revealed by comparing bacterial communities in Alpine and Arctic glaciers. FEMS Microbial Ecology 89 (2):222–37. doi:https://doi.org/10.1111/1574-6941.12283.
- Fondstat, A. M. 2007. Cellular automata as analysis and synthesis engines and the geomorphology-ecology interface. Geomorphology 77:217–34. doi:https://doi.org/10.1016/j.geomorph.2006.01.006.
- Gribbon, P. W. 1979. Cryoconite holes on Sermikaysak, West Greenland. Journal of Glaciology 22:177–81. doi:https://doi.org/10.1017/S0022143000014167.
- Hodson, A., A. M. Anesio, M. Tranter, A. Fountain, M. Osborn, J. Priscu, J. Laybourn-Parry, and B. Sattler. 2008. Glacial ecosystems. Ecological Monographs 78 (1):41–67. doi:https://doi.org/10.1890/07-0187.1.
- Hodson, A., K. Cameron, C. Bøggild, et al. 2010. The structure, biogeochemistry and formation of cryoconite aggregates upon an Arctic valley glacier; Longyearbreen, Svalbard. Journal of Glaciology 56:349–62. doi:https://doi.org/10.3189/002214310791968403.
- Hood, E., J. Fellman, R. G. M. Spencer, P. J. Hernes, R. Edwards, D. D’Amore, and D. Scott. 2009. Glaciers as a source of ancient and labile organic matter to the marine environment. Nature 462:1044–47. doi:https://doi.org/10.1038/nature08580.
- Hubbard, A., Blatter, H., Nienow, P., Mair, D., and Hubbard, B. 1998. Comparison of a three-dimensional model for glacier flow with field data from Haut Glacier d’ Arolla, Switzerland. Journal of Glaciology 44 (147):368–378.
- Hunter, J. D. 2007. Matplotlib: A 2D graphics environment. Computing in Science and Engineering 9 (3):90–95. doi:https://doi.org/10.1109/MCSE.2007.55.
- Irvine-Fynn, T. D. I., and A. E. Edwards. 2014. A frozen asset: The potential of flow cytometry in constraining the glacial biome. Cytometry A 85 (1):3–7. doi:https://doi.org/10.1002/cyto.a.22411.
- Klinkenberg, B. 1994. A review of methods used to determine the fractal dimension of linear features. Mathematical Geology 26 (1):23–46. doi:https://doi.org/10.1007/BF02065874.
- Langford, H., A. Hodson, S. Banwart, and C. Bøggild. 2010. The microstructure and biogeochemistry of Arctic cryoconite granules. Annals of Glaciology 51 (56):87–94. doi:https://doi.org/10.3189/172756411795932083.
- McIntyre, N. F. 1984. Cryoconite hole thermodynamics. Canadian Journal of Earth Science 21:152–56. doi:https://doi.org/10.1139/e84-016.
- Nordenskjold, A. E. 1875. Cryoconite found 1870, July 19th-25th, on the inland ice, east of Auleitsivik Fjord, Disco Bay, Greenland. Geological Magazine Decade 2 (2):157–62.
- O’Neill, R. V., B. T. Milne, M. G. Turner, and R. H. Gardner. 1988. Resource utilization scales and landscape pattern. Landscape Ecology 2:63–69. doi:https://doi.org/10.1007/BF00138908.
- Philipp, H. 1912. Uber die beziehungen der kryokonitlocher zu den Schmelzschalen und ihren Einfluss auf die ablationsverhaltnisse arktische glatscher. Zeitschrift Der Geologischen Gesellschaft 64 (11):489–505.
- Shimada, R., N. Takeuchi, and T. Aoki. 2016. Inter-annual and geographical variations in the extent of bare ice and dark ice on the Greenland Ice Sheet derived from MODIS satellite images. Frontiers in Earth Science 4 (43). doi:https://doi.org/10.3389/feart.2016.00043.
- Smith, R. 1991. The application of cellular automata to the erosion of landforms. Earth Surface Processes and Landforms 16 (3):273–81. doi:https://doi.org/10.1002/esp.3290160307.
- Stibal, M., J. Telling, J. Cook, K. M. Mak, A. Hodson, and A. M. Anesio. 2012. Environmental controls on microbial abundance on the Greenland ice sheet: A multivariate analysis approach. Microbial Ecology 63:74–84. doi:https://doi.org/10.1007/s00248-011-9935-3.
- Takeuchi, N., H. Nishiyama, and Z. Li. 2010. Structure and formation process of cryoconite granules on Urumqi glacier No.1, Tien Shan, China. Annals of Glaciology 51 (56):9–14. doi:https://doi.org/10.3189/172756411795932010.
- Telling, J., A. M. Anesio, J. Hawkings, M. Tranter, J. L. Wadham, A. J. Hodson, T. D. L. Irvine-Fynn, and M. L. Yallop. 2010. Measuring rates of gross photosynthesis and net community production in cryoconite holes: A comparison of field methods. Annals of Glaciology 51 (56):153–62. doi:https://doi.org/10.3189/172756411795932056.
- Telling, J., A. M. Anesio, M. Tranter, M. Stibal, J. Hawkings, T. D. I. Irvine-Fynn, A. Hodson, C. Butler, M. Yallop, and J. Wadham. 2012. Controls on the autochthonous production and respiration of organic matter in cryoconite holes on high Arctic glaciers. Journal of Geophysical Research 117:G01017. doi:https://doi.org/10.1029/2011JG001828.
- Ting, M. A., C.-H. Zhou, and Q.-G. Cai. 2009. Modeling of hillslope runoff and soil erosion at rainfall events using cellular automata approach. Pedosphere 19 (6):711–18. doi:https://doi.org/10.1016/S1002-0160(09)60166-1.
- van de Wal, R. S., W. Boot, C. J. P. P. Smeets, H. Snellen, M. R. van den Broeke, and J. Oerlemans. 2012. Twenty-one years of mass balance observations along the K-transect, West Greenland. Earth System Science Data 4:31–35. doi:https://doi.org/10.5194/essd-4-31-2012.
- Wharton, R. A., C. P. McKay, G. M. Simmons, and B. C. Parker. 1985. Cryoconite holes on glaciers. BioScience 35:499–503. doi:https://doi.org/10.2307/1309818.