
 ?Mathematical formulae have been encoded as MathML and are displayed in this HTML version using MathJax in order to improve their display. Uncheck the box to turn MathJax off. This feature requires Javascript. Click on a formula to zoom.
ABSTRACT
Litter decomposition, a key process by which recently fixed carbon is lost from ecosystems, is a function of environmental conditions and plant community characteristics. In ice-rich peatlands, permafrost thaw introduces high variability in both abiotic and biotic factors, both of which may affect litter decomposition rates in different ways. Can the existing conceptual frameworks of litter decomposition and its controls be applied across a structurally heterogeneous thaw gradient? We investigated the variability in litter decomposition and its predictors at the Stordalen subarctic peatland in northern Sweden. We measured in situ decomposition of representative litter and environments using litter bags throughout two years. We found highly variable litter decomposition rates with turnover times ranging from five months to four years. Surface elevation was a strong correlate of litter decomposition across the landscape, likely as it integrates multiple environmental and plant community changes brought about by thaw. There was faster decomposition but also more mass remaining after two years in thawed areas relative to permafrost areas, suggesting faster initial loss of carbon but more storage into the slow-decomposing carbon pool. Our results highlight mechanisms and predictors of carbon cycle changes in ice-rich peatlands following permafrost thaw.
Introduction
Northern permafrost soils store about half (1,672 Pg) of the world’s soil carbon (C), and the loss of this stored C to the atmosphere, and the future C storage capacity of these soils, is uncertain in light of the warming north (Hugelius et al. Citation2014; Schuur et al. Citation2015). Increased C losses from recently thawed areas could be the result of either exposure and decomposition of previously frozen organic matter (Schuur et al. Citation2009) or changes in environmental conditions and shifts in plant community composition, which could affect decomposition of both old and newly fixed C (Johansson et al. Citation2006; Turetsky Citation2002, Citation2004). The discontinuous permafrost zone is where many of the actively thawing ecosystems exist. The C dynamics of ecosystems in this zone are important to understand, because their extent is shifting as the boundaries of permafrost zones move north (Oberman Citation2008; Thibault and Payette Citation2009). Actively thawing peatlands in the discontinuous permafrost zone are rich in C and are often the last remaining permafrost areas, because of the insulation caused by peat (Beilman, Vitt, and Halsey Citation2001; Halsey, Vitt, and Zoltai Citation1995; Hugelius et al. Citation2014). Ice-rich peatlands are especially dynamic systems with high spatiotemporal heterogeneity, making their C cycle and losses difficult to predict (Belshe et al. Citation2012; Lee et al. Citation2011; Malhotra and Roulet Citation2015). As the permafrost boundary moves north, altered environment and substrate after permafrost thaw will affect fresh litter decomposition dynamics. This initial decomposition dictates the amount of C transferred to the slow decomposing pool. Here, we investigate the variability and predictors of decomposition within the first two years of litter fall in a thawing ice-rich peat plateau in the discontinuous permafrost zone.
Peat plateaus are raised peatlands with a permanently frozen core. The upheaval of peat mounds is caused by ice lens that form in areas where the mean annual temperature is close to or less than 0°C and shallow snow cover is present (thus reducing the insulative effect of snow; Seppälä Citation1988). Spatial heterogeneity after the thaw of ice-rich permafrost peatlands can be attributed to localized hydrological feedbacks following initial thaw, which can rapidly degrade the surrounding permafrost (Schuur and Abbott Citation2011; Torre Jorgenson et al. Citation2013). The thawing of ice-rich peat layers leads to a drop in surface elevation and a shallower water table, as well as to changes in water redistribution, increasing moisture availability and the degree of anoxia (Quinton, Hayashi, and Chasmer Citation2009; Smith et al. Citation2012). The altered energy balance from the loss of the frost table, as well as the changed hydrologic regime, affects temperature and, subsequently, enzymatic processes involved in the C cycle; for example, organic matter breakdown (e.g., Mackelprang et al. Citation2011; Osterkamp et al. Citation2009). Changes in surface water chemistry also occur, affecting acidity, nutrient availability and dissolved organic carbon (DOC) concentrations, quality, and export (e.g., Keuper et al. Citation2012; Olefeldt and Roulet Citation2012). All of these environmental changes feed back to plant and microbial community structure and characteristics, which in turn affect decomposition rates across the peat profile (Beilman Citation2001; Camill et al. Citation2001; Mackelprang et al. Citation2011).
Primary controls on litter decomposition include litter quality and environmental variables, such as temperature, moisture, and pH that regulate microbial activity (Cleveland et al. Citation2014; Conant et al. Citation2011; Ward et al. Citation2015). In thawing systems, these controls are spatially heterogeneous and often occur in hitherto unknown combinations. It remains unclear how net litter decomposition changes after thaw. Furthermore, because of the heterogeneity in environmental conditions and plant community (litter quality), isolating site-level predictors of decomposition may be difficult. We used the litter-bag approach to determine the best predictors of fresh litter decomposition across a spatially heterogeneous ice-rich subarctic peatland where permafrost is thawing. We focus on the decomposition of fresh litter. Carbon remaining after decomposition is transported into the anoxic peat layer, eventually forming long-term C storage. Understanding changes in fresh litter decomposition after thaw will therefore inform the new trajectory of C storage in ice-rich permafrost peatlands.
Methods
Study site and experimental design
The Stordalen Mire is a subarctic peatland near Abisko, Sweden (68°22ʹ N, 19°03ʹ E). Mean annual precipitation from 1980 to 2009 was 335 mm, 40 percent of which fell as snow between September and June (climate data from Abisko Scientific Research Station). The long-term mean annual temperature of the region is −0.7°C (1912–2003 climate normal from Abisko Scientific Research station) but is recorded to have exceeded 0°C by 1994 (Callaghan et al. Citation2010). The permafrost at Stordalen is thawing, and this thaw is associated with a marked shift from drier to wetter plant communities (Johansson et al. Citation2006; Kvillner and Sonesson Citation1980). Dry communities on the peat plateau (intact permafrost) are primarily composed of Empetrum hermaphroditum, Betula nana, Rubus chamaemorus, Eriophorum vaginatum, Dicranum elongatum, and Sphagnum fuscum. Wetter areas where permafrost has thawed have species such as E. vaginatum, E. angustifolium, Carex rotundata, Carex rostrata, Salix lapponum, Sphagnum balticum, Sphagnum lindbergii, and Sphagnum riparium.
We set up twenty-seven plots of 1 × 1 m2 in three different parts of the peatland. Plots had varying apparent degrees of thaw, as suggested by growing-season frost table dynamics, vegetation, and hydrology. Three boardwalk transects of 20 m length and nine plots each were set up for ease of sampling and to minimize disturbance to the plots. Each transect spanned the main stages of thaw that are generally recognized in permafrost studies: intact permafrost, intermediate thaw, and fully thawed (e.g., Bäckstrand et al. Citation2010; Chasmer et al. Citation2012; Turetsky Citation2004). The three transects also captured several transitional stages between the thaw classes. At each of the twenty-seven plots, we conducted measurements of litter decomposition, water table depth, thaw depth, soil temperature, and plant community characteristics. We also measured pH, C, and N in the surface water at each plot.
Litter decomposition measurements
The litter-bag method was used to estimate mass loss of fresh litter in the different habitats along each transect (uses and limitations of the litter-bag method are discussed in Wieder and Lang [Citation1982] and Moore and Basiliko [Citation2006]). Litter bags were made with polypropylene 1 × 1-mm mesh fabric, and were 10 × 10 cm. Triplicates were used for each sampling plot and time (3 replicates × 3 time points × 27 plots), resulting in a total of 243 litter bags that were placed within the top 5 cm of the peat surface and near a dip-well in each plot on August 27, 2011. The content of the litter bags was determined based on a vegetation survey conducted in August 2011 to record the two dominant (based on percent cover) vascular species around each dip-well, because the goal was to obtain decomposition rates for each plot with the in situ species and environmental conditions. Therefore, some plots were in areas of high water table depth, while others were in areas with no observed water table (ranges of environmental conditions described in ). Each litter bag contained a total of 2 g (biomass dried at 60°C for two days) of green nondamaged leaves, comprising either one or two of the dominant species collected within 2–5 m of each plot. Collections were made in August 2011. Green leaves were used rather than dead leaves to avoid having tissue at various stages of decomposition. However, green leaves are likely more nutrient rich than dead leaves and may result in slightly overestimating decomposition rates, but consistently so, across the thaw gradient. Long graminoid leaves were cut into 10 cm segments to facilitate weighing and placing into litter bags. Fourteen of the sampled plots (and thus the corresponding litter bags) contained two dominant species, while the remaining thirteen had only one dominant species. The litter bags with two species had either a 1:1 or 3:1 ratio of dry biomass per species, and this was based on percent cover ratios from the coarse vegetation survey. One or two of the following species were present in the twenty-seven litter bags: E. vaginatum, E. angustifolium, C. rostrata, B. nana, R. chamaemorous, and S. lapponum. Understory species (typically D. elongatum or Sphagnum spp.), although present in the plots, were not used in the litter bags given their slow rates of decomposition (Lang et al. Citation2009; Rydin and Jeglum Citation2006) and the short duration of this study. On removal, bags were dried at 60°C for two days, and the litter was sorted by species and weighed. A coarse relative difference in gravimetric moisture content across the twenty-seven plots was also estimated using the before- and after-drying weights of litter in the litter bags.
Table 1. Mean and range of environmental factors across the twenty-seven sampled plots (representing site heterogeneity)
One triplicate of litter bags was removed on June 1, 2012, to capture mass loss that was the result of winter and spring leaching (Moore and Basiliko Citation2006). The second and third triplicates were removed on August 2, 2012 and 2013, respectively, to capture the mass loss during the growing season and a subsequent year. We used the fraction of original mass lost at each sampling time to generate mass loss rates (k per month) for each of the twenty-seven plots with the following exponential decay model (Wieder and Lang Citation1982):
Where y is the fraction of original dry mass remaining at time x (months), and a is the asymptote of the decay curve. A three-parameter model with an asymptote was selected over a simple two-parameter model to better describe the much slower decomposition rates in the last year, relative to the initial year where mass loss is high from leaching.
Predictors of decomposition rates were divided into environmental (physical, chemical, and biological) and litter quality (amount per species in litter bag).
Environmental predictors: Physical and chemical
At every 2 m on each transect, 1.5-m PVC wells (3 cm internal diameter) were inserted 1 m into the peat, for a total of twenty-seven dip wells. Water table depths (WTD) were measured weekly during the 2012 and 2013 growing seasons (end of May to August). Seasonally fluctuating thaw depth (depth to the frost table from the peat surface) was also measured using a steel rod at the same time as WTD measurements, at a distance of 20 cm from the dip well. For each of the twenty-seven plots, we estimated the average number of weeks per year without a frost table (within 1 m of the surface) from the weekly thaw depth data taken during two growing seasons. Weekly measurements spanned 12 weeks during the peak growing season (June–August). This metric of number of weeks per growing season without a frost table, hereafter thaw status, is a proxy for degree of thaw and provides a more accurate representation of thaw status than mean growing season thaw depth (because mean thaw depth does not take into account periods of no frost table in some areas later in the growing season). Plots that had a frost table throughout the entire measurement period were considered to have intact permafrost.
In 2012, mean elevation of the peat surface, relative to sea level, was recorded using a Real Time Kinematic (RTK)-GPS (TOPCON GRS-1 RTK GPS with a PG-A1 antenna; Andreas Persson, personal communication) at each of the twenty-seven dip wells to get a measure of relative elevation differences. The accuracy of the GPS ranged from 0.009 m to 0.017 m in x-y and from 0.005 m to 0.014 m in z. Surface water pH and conductivity were sampled weekly at each dip well during the 2012 and 2013 growing seasons using the Oakton® portable pH/con 10 field meter. To get a relative measure of available C and N, total nitrogen (TN) and dissolved organic carbon measured as non-purgeable organic carbon (TC) were also quantified for surface water from each well on three days in July and August of the 2013 growing season. These measurements were used to obtain the carbon to nitrogen ratio in the surface water (C:N), which is a proxy for N limitation for the ecosystem. Samples for TC and TN were collected from the surface of the water table outside the dip wells. After field collections, water samples were filtered within twenty-four hours with Whatman® Glass Fiber Filters (0.45 µm pore size) and refrigerated. Subsequently, water samples were shipped to McGill University, Canada, for laboratory analyses using a Shimadzu® TOC/V series Analyzer.
Environmental predictors: Biological
Plant community structure is a long-term integrator of environmental (physical and chemical) conditions and provides another measure of environmental changes after thaw. To supplement the vegetation survey in 2011 and to provide a detailed description of plant community structure in our plots, we conducted an additional vegetation survey in 2012. Plant species composition surrounding each well was determined using a 1 × 1 m quadrat with twenty-five grid points to record the number of hits of each species at each point, following the point-intercept method (Goodall Citation1952). Surveys were conducted in mid-August 2012 to capture the peak aboveground biomass. A supplementary survey in late June 2013 accounted for species such as R. chamaemorus that senesce by August. For each quadrat, the tallest height of each vascular species was also recorded. This provided a proxy of the biomass of each species, because destructive sampling was not possible.
We used four descriptors of plant community composition in our analyses of vegetation data: abundance, richness, evenness, and biomass. Richness (number of species) and evenness were obtained from species-level aggregation of the data; abundance (number of hits per species per m2) and biomass proxies (height as a proxy for biomass; details follow) were calculated from data pooled into graminoid, non-graminoid vascular, brown moss and Sphagnum species (hereafter, plant groups). Evenness was calculated using the following formula (Smith and Wilson Citation1996):
Where S is the number of species in the quadrat, and and
are the abundance of the sth and tth species, respectively.
We verified the relationship between vegetation height (our biomass proxy) and total green area (by species) because destructive sampling of biomass was not possible. In twenty-seven subplots, separate from the litter-bag study but covering a similar range of plant communities, we estimated vegetation green area (VGA; Wilson et al. Citation2006) four times over one growing season by counting the total number of green leaves and leaf length and width in a subset of leaves. We estimated green area with species-specific formulae based on leaf shape, as in Wilson et al. (Citation2006). VGA and height of the tallest individual were then confirmed to be significantly related (simple linear regression for pooled data, R2 = 0.77, p < 0.0001).
Data analyses
Physical and chemical variables that were sampled multiple times during the two growing seasons were averaged to one value (representing a growing-season average). A principal components analysis was used to explore relationships among environmental variables. Bivariate relationships of decomposition parameters (k and a) with environmental variables (physical, chemical, and biological variables described previously) or litter quality variables (dry mass per species in litter bag) were explored using Spearman’s rank correlation coefficient due to non-parametric data (checked using the Shapiro-Wilk test). All analyses were conducted in JMP® version 11.2.0 (SAS Institute Inc., Cary, NC, 1989–2007).
Results
Site heterogeneity
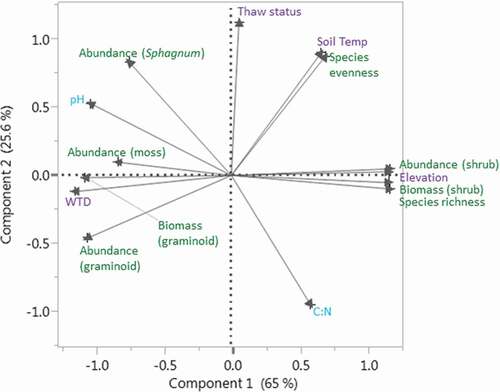
The twenty-seven plots where we measured litter decomposition were variable in surface elevation and environmental conditions, such as moisture, frost table and water table fluctuations, soil temperature, surface water pH, and C:N (), and several biological, physical, and chemical environmental variables were related to each other as suggested by the principal components analysis (; ) Thaw status (number of weeks without a frost table per growing season) of our plots ranged from 0 (intact permafrost) to 9 (completely thawed permafrost) and was not as closely related to other environmental variables relative to plant community or physical characteristics. The clusters of correlations among variables were centered around plant community descriptors, water table depth, and elevation ().
Figure 1. Relationships among measured environmental variables (physical in purple, biological in green, and chemical in blue) across all plots, shown with a principal components analysis (PCA). Axes close to each other are closely related. For example, the PCA suggests that Sphagnum abundance is strongly negatively related to C:N and weakly positively related to thaw status
Variability in mass loss rates
During the first winter and spring, there was a 19 percent loss of litter mass on average, which represents almost 60 percent of the total mass lost during the study period. By the end of the first growing season, there was, on average, a 24 percent mass loss from the litter bags, which increased to 33 percent by the end of the second growing season (percentages calculated relative to month zero). Rate of mass loss (k mo−1) averaged 0.07 mo−1 across plots and ranged from 0.02 to 0.21 mo−1, representing a range of turnover time (1/k) from five months to four years (). The mass loss curve asymptote (a, representing fraction of mass loss before a plateau in decomposition rates) averaged 0.5 and ranged from 0.07 to 0.77.
Best predictors of decomposition
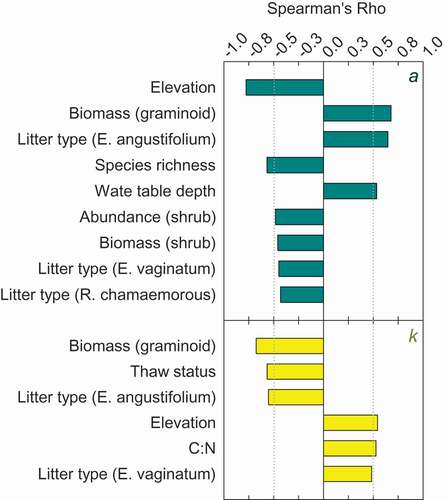
Parameters (decay constant k and asymptote a) were correlated to physical, chemical, and biological environmental factors as well as litter type (). The strongest correlates were variables that integrate long-term environmental conditions, such as species biomass or abundance. Graminoid biomass was positively correlated to k and negatively to a. Thaw status and pore water C:N were correlated with k but not with a. Conversely, water table depth and shrub abundance and biomass were correlated with a but not k. Elevation was a strong correlate of both k and a. As expected, litter type was also a recurring correlate of both parameters, especially the quantity of Eriophorum angustifolium or E. vaginatum in litter bags.
Figure 2. Significant (p < 0.05) predictors of decay rates (k) and decay curve asymptote (a) across the site. Correlation magnitude and directions are show along with various environmental (physical, chemical, and biological) variables and a or k.
Thaw and decomposition dynamics
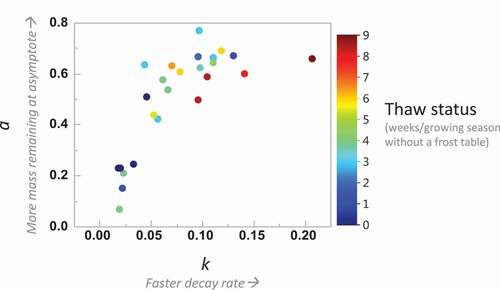
Thawed plots had higher a and k than unthawed plots (), although there is great variability in the transitional thaw stages. The relationship between a and k had two clusters that roughly represent permafrost or thawed areas ().
Figure 3. Relationship between decay rates (k) and decay curve asymptote (a) across the various thaw stages suggesting high variability across thaw stages and, in general, faster decay and more mass remaining at asymptote in more thawed plots
Discussion
Both environmental variables and litter type correlated with rates of decomposition and the decay curve asymptote as expected. The strongest predictors of decay curve parameters were those that integrate long-term environmental conditions, such as plant community characteristics and surface elevation. Thawed plots decompose faster than unthawed ones but also have a higher fraction of mass remaining after the initial fresh litter loss and potentially into a longer-term storage pool.
Our results corroborated that water availability has a strong positive effect on post-thaw decomposition (Hicks Pries et al. Citation2013). However, our results did not corroborate the expectation that soil temperature is a stronger predictor of litter decomposition than thaw status, as temperature directly affects microbial processes and thus decomposition (Davidson and Janssens Citation2006; Meentemeyer Citation1978; Moore et al. Citation1999; Trofymow et al. Citation2002). This result could either be because the thaw status and soil temperatures are decoupled in some of the transitional plots, or because thaw status is a better integrator of both the moisture and temperature effects on litter decomposition. The narrower range of soil temperature relative to thaw status or water table depth could also result in a weaker correlation of the former with decomposition. The relationship between temperature and litter decomposition also depends on litter quality (Fierer et al. Citation2005), and the lack of relationship between temperature and litter decomposition in our results could also be because of the heterogeneity in decomposability across our plots. In general, graminoid litter is more labile than shrub litter (Moore and Basiliko Citation2006; Moore, Bubier, and Bledzki Citation2007) and we had different fractions of these plant groups in our litter bags and across our thaw stages.
Differences among permafrost and thawed plots
Similar to other studies, we also observed that sites undergoing permafrost thaw exhibit faster decomposition rates than those with intact permafrost (; Turetsky Citation2004; Hicks Pries et al. Citation2013). We also observe that more thawed areas have larger a (more mass remaining at the end of the sampling period) and k (faster decomposition), relative to unthawed areas (). To provide averages for permafrost and various stages of thawed plots we pooled data from plots that are ecohydrologically characterized as palsa (permafrost, as per the hummock category in Johansson et al. Citation2006) and all other plots (thawed) and ran the 3P model as for pooled data points rather than for each plot as in the main analysis (). Decay curves reach an asymptote at 60 percent mass remaining in the thawed plots and at 40 percent in the intact permafrost plots. Faster initial decomposition from thawed areas could be because of more nutrient-rich litter (Keuper et al. Citation2012) followed by more mass remaining at asymptote due to burial under anoxic conditions (Camill et al. Citation2001). Naturally, a longer study is required to better estimate an asymptote and fully evaluate the differences in a among intact and thawed permafrost, and our a values may be underestimates. Nevertheless, our study provides valuable insight into short-term litter decomposition (in the first two years) differences among thawed and unthawed areas. This short-term litter decomposition represents 30 percent of the mass as per our study and the remaining litter then enters the longer-term C storage pool. Our results inform the uncertainty associated with abrupt thaw dynamics by describing the variance in a and k in the permafrost and various thawed plots ( and ) and characterizing the overall difference among thawed and unthawed plot decomposition trajectory (). Thus, thawed areas that typically have larger biomass than in permafrost areas also have faster initial decomposition rates followed by larger remaining litter that can potentially enter the long-term C storage pool. Both the increased C losses within the short term and the potential for more C storage in the long term are important to consider with the permafrost boundary shifting north in the warming north.
Figure 4. Model estimates (and associated standard errors in parentheses) from pooling data into intact permafrost (number of plots = 10) and thawed plots (number of plots = 17). Mass loss on the y axis is fraction remaining since month zero; k is the decay constant and a is the asymptote of the curve
Landscape scale integrator
Given the structural and functional spatial heterogeneity in ice-rich peatlands in the discontinuous permafrost zone, it is useful to present a landscape scale predictor of litter decomposition (Belshe et al. Citation2012; Lee et al. Citation2011). We use our results to propose variables that could aid in predicting litter decomposition in landscapes similar to Stordalen mire. The heterogeneity in thaw dynamics and hydrology across our plots produced a range of hydrologic, thermal, and nutrient regimes and associated plant communities ( and ). The confounding effects of these varying structural conditions on litter decomposition likely resulted in weaker observed relationships among litter decomposition and its controls relative to long-term environmental integrators, such as vegetation attributes or surface elevation. Relative surface elevation variability within a site could be useful to model carbon dynamics as it integrates the multiple effects of permafrost thaw on the ecosystem (Lee et al. Citation2011; Malhotra and Roulet Citation2015). Elevation is a function of thaw status in these ice-rich systems because of the ground subsidence that occurs after thaw (Quinton, Hayashi, and Chasmer Citation2009; Schuur and Abbott Citation2011). In non-permafrost peatlands, microtopography, water table, and plant composition are generally closely related (Malhotra et al. Citation2016). Microtopographic variability is a result of different processes in our site, relative to non-permafrost peatlands, but is still closely related to moisture, plant composition, and other variables that correlate with organic-matter decomposition (Spearman’s correlations shown in ). As a result, in our thaw gradient, elevation is a strong correlate of litter decomposition and is proposed as an ideal aggregate variable.
Table 2. Correlations (p < 0.0001, n = 27) of elevation with environmental variables and plant community characteristics
Conclusions
As permafrost thaws, the changes in soil temperature, moisture, and nutrient status produce shifts in the plant communities and associated litter decomposition rates. We presented the rates of mass loss of fresh litter in a thawing ice-rich permafrost peatland in the discontinuous permafrost zone. Decomposition rates varied considerably across the thaw gradient. Generally, rates of litter mass loss increased from permafrost to thawed areas, as did the fraction of mass remaining after two years of decomposition, suggesting increased C storage (or transfer into slow-decomposing C pools) after thaw. The best predictor of litter decomposition was relative surface elevation: a likely integrator of several controls on organic-matter breakdown. Given the relative ease with which elevation can be measured remotely, we recommend it as a predictor for landscape level scaling-up of litter decomposition.
The discontinuous permafrost zone is gradually shifting north and this trend is expected to continue (Schuur et al. Citation2015). Consideration of fresh litter decomposition rates is important to constrain the uncertainty in C loss from these thawing ecosystems, because thaw will both increase the production of litter as well as decomposition rates because of higher temperatures and nutrient availability (Camill et al. Citation2001; Keuper et al. Citation2012; Turetsky Citation2004). Our study suggests faster initial decomposition after thaw as well as more storage into the longer-term C pool, and informs the estimation of the litter decomposition component of C loss from the heterogeneous landscapes of thawing, ice-rich peatlands.
Supplementary Materials
Download Zip (38.1 KB)Acknowledgments
We would like to thank Silvie Harder, Etienne Fluet-Chouinard, Christina Puzzolo, and Mike Dalva for their assistance in the lab and field, and Andreas Persson for elevation data. The research was supported by a James McGill Professorship Stipend, a Discovery Grant and a Strategic Project Grant from the National Sciences and Engineering Research Council of Canada to NTR. AM was supported by the Fonds de recherche du Québec – Nature et technologies and the Office of Biological and Environmental Research in the United States Department of Energy’s Office of Science.
Supplemental data
Supplemental data for this article can be accessed on the publisher’s website.
Additional information
Funding
Related Research Data
References
- Bäckstrand, K., P. M. Crill, M. Jackowicz-Korczyñski, M. Mastepanov, T. R. Christensen, and D. Bastviken. 2010. Annual carbon gas budget for a subarctic peatland, Northern Sweden. Biogeosciences 7:95–108. doi:https://doi.org/10.5194/bg-7-95-2010.
- Beilman, D. W. 2001. Plant community and diversity change due to localized permafrost dynamics in bogs of western Canada. Canadian Journal of Botany 79:983–93. doi:https://doi.org/10.1139/cjb-79-8-983.
- Beilman, D. W., D. H. Vitt, and L. A. Halsey. 2001. Localized permafrost peatlands in western Canada: Definition, distributions, and degradation. Arctic, Antarctic, and Alpine Research 33 (1):70–77. doi:https://doi.org/10.2307/1552279.
- Belshe, E. F., E. A. G. Schuur, B. M. Bolker, and R. Bracho. 2012. Incorporating spatial heterogeneity created by permafrost thaw into a landscape carbon estimate. Journal of Geophysical Research 117:G01026. doi:https://doi.org/10.1029/2011JG001836.
- Callaghan, T. V., F. Bergholm, T. R. Christensen, C. Jonasson, U. Kokfelt, and M. Johansson. 2010. A new climate era in the sub-Arctic: Accelerating climate changes and multiple impacts. Geophysical Research Letters 37:1–6. doi:https://doi.org/10.1029/2009GL042064.
- Camill, P., J. A. Lynch, J. S. Clark, J. B. Adams, and B. Jordan. 2001. Changes in biomass, aboveground net primary production, and peat accumulation following permafrost thaw in the boreal peatlands of Manitoba, Canada. Ecosystems 4:461–78. doi:https://doi.org/10.1007/s10021-001-0022-3.
- Chasmer, L., A. Kenward, W. Quinton, and R. Petrone. 2012. CO2 exchanges within zones of rapid conversion from permafrost plateau to bog and fen land cover types. Arctic, Antarctic, and Alpine Research 44:399–411. doi:https://doi.org/10.1657/1938-4246-44.4.399.
- Cleveland, C. C., S. C. Reed, A. B. Keller, D. R. Nemergut, S. P. O’Neill, R. Ostertag, and P. M. Vitousek. 2014. Litter quality versus soil microbial community controls over decomposition: A quantitative analysis. Oecologia 174:283–94. doi:https://doi.org/10.1007/s00442-013-2758-9.
- Conant, R. T., M. G. Ryan, G. I. Ågren, H. E. Birge, E. A. Davidson, P. E. Eliasson, S. E. Evans, S. D. Frey, et al. 2011. Temperature and soil organic matter decomposition rates: Synthesis of current knowledge and a way forward. Global Change Biology 17:3392–404. doi:https://doi.org/10.1111/j.1365-2486.2011.02496.x.
- Davidson, E. A., and I. A. Janssens. 2006. Temperature sensitivity of soil carbon decomposition and feedbacks to climate change. Nature 440:165–73. doi:https://doi.org/10.1038/nature04514.
- Fierer, N., J. Craine, K. McLauchlan, and J. Schimel. 2005. Litter quality and the temperature sensitivity of decomposition. Ecology 86:320–26. doi:https://doi.org/10.1890/04-1254.
- Goodall, D. W. 1952. Some considerations in the use of point quadrats for the analysis of vegetation. Australian Journal of Biological Sciences 5:1–41.
- Halsey, L. A., D. H. Vitt, and S. C. Zoltai. 1995. Disequilibrium response of permafrost in boreal continental western Canada to climate change. Climatic Change 30:57–73. doi:https://doi.org/10.1007/BF01093225.
- Hicks Pries, C. E., E. A. G. Schuur, J. G. Vogel, and S. M. Natali. 2013. Moisture drives surface decomposition in thawing tundra. Journal of Geophysical Research: Biogeosciences 118:1133–43. doi:https://doi.org/10.1002/jgrg.20089.
- Hugelius, G., J. Strauss, S. Zubrzycki, J. W. Harden, E. A. G. Schuur, C.-L. Ping, L. Schirrmeister, G. Grosse, G. J. Michaelson, C. D. Koven, et al. 2014. Estimated stocks of circumpolar permafrost carbon with quantified uncertainty ranges and identified data gaps. Biogeosciences 11:6573–93. doi:https://doi.org/10.5194/bg-11-6573-2014.
- Johansson, T., N. Malmer, P. M. Crill, T. Friborg, J. H. Åkerman, M. Mastepanov, and T. R. Christensen. 2006. Decadal vegetation changes in a northern peatland, greenhouse gas fluxes and net radiative forcing. Global Change Biology 12:2352–69. doi:https://doi.org/10.1111/j.1365-2486.2006.01267.x.
- Keuper, F., P. M. Bodegom, E. Dorrepaal, J. T. Weedon, J. Hal, R. S. P. Logtestijn, and R. Aerts. 2012. A frozen feast: Thawing permafrost increases plant-available nitrogen in subarctic peatlands. Global Change Biology 18:1998–2007. doi:https://doi.org/10.1111/j.1365-2486.2012.02663.x.
- Kvillner, E., and M. Sonesson. 1980. Plant distribution and environment of a subarctic mire. Ecological Bulletins 30:97–111.
- Lang, S. I., J. H. C. Cornelissen, T. Klahn, R. S. P. van Logtestijn, R. Broekman, W. Schweikert, and R. Aerts. 2009. An experimental comparison of chemical traits and litter decomposition rates in a diverse range of subarctic bryophyte, lichen and vascular plant species. Journal of Ecology 97:886–900. doi:https://doi.org/10.1111/j.1365-2745.2009.01538.x.
- Lee, H., E. A. G. Schuur, J. G. Vogel, M. Lavoie, D. Bhadra, and C. L. Staudhammer. 2011. A spatially explicit analysis to extrapolate carbon fluxes in upland tundra where permafrost is thawing. Global Change Biology 17:1379–93. doi:https://doi.org/10.1111/j.1365-2486.2010.02287.x.
- Mackelprang, R., M. P. Waldrop, K. M. DeAngelis, M. M. David, K. L. Chavarria, S. J. Blazewicz, E. M. Rubin, and J. K. Jansson. 2011. Metagenomic analysis of a permafrost microbial community reveals a rapid response to thaw. Nature 480:368–71. doi:https://doi.org/10.1038/nature10576.
- Malhotra, A., and N. T. Roulet. 2015. Environmental correlates of peatland carbon fluxes in a thawing landscape: Do transitional thaw stages matter? Biogeosciences 12:3119–30. doi:https://doi.org/10.5194/bg-12-3119-2015.
- Malhotra, A., N. T. Roulet, P. Wilson, X. Giroux-Bougard, and L. Harris. 2016. Ecohydrological feedbacks in peatlands: An empirical test of the relationship among vegetation, microtopography and water table. Ecohydrology 9:1346–57. doi:https://doi.org/10.1002/eco.1731.
- Meentemeyer, V. 1978. Macroclimate and lignin control of litter decomposition rates. Ecology 59:465–72. doi:https://doi.org/10.2307/1936576.
- Moore, T., J. Trofymow, B. Taylor, C. Prescott, C. Camire, L. Duschene, J. Fyles, L. Kozak, M. Kranabetter, I. Morrison, et al. 1999. Litter decomposition rates in Canadian forests. Global Change Biology 5:75–82. doi:https://doi.org/10.1046/j.1365-2486.1998.00224.x.
- Moore, T. R., and N. Basiliko. 2006. Decomposition in boreal peatlands. In Boreal peatlands, edited by R. K. Wieder and D. H. Vitt, 125–44. Berlin: Springer-Verlag.
- Moore, T. R., J. L. Bubier, and L. Bledzki. 2007. Litter decomposition in temperate peatland ecosystems: The effect of substrate and site. Ecosystems 10:949–63. doi:https://doi.org/10.1007/s10021-007-9064-5.
- Oberman, N. G. 2008. Contemporary permafrost degradation of northern European Russia. In Proceedings of the 9th International Conference on Permafrost, edited by D. L. Kane and K. M. Hinkel, vol. 2, 1305–10. Fairbanks, AK: Institute of Northern Engineering, University of Alaska Fairbanks.
- Olefeldt, D., and N. T. Roulet. 2012. Effects of permafrost and hydrology on the composition and transport of dissolved organic carbon in a subarctic peatland complex. Journal of Geophysical Research 117:G01005. doi:https://doi.org/10.1029/2011JG001819.
- Osterkamp, T. E., M. T. Jorgenson, E. A. G. Schuur, Y. L. Shur, M. Z. Kanevskiy, J. G. Vogel, and V. E. Tumskoy. 2009. Physical and ecological changes associated with warming permafrost and thermokarst in Interior Alaska. Permafrost and Periglacial Processes 20:235–56. doi:https://doi.org/10.1002/ppp.656.
- Quinton, W., M. Hayashi, and L. Chasmer. 2009. Peatland hydrology of discontinuous permafrost in the Northwest Territories: Overview and synthesis. Canadian Water Resources Journal 34:311–28. doi:https://doi.org/10.4296/cwrj3404311.
- Rydin, H., and J. K. Jeglum. 2006. The biology of peatlands. New York: Oxford University Press.
- Schuur, E. A. G., and B. Abbott. 2011. Climate change: High risk of permafrost thaw. Nature 480:32–33. doi:https://doi.org/10.1038/480032a.
- Schuur, E. A. G., A. D. McGuire, C. Schädel, G. Grosse, J. W. Harden, D. J. Hayes, G. Hugelius, C. D. Koven, P. Kuhry, D. M. Lawrence, et al. 2015. Climate change and the permafrost carbon feedback. Nature 520:171–79. doi:https://doi.org/10.1038/nature14338.
- Schuur, E. A. G., J. G. Vogel, K. G. Crummer, H. Lee, J. O. Sickman, and T. E. Osterkamp. 2009. The effect of permafrost thaw on old carbon release and net carbon exchange from tundra. Nature 459:556–59. doi:https://doi.org/10.1038/nature08031.
- Seppälä, M. 1988. Palsas and related forms. In Advances in periglacial geomorphology, edited by M. J. Clark, 247–78. Chichester: Wiley.
- Smith, B., and J. Wilson. 1996. A consumer’s guide to evenness indices. Oikos 76:70–82. doi:https://doi.org/10.2307/3545749.
- Smith, L. C., D. W. Beilman, K. V. Kremenetski, Y. Sheng, G. M. MacDonald, R. B. Lammers, A. I. Shiklomanov, and E. D. Lapshina. 2012. Influence of permafrost on water storage in West Siberian peatlands revealed from a new database of soil properties. Permafrost and Periglacial Processes 23:69–79. doi:https://doi.org/10.1002/ppp.735.
- Thibault, S., and S. Payette. 2009. Recent permafrost degradation in bogs of the James Bay area, northern Quebec, Canada. Permafrost and Periglacial Processes 20:383–89. doi:https://doi.org/10.1002/ppp.660.
- Torre Jorgenson, M., J. Harden, M. Kanevskiy, J. O’Donnell, K. Wickland, S. Ewing, K. Manies, Q. Zhuang, Y. Shur, R. Striegl, et al. 2013. Reorganization of vegetation, hydrology and soil carbon after permafrost degradation across heterogeneous boreal landscapes. Environmental Research Letters 8:035017. doi:https://doi.org/10.1088/1748-9326/8/3/035017.
- Trofymow, J., T. Moore, B. Titus, C. Prescott, I. Morrison, M. Siltanen, S. Smith, J. Fyles, et al. 2002. Rates of litter decomposition over 6 years in Canadian forests: Influence of litter quality and climate. Canadian Journal of Earth Sciences 804:789–804. doi:https://doi.org/10.1139/X01-117.
- Turetsky, M. R. 2002. Boreal peatland C fluxes under varying permafrost regimes. Soil Biology and Biochemistry 34:907–12. doi:https://doi.org/10.1016/S0038-0717(02)00022-6.
- Turetsky, M. R. 2004. Decomposition and organic matter quality in continental peatlands: The ghost of permafrost past. Ecosystems 7:740–50. doi:https://doi.org/10.1007/s10021-004-0247-z.
- Ward, S. E., K. H. Orwin, N. J. Ostle, M. J. I. Briones, B. C. Thomson, R. I. Griffiths, S. Oakley, H. Quirk, and R. D. Bardgett. 2015. Vegetation exerts a greater control on litter decomposition than climate warming in peatlands. Ecology 96:113–23. doi:https://doi.org/10.1890/14-0292.1.
- Wieder, R., and G. Lang. 1982. A critique of the analytical methods used in examining decomposition data obtained from litter bags. Ecology 63:1636–42. doi:https://doi.org/10.2307/1940104.
- Wilson, D., J. Alm, T. Riutta, J. Laine, K. A. Byrne, E. P. Farrell, and E.-S. Tuittila. 2006. A high resolution green area index for modelling the seasonal dynamics of CO2 exchange in peatland vascular plant communities. Plant Ecology 190:37–51. doi:https://doi.org/10.1007/s11258-006-9189-1.