
ABSTRACT
Replacement of phospholipids with phosphorus (P)-free lipids in cellular membranes has been identified as a mechanism facilitating fast rates of photosynthesis when phosphorus availability is limited. We measured photosynthetic rates, leaf and soil P fractions, and foliar membrane lipid compositions for five species (Geranium antrorsum, Ranunculus graniticola, Poa costiniana, Poa hiemata, and Veronica derwentiana) common to two Australian subalpine ecosystems of contrasting parent material to characterize the extent to which they have adapted to long-term P availability. Our results indicate limited tolerance to reduced P, albeit adaptation strategies differ among species. Under reduced P conditions, phospholipids were replaced in foliage by galactolipids and sulfolipids, but photosynthesis was still impaired owing to reduced stomatal conductance. Accumulation of antioxidants, including carotenoids and alpha-tocopherol, in leaves with limited P supply suggests oxidative stress. Our field study shows that while subalpine Australian plants of a variety of life forms adapt to P availability by replacing phospholipids with P-free lipids in foliar membranes, this adaptation is insufficient to fully mitigate the effects of reduced P on photosynthesis.
Introduction
Nutrient deficiencies in soils are among the main factors that limit global productivity, with nitrogen (N) and phosphorus (P) being especially critical (Fisher, Badgley, and Blyth Citation2012). Northern hemisphere soils are typically deficient in nitrogen (Vitousek and Howarth Citation1991), while many southern hemisphere and tropical soils have poor availability of phosphorus because of prolonged weathering, long-term tectonic stability, and lack of glaciation events (McKenzie et al. Citation2004). Nutrient availability in subalpine ecosystems is also limited by characteristically and strongly acidic soils (Dakora and Phillips Citation2002), while adverse environmental conditions, including drought, light stress, and extremes of temperature, reinforce limitations to growth (e.g., Wahren, Williams, and Papst Citation1999).
Nutrient availability is a key evolutionary driver of plant anatomy and the establishment of associations between plants and other organisms. Among the earliest adaptations to enhance nutrient acquisition was the formation of symbiotic relationships between plants and fungi (Brundrett Citation2002). Mycorrhizal associations, present in approximately 80 percent of land plants, are estimated to provide up to 80 percent of plant P and N (van der Heijden et al. Citation2015).
Assessing the impacts of nutrient availability on plant physiology requires knowledge of plant requirements and capacity for within-plant allocation of nutrients (e.g., to metabolism or to storage). Nucleic acids may account for 40–60 percent of organic P in some plant tissues, of which approximately 85 percent can be RNA (Veneklaas et al. Citation2012). RNA content can, in turn, vary with P supply (Reef et al. Citation2010). Other P-containing metabolites also play major roles in metabolism. For example, availability of free orthophosphate (Pi) within the cytosol (Raven Citation2013) is critical to photosynthesis, while ATP is essential to cellular energy transfer, both of which are reduced when there is limited P available (Plaxton and Tran Citation2011). Conversely, P stored in vacuoles is rapidly remobilized under conditions of P limitation to buffer fluctuations in cytosol Pi (Veneklaas et al. Citation2012).
Phospholipids are key parts of membranes and are among the most significant uses of P in plants, accounting for approximately 20 percent of foliar organic P (Veneklaas et al. Citation2012). Under P limitation, phospholipids can be replaced by P-free lipids (Essigmann et al. Citation1998), again releasing P for use in the cytosol (Tjellström et al. Citation2008). Replacement of phospholipids with glycolipids under limiting P supply was first reported in prokaryotes (Minnikin, Abdolrah, and Baddiley Citation1974), but is now a well-documented process in many higher plant species (Arabidopsis: Härtel, Dörmann, and Benning Citation2000; oat: Andersson et al. Citation2003; soy bean: Gaude et al. Citation2004; Proteaceae: Lambers et al. Citation2012). All plasma membranes, mitochondrial envelopes, and tonoplast and chloroplast membranes (Andersson et al. Citation2005; Härtel, Dörmann, and Benning Citation2001; Jouhet et al. Citation2004) show this plasticity, suggesting a general strategy that assists plant growth on soils of widely varying P availabilities. While galactolipids are commonly involved in the replacement of phospholipids, they are not the only possible substitute. Phospholipids can also be replaced by sulfolipids (Benning Citation1998; Lambers et al. Citation2012). Although many Australian soils are also characterized as having poor availability of sulfur (Williams and Steinbergs Citation1959), the “sulfur problem” is arguably not as acute as that of P.
The prevalence of old soils in Australia and many other regions suggests that many native plants are effectively oligotrophs. Morcuende et al. (Citation2007), for example, noted that P depletion causes repression of genes involved in the light reactions of photosynthesis, chlorophyll synthesis, the Calvin cycle, and photorespiration. Overall, the responses reflected programmed down-regulation of metabolism under P stress. Morcuende et al. (Citation2007) also observed up-regulation of genes involved in the synthesis of secondary metabolites, including the anthocyanins and phenylpropanoids characteristic of plant stress responses to high light. Some native Australian plants seemingly down-regulate photosynthetic capacity under P stress (Turnbull, Warren, and Adams Citation2007), with a side benefit of committing resources to photoprotective measures (for a review, see Hernández and Munné-Bosch Citation2015).
Soil type, and related parent material, have long been implicated in the distribution of native grasses and forbs in areas such as the Monaro and other high tablelands in Australia (Garden et al. 2001). Phosphorus status ranks highly among the properties that delineate soil types, and there are many clear examples of species preferences for either lower or higher P status. In this study we aimed to characterize the extent to which five plant species, from two subalpine Australian ecosystems of contrasting parent material, adapt to long-term P availability by modifying lipid biosynthesis—specifically replacing phospholipids with nonphospholipids—and regulating photosynthetic properties. Measurements of photosynthetic rate in situ were combined with laboratory analysis of soil properties, leaf P content, and leaf membrane lipids for five proximate native species: the herbs Geranium antrorsum and Ranunculus graniticola, the grasses Poa costiniana and Poa hiemata, and the sub-shrub Veronica derwentiana. We sought also to determine if functional types differed in effects of long-term P limitation, and thus in potential suitability to habitats of differences in P availability.
Materials and methods
Site descriptions
Our study sites were located within the Snowy Mountains in New South Wales (Snowy Plains, SP; 36°05ʹ36ʺ S, 148°31ʹ42ʺ E, ~200 ha) and the High Country in Victoria (Dargo High Plains, DHP; 36°07ʹ53ʺ S, 147°10ʹ07ʺ E, ~150 ha), two subalpine regions of matching climate () and vegetation (subalpine eucalypt grassy woodland). We studied five species common to both sites: two forbs G. antrorsum (Carolin) and R. graniticola (Melville), two grass species P. costiniana (Vickery) and P. hiemata (Vickery), and one sub-shrub V. derwentiana (Andrews). All five species can form endomychorrizal relationships (Berch, Gamiet, and Deom Citation1988; Javaid Citation2008), although the extent of mychorrization was not characterized in this study. The two sites differed in soil P availability () because of sedimentary parent material at SP and basaltic parent material at the DHP. Photosynthetic measurements were taken during March 2013, plant samples for membrane lipid analyses were taken in March 2014, and soil samples were collected in April 2014.
Table 1. Climate data for the Snowy Plains (SP) and Dargo High Plains (DHP) study sites. Data are means ±SE for 2007–2012. Temperature and rainfall data were collected from eddy covariance flux towers installed at each site. Radiation data were collected from nearby bureau of meteorology stations (SP = Cabramurra; DHP = Mount Hotham airport; www.bom.gov.au)
Table 2. Soil properties of the Snowy Plains (SP) and Dargo High Plains (DHP) sites. Values are means ±SE (n = 5). Asterisks indicate significantly different means between sites from an unpaired t test (*P < 0.05, **P < 0.01, ***P < 0.001)
Soil properties and plant P
The top 20 cm of soil (the organic layer and underlying mineral soil) was sampled at five randomly selected points at each site, using a soil core sampler (#403.27; AMS Inc., American Falls, ID, USA). Water-soluble inorganic phosphate was measured photometrically per Netzer et al. (2016): soil was oven dried at 60°C then sieved to 4 mm, and visible roots were removed. Four grams of sieved soil were added to 30 ml of water in a tube and shaken overnight at 4°C. The tubes were centrifuged and the supernatant was removed. Then, 150 µl supernatant was added to each well of a ninety-six-well plate, together with 17 µl staining reagent. The staining reagent was a mixture of 5 mM ammonium heptamolybdate, 0.2 mM potassium antimony (III) oxide tartrate hemihydrate, and 30 mM ascorbic acid in 1.25 M sulfuric acid. The plate was incubated at room temperature for 30 min, then absorbance at 700 nm was measured (TriStar2 LB 942; Berthold Technologies, Bad Wildbad, Germany) and the concentration of phosphate (mg P kg−1 dry soil) in samples was calculated from potassium phosphate standard curves (Murphy and Riley Citation1962).
Organic P was analyzed using a method of Dijkstra et al. (Citation2012) modified from Saunders and Williams (Citation1955). One gram of soil was ashed in a muffle furnace at 550°C for 2 h. Then, 50 ml of 0.5 M H2SO4 was added to the ashed soil in a tube; 1 g of unashed milled and oven-dried (60°C) soil was added to a separate tube, and 50 ml 0.5 M H2SO4 was added. Tubes were shaken for 16 h then centrifuged for 10 min at 5,000 g. The P content of each tube was determined colorimetrically, using the ammonium paramolybdate/stannous chloride reagent at 690 nm (UVmini-1240; Shimadzu Scientific Instruments, Sydney, NSW, Australia), in relation to KH2PO4 standards. Organic P was calculated as the difference in P content between ashed and nonashed samples.
Soil pH was analysed using a 1:5 soil-to-solution ratio in both 10 mM CaCl2 and water using a glass electrode (SevenMulti; Mettler-Toledo Ltd., Port Melbourne, Vic, Australia). Soil carbon and nitrogen concentrations were measured on 100 mg of dry soil, using a CHN analyser (Truspec CHN; Leco Australia, Castle Hill, NSW, Australia). Soil moisture-holding capacity was calculated by drying soil samples for 24 h at 60°C (Cassel and Nielsen Citation1986). A subsample of dried soil was weighed and saturated with water. This wet soil was then weighed and the percent of water per unit dry weight (DW) of soil was calculated. Soil dry-bulk density was calculated by drying soil cores of known volume for 24 h at 60°C and then weighing them (Blake and Hartge Citation1986).
Plant phosphorus was analyzed using a modified method of Lambers et al. (Citation2012), and 10 mg of dry powdered leaf material was digested in 2 ml 3:1 HNO3:HClO4 for ten days. A 100 µl aliquot of the acid digest was diluted to 1 ml with MQ water. Then, 500 µl was neutralized with 560 µl 1M KOH and centrifuged at 15,000 rpm for 10 min. Analysis of phosphorus content was then the same as that of soil using the photometric method of Murphy and Riley (Citation1962).
Photosynthesis
Photosynthetic properties were measured in situ under fully saturating natural insolation (>2,000 µmol photons m−2 s−1) using a recently calibrated infrared gas analyser (IRGA; LI-6400, Li-Cor Inc., Lincoln, NE, USA) fitted with the 2 × 3 cm clear leaf chamber at a CO2 concentration of 400 ppm and a flow rate of 350 µmol s−1. Because of the nature of gas-exchange measurements (using sunlight as a light source) it was not feasible to perform A/Ci or A/Q curves. A photograph was taken of each leaf within the IRGA chamber, using a digital camera (DSC-HX9V; Sony Corp., New York, NY, USA), for the calculation of leaf area.
Membrane lipids
Crude lipids were extracted and analyzed from powdered freeze-dried plant sample using liquid chromatography time-of-flight mass spectrometry as reported by Okazaki et al. (Citation2015).
For statistical analyses, lipids were grouped as follows: phospholipids (fourteen phosphatidylcholine [PC], two lysophosphatidylcholine [lyso-PC], nine phosphatidylethanolamine [PE], four phosphatidylglycerol [PG], and two phosphatidylinositol [PI] species); galactolipids (nine monogalactosyl diacylglycerol [MGDG] and eleven digalactosyl diacylglycerol [DGDG] species); sulfolipids (seven sulfoquinovosyl diacylglycerol [SQDG] species); glucosylceramides (six glucosylceramide [GlcCer] species); and glucuronosyldiacylglycerols (five glucuronosyldiacylglycerol [GlcADG] species). We also quantified eight diacylglycerol (DAG) and forty-two triacylglycerol (TAG) species, six chlorophylls, and two carotenoids.
Tocopherol
Alpha-tocopherol was analyzed from leaves as described by Kreuzwieser et al. (Citation2009). Briefly, 50 mg of homogenized frozen leaf powder was added to 500 μl ice-cold 85 percent (v/v) methanol containing 10 µl 100 mg μl−1 ribitol as an internal standard. Samples were continuously shaken and heated to 65°C and centrifuged thereafter; 50 μl of the supernatant was dried under vacuum. Dried extracts were derivatized with 20 μl 20 mg ml−1 methoxyamine hydrochloride in anhydrous pyridine; incubation occurred at 30°C for 90 min and shaken at 1,400 rpm. Thereafter, 50 μl N-methyl-N-(trimethylsilyl) trifluoroacetamide (MSTFA) was added, and samples were incubated at 37°C for 30 min. Samples were centrifuged and, after transfer into GC-MS vials, analyzed on an Agilent GC/EIMS system (GC 7890A coupled to a 5975C MSD, Agilent Technologies, Palo Alto, CA, USA). Injection of 1 µl aliquots into the system occurred with an autosampler (Gerstel MPS2-XL, Gerstel, Mülheim, Germany). Analytes were separated on a capillary column (HP-5MS 5%, Agilent Technologies, Palo Alto, CA, USA) with He as a carrier gas (flow: 1 ml min−1). The GC-MS run conditions described by Erxleben et al. (Citation2012) were applied. Raw data were processed with freely available AMDIS (automated mass spectral deconvolution and identification system, version 2.69; http://www.amdis.net/). For compound identification, we used the Golm Metabolome Database (Kopka et al. Citation2005). Relative quantification of tocopherol contents was obtained by normalizing peak areas for sample weight and internal ribitol standard and correction for blank values.
Statistical analyses
Photosynthetic results were analyzed statistically using a two-way analysis of variance (ANOVA) with post hoc Fisher’s least significant difference (LSD) test (Prism 6; Graphpad Software, La Jolla, CA, USA). Membrane lipid data were normalized by sum and scaled based on the mean and standard deviation, then the composition was analyzed using a partial least squares discriminant analysis (PLS-DA) with subsequent t tests to identify individual compounds of interest (Metaboanalyst 3.0; Xia et al. 2015). Total lipid concentration and specific compound groups were analyzed using a two-way ANOVA (Prism 6).
Results
Soil properties and plant phosphorus
As expected, soil phosphorus fractions varied between sites (). Water-soluble inorganic phosphate (Pi) was 50 percent greater at the DHP site (p < 0.05) while organic P was tenfold greater (p < 0.05) at SP. Total soil P did not differ between the two sites (p > 0.05). Carbon, nitrogen, and sulfur concentrations followed Pi, and were more than 50 percent greater at the DHP site (C, p < 0.001; N, p < 0.001; S, p < 0.01). Both C:N ratios and soil acidity were similar at both sites (p > 0.05). Dry bulk density was greater at SP (p < 0.001), while soil moisture holding capacity was greater at DHP (P < 0.01).
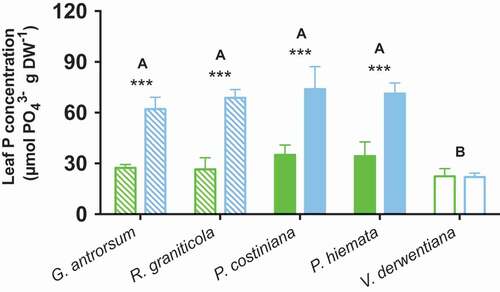
Leaf total phosphorus content was linked closely to soil Pi for herbaceous and grass species (G. antrorsum, p < 0.01; R. graniticola, p < 0.01; P. costiniana, p < 0.01; P. hiemata, p < 0.01), while the sub-shrub V. derwentiana showed little difference between sites (p > 0.05; ).
Figure 1. Leaf phosphorus concentrations for G. antrorsum, R. graniticola, P. costiniana, P. hiemata, and V. derwentiana. Green = SP (low P) site; blue = DHP (high P) site. Dashed bars are forbs, filled bars are grasses, and empty bars are sub-shrub species. Values are means ±SE (n = 3). Asterisks indicate significantly different means (*p < 0.05, **p < 0.01, ***p < 0.001) between sites within species; uppercase letters denote significantly different means among species identified by Fisher’s LSD test (p < 0.05)
Photosynthesis
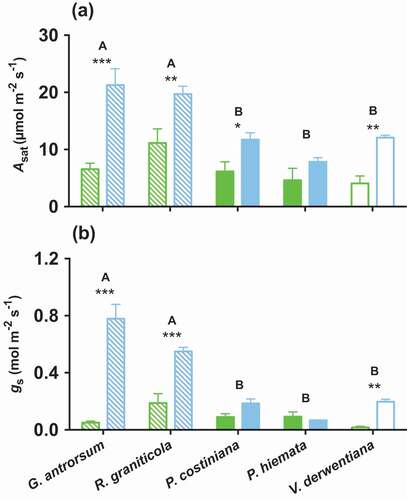
Light-saturated rates of photosynthesis (Asat: p < 0.001, F = 56.96, ) and stomatal conductance (gs: p < 0.001, F = 98.26, ) clearly followed soil Pi, and were greatest at DHP. Plant life form was important in determining responses in Asat to long-term P availability, with grasses less able to use accumulated phosphorus to increase Asat than forbs or shrubs. The Asat of forbs and shrubs was considerably greater at the DHP than at SP (G. antrorsum, SP = 6.6 ± 1.0 µmol m−2 s−1, DHP = 21.3 ± 2.8 µmol m−2 s−1; R. graniticola, SP = 11.1 ± 2.5 µmol m−2 s−1, DHP = 19.7 ± 1.4 µmol m−2 s−1; V. derwentiana, SP = 4.1 ± 1.3 µmol m−2 s−1, DHP = 12.1 ± 0.4 µmol m−2 s−1), while in grasses rates were more similar between sites (P. costiniana, SP = 6.2 ± 1.6 µmol m−2 s−1, DHP = 11.7 ± 1.2 µmol m−2 s−1; P. hiemata, SP = 4.6 ± 2.1 µmol m−2 s−1, DHP = 7.8 ± 0.7 µmol m−2 s−1).
Figure 2. (A) Light-saturated photosynthetic (Asat) and (B) stomatal conductance (gs) rates of G. antrorsum, R. graniticola, P. costiniana, P. hiemata, and V. derwentiana. Green = SP (low P) site; blue = DHP (high P) site. Dashed bars are forbs, filled bars are grasses, and empty bars are sub-shrub species. Values are means ±SE (n = 3). Asterisks indicate significantly different means (*p < 0.05, **p < 0.01, ***p < 0.001) between sites within species; uppercase letters denote significantly different means among species identified by Fisher’s LSD test (p < 0.05)
Membrane lipids
Membrane lipid composition varied strongly with site. The PLS-DA on membrane lipid composition clearly segregated SP and DHP for all species studied (p < 0.05; ). Subsequent t tests highlighted a number of individual lipids that varied strongly with site (Tables S1–S5). Lipids in leaves on the SP generally comprised 33.3 percent galactolipids (sum of nine MGDG and eleven DGDG species), 64.9 percent phospholipids (sum of fourteen PC, two lyso-PC, nine PE, four PG, and two PI species), 1.2 percent sulfolipids (sum of seven SQDG species), and 0.6 percent GlcCers and GlcADGs (sum of six GlcCer and five GlcADG species), while those on the DHP typically comprised 30 percent galactolipids, 68.6 percent phospholipids, 0.9 percent sulfolipids, and 0.5 percent GlcCers and GlcADGs (). Between-site differences in proportional concentrations of phospholipids were greatest in R. graniticola (7.4% less on the SP), P. hiemata (4.1% less on the SP), and V. derwentiana (4.2% less on the SP; ).
Figure 3. PLS-DA score plots of the top two membrane lipid components for G. antrorsum, R. graniticola, P. costiniana, P. hiemata, and V. derwentiana. Closed green crosses = SP (low P) site; blue triangles = DHP (high P) site. Shaded areas represent 95 percent confidence intervals
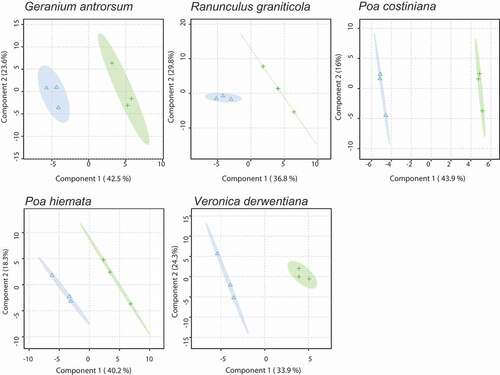
Figure 4. Total signal intensity, normalized for dry weight, for groups of lipids in the leaves of G. antrorsum, R. graniticola, P. costiniana, P. hiemata, and V. derwentiana. Green = SP (low P) site; blue = DHP (high P) site. The signal intensities of the different components of each group of lipids (phospholipids, filled bars; galactolipids, dashed bars; sulfolipids, empty bars; GlcCers and GlcADGs, checked bars) were summed. Values are mean signal intensities (n = 3)
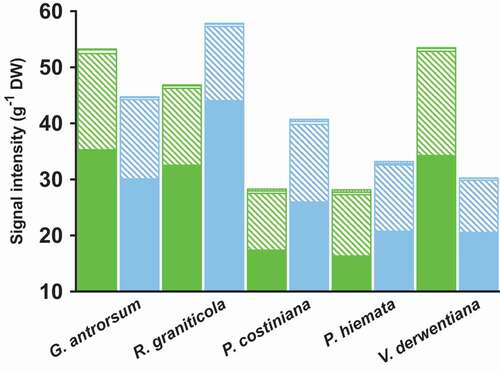
Foliar lipid concentrations also differed between sites, although patterns were highly variable among species. Reduced signal intensities (a proxy for lipid concentration) of the two most abundant phospholipid fractions were clear in the foliage of R. graniticola (−25% PC, p < 0.01; −36% PE, p < 0.001) and P. costiniana (−32% PC, p < 0.05; −42% PE, p < 0.05) at SP (), while there were no differences in the foliage of G. antrorsum and P. hiemata (p > 0.05). Signal intensities of almost all major membrane lipid fractions were greater in foliage of V. derwentiana at SP (65% PC, p < 0.01; 76% PE, p < 0.05; 162% PG, p < 0.01; 64% PI, p < 0.01; 104% MGDG, p < 0.001; 94% DGDG, p < 0.001; 88% SQDG, p < 0.001; ). Signal intensities of GlcADGs were constitutively larger in foliage at SP regardless of plant life form; on average, 52 percent greater than in foliage at DHP (p < 0.05; ).
Table 3. Signal intensities, normalized for dry weight, for major membrane lipid fractions in the leaves of G. antrorsum, R. graniticola, P. costiniana, P. hiemata, and V. derwentiana at the SP and DHP sites. Values are means ±SE (n = 3). Lowercase letters denote significantly different means among species identified by Fisher’s LSD test (p < 0.05); asterisks indicate significantly different means (*p < 0.05, **p < 0.01, ***p < 0.001) between sites within species
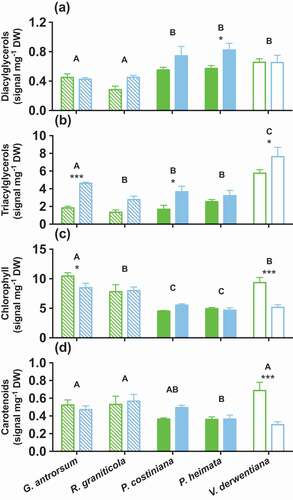
Storage lipids (diacylglycerols [DAGs] and triacylglycerols [TAGs]) were reduced in concentration at SP (DAGs, p < 0.05, F = 7.39; TAGs, p < 0.001, F = 29.99; and ). Foliar concentrations of DAGs were significantly (30%) less in P. hiemata (p < 0.05) at SP, while the concentration of TAGs was approximately half the concentration of DHP at SP for G. antrorsum (p < 0.001) and P. costiniana (p < 0.05) and a quarter the concentration for V. derwentiana (p < 0.05).
Figure 5. Leaf concentrations of (A) DAGs, (B) TAGs, (C) chlorophylls, and (D) carotenoids in G. antrorsum, R. graniticola, P. costiniana, P. hiemata, and V. derwentiana. Green = SP (low P) site; blue = DHP (high P) site. Dashed bars are herbaceous species, filled bars are grass species, empty bars are sub-shrub species. Values are means ±SE (n = 3). Asterisks indicate significantly different means between sites within each species (*P < 0.05, **P < 0.01, ***P < 0.001); uppercase letters denote significantly different means among species identified by Fisher’s LSD test (P < 0.05)
Antioxidants and pigments
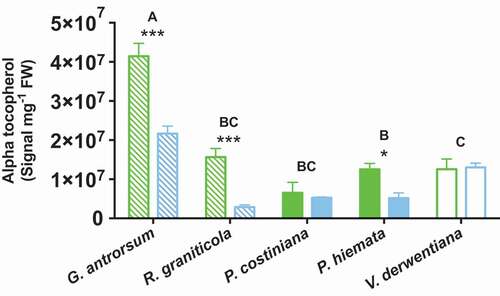
G. antrorsum, R graniticola, and V. derwentiana were able to alter their foliar chemistry in response to long-term P availability, while this response was less clear in the grass species (). Leaf chlorophyll content was greater at SP (p < 0.05, F = 7.01), with significantly greater concentrations found in the foliage of G. antrorsum (20% greater; p < 0.05) and V. derwentiana (81% greater; p < 0.001; ). Foliar carotenoid concentrations were also increased in V. derwentiana at SP (126%, p < 0.001; ). Foliar concentrations of alpha-tocopherol were greater at SP than at DHP (p < 0.001, F = 42.89; ), with significantly greater alpha-tocopherol content found in the leaves of G.antrorsum (91%, p < 0.001), R. graniticola (443%, p < 0.001), and P. hiemata (141%, p < 0.05).
Figure 6. Concentrations of alpha-tocopherol in foliage of G. antrorsum, R. graniticola, P. costiniana, P. hiemata, and V. derwentiana. Green = SP (low P) site; blue = DHP (high P) site. Dashed bars are herbaceous species, filled bars are grass species, empty bars are sub-shrub species. Values are means ±SE (n = 3). Asterisks indicate significantly different means between sites within each species (*P < 0.05, **P < 0.01, ***P < 0.001); uppercase letters denote significantly different means among species identified by Fisher’s LSD test (P < 0.05)
Discussion
Numerous studies suggest that native Australian plants with specialized root systems can tolerate reduced soil phosphorus availability (Lambers et al. Citation2012; Sulpice et al. Citation2014), and that plants exhibit strong short-term responses to P stress (Muneer and Jeong Citation2015; Zhang et al. Citation2014). Our field-based study is unique in considering the chemical and physiological adaptations of generalist plants (i.e., without specialized root structures) of a variety of life forms to long-term limitation of P supply. Our results indicate a limited tolerance to shortages of P—one that is met by adaptation strategies that differ among plant life forms.
Phosphorus acquisition from the soil
Although the total P content of soils was similar at our two study sites (SP = 9.8 ± 1.5 mg P kg−1 DW, DHP = 9.4 ± 1.2 mg P kg−1 DW), the sites differed in distribution among P fractions. The greater concentrations of organic P in soils at SP are likely less significant to plant nutrition because of the generally cool climates that restrict mineralization processes and the turnover of organic P, in turn reducing plant P availability (Vance, Uhde-Stone, and Allan Citation2003). Alternatively, water-soluble inorganic phosphate (Pi) is readily taken up by the roots (Vance, Uhde-Stone, and Allan Citation2003), and was considerably more abundant at DHP. Foliar P concentrations of the studied forb and grass species were associated with Pi in the soil solution, suggesting minimal contributions of soil organic P to plant nutrition, consistent with current literature (Chiou and Lin Citation2011). The one exception was V. derwentiana, which showed similar foliar concentrations of P at both SP and DHP.
Photosynthesis
Net CO2 assimilation rates at SP were considerably slower than those at DHP. Between-site differences were larger in the forb and shrub species than in the grass species, suggesting that photosynthesis in these species may be biochemically or diffusionally limited by P availability, while grasses may have intrinsically lower photosynthetic capacity to reduce reliance on external P. Most studies report reduced photosynthetic capacity under P stress (Jacob and Lawlor Citation1991; Turnbull, Warren, and Adams Citation2007; Warren Citation2011) because of both diffusional and biochemical limitations. Reduced rates of stomatal and mesophyll conductance are well documented (Singh et al. Citation2013; Zhang et al. Citation2014); however, impaired ribulose-1,5-biphosphate (RuBP) regeneration rate and reduced ribulose-1,5-biphosphate carboxylase/oxygenase (RuBisCO) carboxylation efficiency are considered to be the primary factors limiting photosynthesis (Hernández and Munné-Bosch Citation2015; Jacob and Lawlor Citation1992).
Stomatal conductance correlated closely with photosynthetic rate in all studied species. In general terms, if conductance was maintained then rates of photosynthesis varied only marginally. Diffusional limitations seem likely to be responsible for reduced rates of photosynthesis at SP. Reduced stomatal conductance, via smaller and fewer stomata, is a putative adaptation to long-term P stress (Sun et al. Citation2014), and could prevent direct biochemical inhibition of photosynthesis. Further work is needed to confirm this hypothesis. Chiou and Lin (Citation2011) suggested that phosphorus starvation response (PSR) is controlled by the supply of Pi to the roots, not just systemically via internal P concentrations, implying long-distance signaling mechanisms may be involved in photosynthetic down-regulation, glycolipid biosynthesis, phospholipid degradation, and stomatal closure.
Reduced photosynthetic capacity seems to inexorably result in increased susceptibility to photoinhibition and photooxidative stress (for review, see Hernández and Munné-Bosch Citation2015), particularly in alpine ecosystems that are subject to consistently strong radiation, including ultraviolet (Körner Citation1999). Recent genomic and proteomic studies with the model plant Arabidopsis thaliana argue that there is programmed down-regulation of gene expression for photosynthesis under P starvation, with simultaneous up-regulation of genes encoding photoprotective measures and systems-scavenging reactive oxygen species (Misson et al. Citation2005; Morcuende et al. Citation2007; Wu et al. Citation2003). Similar results have been found in other herbaceous species, including maize (Zhang et al. Citation2014), tomato (Muneer and Jeong Citation2015), and rice (Park et al. Citation2012).
Lipids
The replacement of membrane phospholipids with P-free lipids is a well-documented strategy of plants for allocation of internal P (Andersson et al. Citation2003; Li, Welti, and Wang Citation2006). This strategy seemed unrelated to plant life form but did vary between individual species. R. graniticola and P. hiemata substituted phospholipids with both galactolipids and sulfolipids in foliage at SP. These species also showed a lessened impact of reduced Pi availability on photosynthetic rate. G. antrorsum and P. costiniana had similar membrane lipid compositions between sites and greater reductions in photosynthesis. Replacement with sulfolipids is particularly important, because within plant cells this lipid group is limited to the chloroplast membrane (Benning Citation1998), so small increases in overall leaf sulfolipid concentration can equate to large increases in their concentration in the chloroplast membrane.
At our SP study site, all species accumulated glucuronosyldiacylglycerols (GlcADGs) in their leaves, albeit at lesser concentrations than phospholipids, galactolipids, and sulfolipids. GlcADGs have only recently been identified in plants, but are already described as critical to relieving the stress caused by P limitation (Okazaki and Saito Citation2014). GlcADGs accumulate under P stress in wild-type Arabidopsis thaliana, while GlcADG-deficient mutants showed significant growth defects under the same treatment conditions (Okazaki et al. Citation2013), with similar responses seen in tomato and soybean (Okazaki et al. Citation2015). The exact functional mechanism of these molecules remains unclear.
Lipid peroxidation is a risk under P deficiency because of greater photooxidative stress in mesophyll cells (Hernández and Munné-Bosch Citation2015); however, we found no evidence for this process. Instead, increased foliar concentrations of alpha-tocopherol, an important liposoluble antioxidant (Mallet et al. Citation1994) could prevent lipid peroxidation in forbs. Increased abundance of carotenoids, particularly in the sub-shrub V. derwentiana, help protect the photosynthetic apparatus from excess light and can alleviate oxidative stress via the xanthophyll cycle (Latowski, Kuczyska, and Strzalka Citation2011). Up-regulation of glutathione and ascorbate synthesis will also alleviate oxidative stress (Foyer and Noctor Citation2011).
Concentrations of DAGs and TAGs were considerably greater in the leaves of all species at DHP, and can act as a sink for excess photosynthate (Lin and Oliver Citation2008). Preferential resource allocation to membranes and photoprotective measures helps explain reduced concentrations in foliage at SP (Winichayakul et al. Citation2013).
Conclusions
Plants in subalpine Australian ecosystems seemingly optimize P use, albeit not sufficiently to negate potential reductions in photosynthesis that are the result of long-term reduced P availability. Nonetheless, P use and acquisition strategies varied among the plant species studied in response to site P availability. The two forb species altered foliar chemistry by promoting antioxidant biosynthesis and inhibiting accumulation of storage lipids. The woody shrub species maintained consistent leaf P concentration regardless of the availability of Pi. The studied grasses reduced their reliance on exogenous P by maintaining an inherently reduced photosynthetic capacity. Reduced rates of photosynthesis at SP were arguably because of direct diffusional and biochemical limitations. Replacement of phospholipids with galactolipids and sulfolipids in foliage at SP was clear in most species, with more extensive replacement alleviating decreases in photosynthetic rate and stomatal conductance. Glucuronosyldiacylglyerol concentrations were increased in all species at SP, characteristic of P stress, while increased carotenoid and tocopherol concentrations in foliage at SP concomitantly prevent photooxidative damage that accompanies reduced P conditions. Further work is needed to assess the P acquisition strategies used by plants in these ecosystems, and the interaction of long-term reduced P availability with other environmental factors, particularly oxidative stress.
Supplementary Materials
Download Zip (210.9 KB)Acknowledgments
We thank Barry Aitchison and the Treasure family for site access; David Coleman, Helen Liang, Svetlana Ryazanova, and Alexandra Barlow for assistance with fieldwork; and Hero Tahei, Dr. Marshall McDaniel, Dr. Robert Simpson, and Dr. Florian Netzer for assistance with soil analyses. We would also like to thank Kouji Takano at RIKEN for assistance with lipid analysis.
Related Research Data
References
- Andersson, M. X., K. E. Larsson, H. Tjellström, C. Liljenberg, and A. S. Sandelius. 2005. The plasma membrane and the tonoplast as major targets for phospholipid-to-glycolipid replacement and stimulation of phospholipases in the plasma membrane. Journal of Biological Chemistry 280 (30):27578–86. doi:https://doi.org/10.1074/jbc.M503273200.
- Andersson, M. X., M. H. Stridh, K. E. Larsson, C. Lijenberg, and A. S. Sandelius. 2003. Phosphate-deficient oat replaces a major portion of the plasma membrane phospholipids with the galactolipid digalactosyldiacylglycerol. FEBS Letters 537 (1–3):128–32. doi:https://doi.org/10.1016/S0014-5793(03)00109-1.
- Benning, C. 1998. Biosynthesis and function of the sulfolipid sulfoquinovosyl diacylglycerol. Annual Review of Plant Physiology and Plant Molecular Biology 49:53–75.
- Berch, S. M., S. Gamiet, and E. Deom. 1988. Mycorrhizal status of some plants of southwestern British-Columbia. Canadian Journal of Botany-Revue Canadienne De Botanique 66 (10):1924–28.
- Blake, G. R., and K. H. Hartge. 1986. Bulk density. In Methods of soil analysis. Part 1. Physical and mineralogical methods, ed. A. Klute, 363–375. Madison, WI: American Society of Agronomy.
- Brundrett, M. C. 2002. Coevolution of roots and mycorrhizas of land plants. New Phytologist 154 (2):275–304. doi:https://doi.org/10.1046/j.1469-8137.2002.00397.x.
- Cassel, D. K., and D. R. Nielsen. 1986. Field capacity and available water capacity. In Methods of soil analysis. Part 1. Physical and mineralogical methods, ed. A. Klute, 901–26. Madison, WI: American Society of Agronomy.
- Chiou, T. J., and S. I. Lin. 2011. Signaling network in sensing phosphate availability in plants. In S. S. Merchant, W. R. Briggs, and D. Ort, eds., Annual Review of Plant Biology 62, 185–206.
- Dakora, F. D., and D. A. Phillips. 2002 . Root exudates as mediators of mineral acquisition in low-nutrient environments. Plant and Soil 245 (1):35–47. doi:https://doi.org/10.1023/A:1020809400075.
- Dijkstra, F. A., E. Pendall, J. A. Morgan, D. M. Blumenthal, Y. Carrillo, D. R. LeCain, R. F. Follett, and D. G. Williams. 2012. Climate change alters stoichiometry of phosphorus and nitrogen in a semiarid grassland. New Phytologist 196 (3):807–15. doi:https://doi.org/10.1111/nph.2012.196.issue-3.
- Erxleben, A., A. Gessler, M. Vervliet-Scheebaum, and R. Reski. 2012. Metabolite profiling of the moss Physcomitrella patens reveals evolutionary conservation of osmoprotective substances. Plant Cell Reports 31 (2):427–36. doi:https://doi.org/10.1007/s00299-011-1177-9.
- Essigmann, B., S. Güler, R. A. Narang, D. Linke, and C. Benning. 1998. Phosphate availability affects the thylakoid lipid composition and the expression of SQD1, a gene required for sulfolipid biosynthesis in Arabidopsis thaliana. Proceedings of the National Academy of Sciences of the United States of America 95 (4):1950–55. doi:https://doi.org/10.1073/pnas.95.4.1950.
- Fisher, J. B., G. Badgley, and E. Blyth. 2012. Global nutrient limitation in terrestrial vegetation. Global Biogeochemical Cycles 26.doi:https://doi.org/10.1029/2011GB004252.
- Foyer, C. H., and G. Noctor. 2011. Ascorbate and glutathione: The heart of the redox hub. Plant Physiology 155 (1):2–18. doi:https://doi.org/10.1104/pp.110.167569.
- Garden, D. L., Dowling P. M., Eddy D. A., and Nicol H. I. 2001. The influence of climate, soil, and management on the composition of native grass pastures on the central, southern, and Monaro tablelands of New South Wales. Australian Journal of Agricultural Research 52 (9):925–936.
- Gaude, N., H. Tippmann, E. Flemetakis, P. Katinakis, M. Udvardi, and P. Dörmann. 2004. The galactolipid digalactosyldiacylglycerol accumulates in the peribacteroid membrane of nitrogen-fixing nodules of soybean and Lotus. Journal of Biological Chemistry 279 (33):34624–30. doi:https://doi.org/10.1074/jbc.M404098200.
- Härtel, H., P. Dörmann, and C. Benning. 2000. DGD1-independent biosynthesis of extraplastidic galactolipids after phosphate deprivation in Arabidopsis. Proceedings of the National Academy of Sciences of the United States of America 97 (19):10649–54. doi:https://doi.org/10.1073/pnas.180320497.
- Härtel, H., P. Dörmann, and C. Benning. 2001. Galactolipids not associated with the photosynthetic apparatus in phosphate-deprived plants. Journal of Photochemistry and Photobiology B-Biology 61 (1–2):46–51. doi:https://doi.org/10.1016/S1011-1344(01)00144-0.
- Hernández, I., and S. Munné-Bosch. 2015. Linking phosphorus availability with photo-oxidative stress in plants. Journal of Experimental Botany 66 (10):2889–900. doi:https://doi.org/10.1093/jxb/erv056.
- Jacob, J., and D. W. Lawlor. 1991. Stomatal and mesophyll limitations of photosynthesis in phosphate deficient sunflower, maize and wheat plants. Journal of Experimental Botany 42 (241):1003–11. doi:https://doi.org/10.1093/jxb/42.8.1003.
- Jacob, J., and D. W. Lawlor. 1992. Dependence of photosynthesis of sunflower and maize leaves on phosphate supply, ribulose-1,5-bisphosphate carboxylase oxygenase activity, and ribulose-1,5-bisphosphate pool size. Plant Physiology 98 (3):801–7. doi:https://doi.org/10.1104/pp.98.3.801.
- Javaid, A. 2008. Allelopathy in mycorrhizal symbiosis in the Poaceae family. Allelopathy Journal 21 (2):207–17.
- Jouhet, J., E. Maréchal, B. Baldan, R. Bligny, J. Joyard, and M. A. Block. 2004. Phosphate deprivation induces transfer of DGDG galactolipid from chloroplast to mitochondria. Journal of Cell Biology 167 (5):863–74. doi:https://doi.org/10.1083/jcb.200407022.
- Kopka, J., N. Schauer, S. Krueger, C. Birkemeyer, B. Usadel, E. Bergmüller, P. Dörmann, W. Weckwerth, Y. Gibon, M. Stitt, et al. 2005. [email protected]: The golm metabolome database. Bioinformatics 21 (8):1635–38. doi:https://doi.org/10.1093/bioinformatics/bti236.
- Körner, C. 1999. Alpine plant life: Functional plant ecology of high mountain ecosystems. Berlin: Springer-Verlag.
- Kreuzwieser, J., J. Hauberg, K. A. Howell, A. Carroll, H. Rennenberg, A. H. Millar, and J. Whelan. 2009. Differential response of gray poplar leaves and roots underpins stress adaptation during hypoxia. Plant Physiology 149 (1):461–73. doi:https://doi.org/10.1104/pp.108.125989.
- Lambers, H., G. R. Cawthray, P. Giavalisco, J. Kuo, E. Laliberté, S. J. Pearse, W. R. Scheible, M. Stitt, F. Teste, and B. L. Turner. 2012. Proteaceae from severely phosphorus-impoverished soils extensively replace phospholipids with galactolipids and sulfolipids during leaf development to achieve a high photosynthetic phosphorus-use-efficiency. New Phytologist 196 (4):1098–108. doi:https://doi.org/10.1111/j.1469-8137.2012.04285.x.
- Latowski, D., P. Kuczyska, and K. Strzalka. 2011. Xanthophyll cycle: A mechanism protecting plants against oxidative stress. Redox Report 16 (2):78–90. doi:https://doi.org/10.1179/174329211X13020951739938.
- Li, M. Y., R. Welti, and X. M. Wang. 2006. Quantitative profiling of Arabidopsis polar glycerolipids in response to phosphorus starvation: Roles of phospholipases D zeta 1 and D zeta 2 in phosphatidylcholine hydrolysis and digalactosyldiacylglycerol accumulation in phosphorus-starved plants. Plant Physiology 142 (2):750–61. doi:https://doi.org/10.1104/pp.106.085647.
- Lin, W. L., and D. J. Oliver. 2008. Role of triacylglycerols in leaves. Plant Science 175 (3):233–37. doi:https://doi.org/10.1016/j.plantsci.2008.04.003.
- Mallet, J. F., C. Cerrati, E. Ucciani, J. Gamisans, and M. Gruber. 1994. Antioxidant activity of plant-leaves in relation to their alpha-tocopherol content. Food Chemistry 49 (1):61–65. doi:https://doi.org/10.1016/0308-8146(94)90233-X.
- McKenzie, N., D. Jacquier, R. F. Isbell, and K. Brown. 2004. Australian soils and landscapes: An illustrated compendium. Melbourne: CSIRO.
- Minnikin, D. E., H. Abdolrah., and J. Baddiley. 1974. replacement of acidic phospholipids by acidic glycolipids in Pseudomonas diminuta. Nature 249 (5454):268–69. doi:https://doi.org/10.1038/249268a0.
- Misson, J., K. G. Raghothama, A. Jain, J. Jouhet, M. A. Block, R. Bligny, P. Ortet, A. Creff, S. Somerville, N. Rolland, et al. 2005. A genome-wide transcriptional analysis using Arabidopsis thaliana Affymetrix gene chips determined plant responses to phosphate deprivation. Proceedings of the National Academy of Sciences of the United States of America 102 (33):11934–39. doi:https://doi.org/10.1073/pnas.0505266102.
- Morcuende, R., R. Bari, Y. Gibon, W. M. Zheng, B. D. Pant, O. Bläsing, B. Usadel, T. Czechowski, M. K. Udvardi, M. Stitt, et al. 2007. Genome-wide reprogramming of metabolism and regulatory networks of Arabidopsis in response to phosphorus. Plant Cell and Environment 30 (1):85–112. doi:https://doi.org/10.1111/j.1365-3040.2006.01608.x.
- Muneer, S., and B. R. Jeong. 2015. proteomic analysis provides new insights in phosphorus homeostasis subjected to Pi (inorganic phosphate) starvation in tomato plants (Solanum lycopersicum L.). PLoS ONE 10 (7):18. doi:https://doi.org/10.1371/journal.pone.0134103.
- Murphy, J., and J. P. Riley. 1962. A modified single solution method for determination of phosphate in natural waters. Analytica Chimica Acta 26 (1):31–36. doi:https://doi.org/10.1016/S0003-2670(00)88444-5.
- Netzer, F., Thom C., Celepirovic N., Ivankovic M., Alfarraj S., Dounavi A., Simon J., Herschbach C., and Rennenberg H. 2016. Drought effects on C, N, and P nutrition and the antioxidative system of beech seedlings depend on geographic origin. Journal of Plant Nutrition and Soil Science 179 (2):136–150.
- Okazaki, Y., T. Nishizawa, K. Takano, M. Ohnishi, T. Mimura, and K. Saito. 2015. Induced accumulation of glucuronosyldiacylglycerol in tomato and soybean under phosphorus deprivation. Physiologia Plantarum 155 (1):33–42. doi:https://doi.org/10.1111/ppl.2015.155.issue-1.
- Okazaki, Y., H. Otsuki, T. Narisawa, M. Kobayashi, S. Sawai, Y. Kamide, M. Kusano, T. Aoki, M. Y. Hirai, and K. Saito. 2013. A new class of plant lipid is essential for protection against phosphorus depletion. Nature Communications 4. doi:https://doi.org/10.1038/ncomms2512.
- Okazaki, Y., and K. Saito. 2014. Roles of lipids as signaling molecules and mitigators during stress response in plants. Plant Journal 79 (4):584–96. doi:https://doi.org/10.1111/tpj.12556.
- Park, M. R., S. H. Baek, B. G. De Los Reyes, S. J. Yun, and K. H. Hasenstein. 2012. Transcriptome profiling characterizes phosphate deficiency effects on carbohydrate metabolism in rice leaves. Journal of Plant Physiology 169 (2):193–205. doi:https://doi.org/10.1016/j.jplph.2011.09.002.
- Plaxton, W. C., and H. T. Tran. 2011. Metabolic adaptations of phosphate-starved plants. Plant Physiology 156 (3):1006–15. doi:https://doi.org/10.1104/pp.111.175281.
- Raven, J. A. 2013. The evolution of autotrophy in relation to phosphorus requirement. Journal of Experimental Botany 64 (13):4023–46. doi:https://doi.org/10.1093/jxb/ert306.
- Reef, R., M. C. Ball, I. C. Feller, and C. E. Lovelock. 2010. Relationships among RNA: DNA ratio, growth and elemental stoichiometry in mangrove trees. Functional Ecology 24 (5):1064–72. doi:https://doi.org/10.1111/j.1365-2435.2010.01722.x.
- Saunders, W. M. H., and E. G. Williams. 1955. Observations on the determination of total organic phosphorus in soils. Journal of Soil Science 6 (2):254–67. doi:https://doi.org/10.1111/(ISSN)1365-2389a.
- Singh, S. K., G. Badgujar, V. R. Reddy, D. H. Fleisher, and J. A. Bunce. 2013. Carbon dioxide diffusion across stomata and mesophyll and photo-biochemical processes as affected by growth CO2 and phosphorus nutrition in cotton. Journal of Plant Physiology 170 (9):801–13. doi:https://doi.org/10.1016/j.jplph.2013.01.001.
- Sulpice, R., H. Ishihara, A. Schlereth, G. R. Cawthray, B. Encke, P. Giavalisco, A. Ivakov, S. Arrivault, R. Jost, N. Krohn, et al. 2014. Low levels of ribosomal RNA partly account for the very high photosynthetic phosphorus-use efficiency of Proteaceae species. Plant Cell and Environment 37 (6):1276–98. doi:https://doi.org/10.1111/pce.12240.
- Sun, Y. Q., F. Yan, X. Y. Cui, and F. L. Liu. 2014. Plasticity in stomatal size and density of potato leaves under different irrigation and phosphorus regimes. Journal of Plant Physiology 171 (14):1248–55. doi:https://doi.org/10.1016/j.jplph.2014.06.002.
- Tjellström, H., M. X. Andersson, K. E. Larsson, and A. S. Sandelius. 2008. Membrane phospholipids as a phosphate reserve: The dynamic nature of phospholipid-to-digalactosyl diacylglycerol exchange in higher plants. Plant Cell and Environment 31 (10):1388–98. doi:https://doi.org/10.1111/j.1365-3040.2008.01851.x.
- Turnbull, T. L., C. R. Warren, and M. A. Adams. 2007. Novel mannose-sequestration technique reveals variation in subcellular orthophosphate pools do not explain the effects of phosphorus nutrition on photosynthesis in Eucalyptus globulus seedlings. New Phytologist 176 (4):849–61. doi:https://doi.org/10.1111/nph.2007.176.issue-4.
- van der Heijden, M. G. A., F. M. Martin, M. A. Selosse, and I. R. Sanders. 2015. Mycorrhizal ecology and evolution: The past, the present, and the future. New Phytologist 205 (4):1406–23. doi:https://doi.org/10.1111/nph.13288.
- Vance, C. P., C. Uhde-Stone, and D. L. Allan. 2003. Phosphorus acquisition and use: Critical adaptations by plants for securing a nonrenewable resource. New Phytologist 157 (3):423–47. doi:https://doi.org/10.1046/j.1469-8137.2003.00695.x.
- Veneklaas, E. J., H. Lambers, J. Bragg, P. M. Finnegan, C. E. Lovelock, W. C. Plaxton, C. A. Price, W. R. Scheible, M. W. Shane, P. J. White, et al. 2012. Opportunities for improving phosphorus-use efficiency in crop plants. New Phytologist 195 (2):306–20. doi:https://doi.org/10.1111/j.1469-8137.2012.04190.x.
- Vitousek, P. M., and R. W. Howarth. 1991. Nitrogen limitation on land and in the sea: How can it occur? Biogeochemistry 13 (2):87–115. doi:https://doi.org/10.1007/BF00002772.
- Wahren, C. H., R. J. Williams, and W. A. Papst. 1999. Alpine and subalpine wetland vegetation on the bogong high plains, south-eastern australia. Australian Journal of Botany 47 (2):165–88. doi:https://doi.org/10.1071/BT97106.
- Warren, C. R. 2011. How does P affect photosynthesis and metabolite profiles of Eucalyptus globulus? Tree Physiology 31 (7):727–39. doi:https://doi.org/10.1093/treephys/tpr064.
- Williams, C. H., and A. Steinbergs. 1959. Soil sulphur fractions as chemical indices of available sulphur in some Australian soils. Australian Journal of Agricultural Research 10 (3):340–52. doi:https://doi.org/10.1071/AR9590340.
- Winichayakul, S., R. W. Scott, M. Roldan, J. H. B. Hatier, S. Livingston, R. Cookson, A. C. Curran, and N. J. Roberts. 2013. In vivo packaging of triacylglycerols enhances Arabidopsis leaf biomass and energy density. Plant Physiology 162 (2):626–39. doi:https://doi.org/10.1104/pp.113.216820.
- Wu, P., L. G. Ma, X. L. Hou, M. Y. Wang, Y. R. Wu, F. Y. Liu, and X. W. Deng. 2003. Phosphate starvation triggers distinct alterations of genome expression in Arabidopsis roots and leaves. Plant Physiology 132 (3):1260–71. doi:https://doi.org/10.1104/pp.103.021022.
- Xia, J., Sinelnikov I. V., Han B., and Wishart D. S.. 2015. MetaboAnalyst 3.0—making metabolomics more meaningful. Nucleic Acids Research 43 (1):251–257
- Zhang, K. W., H. H. Liu, P. L. Tao, and H. Chen. 2014. Comparative proteomic analyses provide new insights into low phosphorus stress responses in maize leaves. PLoS ONE 9 (5):16.