
ABSTRACT
Microorganisms play a significant role in changing the physical properties of the surface of the Greenland Ice Sheet. Cryoconite holes are a hotspot for this microbial activity, yet little is known about the REDOX conditions that develop within them. In this study, we used oxygen microelectrodes and microoptodes to measure for anoxic conditions at the microscale, for the first time revealing a potential niche for anaerobic microorganisms and anaerobic processes. The development of an anoxic zone 2 mm deep within a 6 mm-thick layer of cryoconite sediment was observed within an hour of disturbance, showing rapid acclimation to changing physical conditions. Long-term (half year) incubations of cryoconite material showed a peak of oxygen production and consumption after forty days and reached a low-activity, steady state by day 116, with a persisting anoxic zone beginning between 2 mm and 4 mm deep. Anaerobic microorganisms, which have received little attention to date, should therefore be considered an important component of the cryoconite ecosystem. We discuss the possible dynamics of oxygen concentrations in the supraglacial system and infer that anoxic zones are an important factor in the development of cryoconite sediment communities.
Introduction
Cryoconite holes are a distinct microbial niche within the polar biome (Anesio and Laybourn-Parry Citation2012b; Hodson et al. Citation2015b). They are formed when dark-colored dust particles deposited on ice surfaces melt into the surrounding ice, creating a cylindrical or quasi-cylindrical hole that is filled with water and has a sediment layer at the bottom (Bagshaw et al. Citation2007; Porazinska et al. Citation2004b). First recorded in Greenland, they occur in the ablation zone of glaciers all over the world (Cook et al. Citation2015b). Cryoconite material is considered to be one of the potent albedo-reducing factors contributing to the darkening process of a large sector of the Greenland Ice Sheet (GrIS) (Benning et al. Citation2014b; Musilova et al. Citation2015b; Takeuchi, Kohshima, and Seko Citation2001b; Yallop et al. Citation2012b). Albedo decline augments the melting of the GrIS (Tedesco et al. Citation2015b), which has increased in recent years (Chen, Wilson, and Tapley Citation2006b; Hanna et al. Citation2008b; Rignot et al. Citation2011b; Yallop et al. Citation2012b). The precise contribution of biological effects to total melting requires investigation (Tedesco et al. Citation2015b), but its importance has been recognized (Benning et al. Citation2014b; Stibal, Šabacká, and Žárský Citation2012b; Tedesco et al. Citation2015b; Uetake et al. Citation2010b; Yallop et al. Citation2012b).
Despite growing evidence and studies on cryospheric microorganisms dating back to the 1930s (Boetius et al. Citation2015b; Hodson et al. Citation2015b), little is known about the structure of the community, especially the role of particular groups of microorganisms (photoauto- and chemoheterotrophs) in biogeochemical processes on glaciers (Anesio and Laybourn-Parry Citation2012b). The activity and abundance of phototrophs within cryoconite, with a special focus on photosynthesis and organic carbon production, has been thoroughly studied (Anesio et al. Citation2009b; Cook et al. Citation2012b; Stibal and Tranter Citation2007b; Telling et al. Citation2012b), but less is known about the chemoheterotrophs and their potential contribution to activity. The few studies on these organisms include Anesio et al. (Citation2010b), who estimated bacterial production within cryoconite holes and showed that only up to 7 percent of organic carbon from debris is used for bacterial growth, and Telling et al. (Citation2012b), who showed that thick (>3 mm) sediment is dominated by heterotrophic respiration and processes. Novel aerobic strains (e.g., Polaromonas glacialis, Polaromonas cryoconiti) were isolated and classified from Alpine glaciers (Margesin et al. Citation2012a, Citation2003b, Citation2012b; Margesin, Zacke, and Schinner Citation2002b); aerobic and potentially anaerobic groups were identified from metagenomics snapshots (Edwards et al. Citation2013b) in the Arctic; and bacterial diversity was studied via molecular methods in Antarctic communities (Cameron, Hodson, and Osborn Citation2012b; Christner, Kvitko, and Reeve Citation2003b). Anaerobic groups have been specifically reported in enrichments from Antarctic communities (Zdanowski et al. Citation2016b), but studies suggest that they also exist in Arctic and alpine cryoconite (Edwards et al. Citation2014b, Citation2013b). To date, cryoconite holes have been primarily considered an aerobic environment, with the potential for anaerobic niches within cryoconite granules (Segawa et al. Citation2014b; Uetake et al. Citation2016b) and thicker sediments (Bagshaw et al., Citation2007; Telling et al. Citation2012b). Anaerobic metabolism yields less energy than aerobic (Maier and Pepper Citation2015b), but indirectly leads to additional oxygen consumption through oxidation of reduced substances from anaerobic decay, removes nutrients by denitrification, contributes to remineralization of organic carbon, and changes the alkalinity of the sediment (Hu and Cai Citation2011b; Werner et al. Citation2006b). The availability of oxygen determines the type of biogeochemical reactions that may occur within the sediment, yet basic measurements of oxygen within sediment layers are as yet absent from studies of cryoconite. It is therefore timely to identify anoxic niches within cryoconite layers, measure their extent, and assess their contribution to biogeochemical cycles operating on the surface of ice sheets. Here we present a range of oxygen profiles of cryoconite granules and cryoconite layers from the southwest GrIS, revealing oxygen-rich and oxygen-depleted micro-niches within cryoconite material. To our knowledge, this is the first report confirming the presence of formerly hypothesized anaerobic zones in cryoconite deposits on the glacial surface.
Methods
Study sites and sample collection
The two study sites are located near Kangerlussuaq in the ablation zone of the southwestern GrIS, and are referred to as Point 660 and Black and Bloom. The site commonly known as Point 660 is located approximately 25 km (67.06000, −50.17000) east of Kangerlussuaq (), on the Russell Glacier at the margin of GrIS. Here, samples for laboratory experiments were collected in the summer melt season of 2015. Some five samples were scooped from cryoconite holes using clean, disposable nitrile gloves, and were transferred into Ziploc plastic bags that were prewashed with deionized water. Samples were collected from both isolated and hydrologically connected cryoconite holes, chosen randomly within a 500 m area. All samples were returned to Kangerlussuaq International Science Support center within six hours and were frozen prior to temperature-controlled transport to Cardiff University. There they were stored in a −20°C freezer until laboratory experiments commenced.
Figure 1. Location of the cryoconite holes used for in situ incubations, measurements, and sampling on the Greenland Ice Sheet at Point 660 (67.06000, −50.17000) on the ice sheet margins and at camp Black and Bloom (67.07482, −49.3586). Map is acquired as an image from Modis Satellite
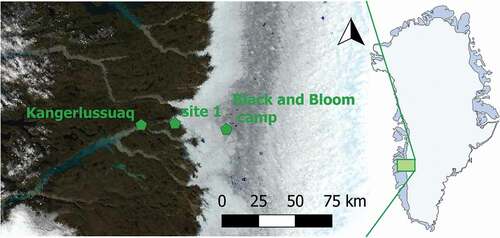
The second study site, Black and Bloom, is located 60 km (67.07482, −49.3586) east of Kangerlussuaq () and approximately 2 km east of weather station S6 (Utrecht University), which has been used for research for more than twenty years (Smeets et al. Citation2018). The site is within dark bands identified on the ice surface by satellite observations (Bøggild et al. Citation2010b; Tedesco et al. Citation2011b; Yallop et al. Citation2012b), and is the focus of an intensive investigation into the processes controlling ice sheet albedo change (blackandbloom.org).
Field in situ measurements
At Black and Bloom (near S6), in situ measurements of oxygen profiles of cryoconite holes were undertaken during several days in July 2016 using the microoptode described further on at 0.5 mm increments measured by a manual micromanipulator (). Three different types of holes with different sediment depths and water levels were chosen: classic cryoconite holes, with more than 10 cm of overlying water and sediment depth of 3–5 mm; partly drained and accumulated holes, with 0.5–2 cm of sediment and 1 cm of water; and drained and accumulated cryoconite material deposited on the side of the streams, with more than 2 cm of sediment and no overlying water (see in the results section). Where possible, measurements of multiple cryoconite holes (n = 2 or 3) of the same type were performed (classic and drained and accumulated), but n = 1 for partly drained and accumulated.
Figure 2. A custom-made incubation vessel, manufactured using 3D printing with sampling ports on the sides to enable measurement of oxygen, pH, and microbial community changes with depth
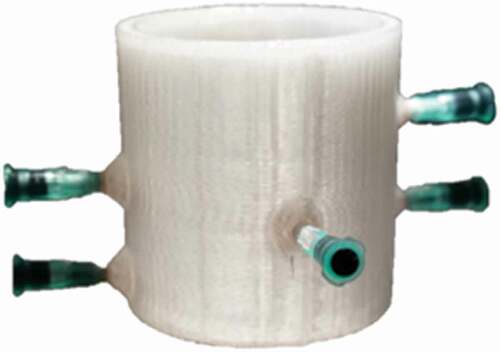
Figure 3. Microoptode positioned with a manual micromanipulator for in situ measurement of an oxygen profile in a cryoconite hole on the surface of the Greenland Ice Sheet
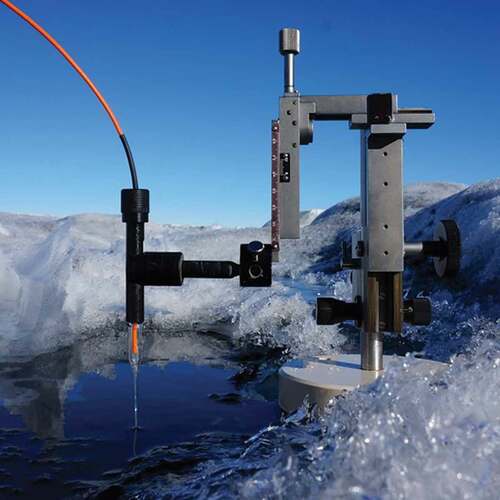
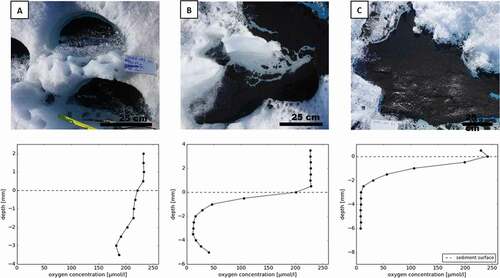
Figure 4. In situ oxygen profiles of varying morphologies of cryoconite sediments measured with a microoptode in a variety of cryoconite sediment accumulations. Note the different vertical scale on the graphs. (A) A classic cryoconite hole, with a regular, semicircular shape. Water depth was approximately 11 cm and sediment depth was approximately 4 mm. (B) Cryoconite sediment in an irregularly shaped hole, with a water depth of 1–7 cm and sediment depth of 1 cm. (C) A thick layer of cryoconite material (1.5 cm) without a layer of water
Field incubations
Incubations of cryoconite material were carried out at Black and Bloom (S6) throughout twenty days in July 2016. Several samples from the same sampling location were pooled together to assure sufficient material for incubations. Previous research has suggested that the effect of pooling of neighboring cryoconite holes in the Arctic is negligible because of similarities of bacterial communities at small scale (Edwards et al. Citation2014b). Incubating vessels were custom built using a 3-D printer and food-approved ABS plastic (nontoxic), which was sterilised with 70 percent ethanol and prewashed with deionized, autoclaved water. Each incubation vessel, with predrilled ports for instrumentation (), was filled with approximately 28 g of cryoconite sediment (± 5%) and 77 ml of Milli-Q water, leaving approximately 10 ml head space. Cryoconite samples were incubated under the following conditions: (1) light and open to the atmosphere (n = 3); (2) dark and wrapped in aluminum foil but open to the atmosphere via small, shaded holes (n = 3); (3) light and closed, where the vessels were sealed with a transparent, acrylic Perspex lid, which limited gas exchange with the atmosphere (n = 3); and (4) dark and closed, with vessels sealed with a lid and wrapped in aluminum foil (n = 3). Shortly after the incubation vessels were filled with the sediment, the series of oxygen profiles was measured.
Incubation vessels were placed in a large (50 cm diameter), hydrologically connected cryoconite hole for the first few days of the incubation. After three days, unequal melting of the cryoconite hole caused by the shading effect of the incubated vessels caused the vessels to fall over. These were refilled with water and transferred to a new incubation position on a tray in a small supraglacial stream and remeasured, after stabilizing the profile, several days later. Once on the tray, water exchange with the stream was impeded. In order to replicate this effect in the “open” incubations, approximately 30 ml of water was removed and replaced by cryoconite hole water every day in each open incubation, using a large pipette that was prewashed with stream water.
Laboratory incubations
Granule incubations: Intact cryoconite granules were defrosted and placed in freshwater media in sterile petri dishes and incubated for 1 h at 0.2°C under PAR = 145 µmol m−2 s−1 (to allow time for potential photosynthesis), after which the oxygen profiles were measured as described further on. Freshwater media for the cryoconite granule incubation contained the following components: NaCl (0.1 g l−1), MgCl2 · 6H2O (0.25 g l−1), CaCl2 · 2H2O (0.1 g l−1), KCl (0.1 g l−1), NH4Cl (0.1 g l−1), and KH2PO4 (0.1 g l−1). The medium was supplemented with 1 ml l−1 of the trace element solution SL 10 and 0.2 ml l−1 of a selenite and tungstate solution (Sass, Cypionka, and Babenzien Citation1997b). It was buffered with HEPES (2.38 g l−1) and the pH was adjusted to 7.2 with 1 M NaOH prior to autoclaving.
Community incubations: Prior to experiments, samples from Point 660 were defrosted for 48 h at 4°C in darkness, pooled together to ensure sufficient material, and incubated in the 3-D–printed vessels covered with acrylic Perspex transparent lids. They were incubated in Weiss VT LED-illuminated low-temperature environmental cabinets at 0.1°C for 116 days. Samples were incubated in light (n = 3, photosynthetically active radiation [PAR] = 145 µmol m−2 s−1) and in dark conditions (n = 3, wrapped in aluminum foil). Temperature and PAR were monitored continuously using Apogee Quantum and Campbell Scientific 107 sensors, logged with a Campbell Scientific CR7 datalogger.
Oxygen measurements
Oxygen concentrations in the sediments were measured using microsensors. During the laboratory community incubations, a Clark-type oxygen microcathode with a tip diameter of 500 µm (Unisense, Denmark) was used to measure oxygen at 1 mm increments, starting in the water above the sediment. The electrode was positioned using a motor micromanipulator. Each measurement lasted 30–60 s until the signal had stabilized, and were logged every 1 s using a Unisense Multimeter datalogger. The oxygen concentration at each depth point was determined by first taking a mean of the three last readings for each depth in the individual incubation vessels, and then in triplicates of each type (light and dark). For the first week, measurements were taken every other day; for the next four weeks, the measurements were taken weekly; and for the remaining three months, they were taken monthly. The oxygen microelectrode was calibrated using a sodium sulphite solution, to give a solution with 0 µmol oxygen concentration (as recommended by Presens, www.presens.de) compared to a solution 100 percent saturated with oxygen, which was created by bubbling ice-cold water with air for 5 min.
Oxygen concentrations in the cryoconite granule incubations were measured at 0.2 mm increments within the granules, using an oxygen microoptode with a tip diameter of 230 µm (Unisense, Denmark). The microoptode was positioned by a manual micromanipulator. Measurements were logged every 1 s using Unisense software, and each measurement lasted 20–30 s until the signal stabilized. The oxygen concentration for each depth was determined by taking a mean of the three previous readings.
pH measurements
pH profiles in the laboratory sediment incubations were measured using a Unisense pH microelectrode with a tip diameter of 500 µm. pH was measured in 1 mm increments, beginning in the water above the sediment. The electrode was positioned using a motor micromanipulator. Each measurement lasted 10–20 s until the signal has stabilized, and measurements were logged every 1 s using a Unisense Multimeter datalogger. The pH value at each depth was determined by first taking a mean of the ten previous readings for each depth in the individual incubations, and then in triplicates of each type (light and dark). The measurements were taken at the beginning and the end of long-term incubations. The pH electrode was calibrated using low ionic strength buffers of pH 4.1 and 6.96 (CamLab, UK).
Data analysis
Net Ecosystem Production (NEP) as mg C g−1 was calculated as the difference between oxygen concentration in light and dark incubations for each sediment depth, multiplied by the molecular mass of carbon (Bagshaw et al. Citation2016a; Hodson et al. Citation2010b; Telling et al. Citation2012b), assuming a 1:1 respiratory quotient. The sediment surface was identified in each profile using an in-house Python script (Python Software Foundation) and profile shape comparison, which matched repeated measurements.
Results
In situ oxygen profiles of cryoconite holes and cryoconite granules
The shape and size of cryoconite holes seemed to be constrained by local ice-surface morphology and hydrology, in common with Cook, Edwards, and Hubbard (Citation2015a). The most abundant types observed on this sector of the GrIS were very small (<5 cm) circular holes (), or so-called classic cryoconite holes, with a semi-circular shape (), a water depth of 10–30 cm, and sediment depth of 0.2–0.5 cm. When several of these holes are connected by melting they create irregularly shaped, partly drained and accumulated cryoconite holes, with varying water depth of 1–50 cm and sediment depth of 0.5–1 cm (). This type is less abundant than the classic and circular holes. Finally, when these bigger holes are drained as a result of hydrological processes, they create thick accumulations of sediment with depths of 1–5 cm, usually not covered with water. These are the least abundant, but they are notable features in the landscape () and are often found accumulated on a side of small, drained supraglacial streams or old, drained holes.
Each type of cryoconite hole was characterized by different oxygen profiles, shown in . In the classic type, oxygen decreases steadily with depth, by 90 µmol l−1 when compared to the overlying water at 3 mm depth, but did not become anoxic (A, and supplementary Figure S1). shows an intermediate stage of cryoconite material accumulation. The partly drained and accumulated hole was connected to the small supraglacial stream and collected additional material, either transported by the stream or by the coalescence of several, nearby holes, similar to observations by Fountain et al. (Citation2008b). These holes have an irregular shape, resulting in uneven sediment and water depth. The oxygen profiles were characterized by a rapid decrease of oxygen with depth (54.33 ± 63.32 µmol mm−1), becoming almost anoxic at 2 mm depth. Below the anoxic layer of sediment at 2 mm depth, oxygen concentrations increase gradually toward the bottom of the hole, from less than 10 µmol l−1 to 50 µmol l−1 at 5 mm depth. The oxygen profile of the drained and accumulated cryoconite () was marked by a small increase in oxygen concentration at the surface of the sediment (24.87 µmol mm−1 in the top 1 mm of the profile), which was not observed in the other types. Below the sediment surface, oxygen rapidly decreased with depth, reaching a state of anoxia at 4 mm. Oxygen profiles of individual cryoconite granules () also showed a rapid decrease of oxygen with depth (42.66 ± 11.57 µmol mm−1), albeit on a much smaller scale, with the center of the granule becoming almost anoxic in all four granules profiled, regardless of their size (2–4 mm, see supplementary Figure S2).
Figure 5. Oxygen profile measured using a microsensor within a 4 mm wide, spherical cryoconite granule
Short-term field incubations of cryoconite sediment
The time series of oxygen profiles and resulting NEP from the field incubations of cryoconite sediment and water in the custom-built 3-D–printed vessels are shown in and . In the open vessels during the first hours of the experiment (), the profile changed from oxic to anoxic at 8 mm depth within 90 min. This profile shape remained throughout the course of the incubations, although the oxic-anoxic interface showed vertical migration in some incubations ().
Figure 6. Temporal development of a characteristic oxygen profile in 10 mm thick cryoconite sediment after perturbation
Figure 7. Oxygen profiles of twenty-day open and closed cryoconite field incubations with calculated NEP. Error bars show standard deviation of triplicate bottle measurements of oxygen and standard error of NEP calculations
The dark, light, open, and closed incubations all developed an anoxic layer within a few hours of mixing (), and over time the anoxic layer got thicker: by day 20, there was anoxia at 7 mm, compared with 8 mm on day 6 in the open incubations. The open incubations, which could exchange water with the supraglacial system and gas with the atmosphere, showed greater differences between dark and light incubations than the closed incubations—mean differences: 50.49 ± (SD) 43.70 µmol l−1 and 1.81 ± 22.88 µmol l−1 in open vessels on day 6; 35.43 ± 31.94 µmol l−1 and −17.62 ± 23.86 µmol l−1 in closed vessels on day 20. The calculated NEP values in open incubations on the sediment surface increased from 0.5 mg C l−1 to 0.69 mg C l−1 between day 6 to day 20, while in the closed incubations the calculated NEP values decreased from 0.4 to 0.15 mg C l−1 during this time. In general, carbon production decreased with time: the maximum calculated carbon production in open incubations was lower on day 20 than on day 6 (1.62 compared with 0.92 mg C l−1). Moreover, the closed incubations generally show smaller production values, indicating little difference between the dark and light incubations.
Long-term laboratory incubations of cryoconite sediment
shows the evolution of the oxygen profile and associated NEP of long-term incubations conducted in the lab. In the first week, dark and light profiles resemble each other at the sediment surface, with some differences observed in the deeper layer (): oxygen concentrations below the surface are slightly higher in light than in dark incubations (mean: 51.9 ± 15.9 µmol l−1). After forty days (), we observe the greatest differences between oxygen concentrations in the light and dark bottles throughout the profile depth (up to 144.75 µmol l−1, mean: 100.3 ± 46.9 µmol l−1) as well as a difference of 3 mm depth between the location of anoxic layers in the light and dark incubations. By day 116 () profiles become similarly shaped again, although oxygen concentrations in the light incubations are lower on the surface (33.5 ± 5.27 µmol l−1) and higher within the sediment (32.7 ± 25.3 µmol l−1) than in the dark incubations. The depth of the anoxic zone at the end of the incubations is approximately the same as on day 8, at 5 mm.
Figure 8. Oxygen profiles of long-term, closed laboratory incubations of cryoconite material at 0.2°C for more than four months with calculated NEP. Error bars show standard deviation of triplicate bottle measurements of oxygen, and standard error of NEP calculations
The initial pH of cryoconite sediment, measured after defrosting and mixing the sediment, was 5.6 and was consistent throughout the profile (). The pH profiles measured after 116 days () show little variation with depth (±0.25 units), unlike the oxygen profiles. The mean pH increased by 0.5 in the dark bottles and 1 in the light after 116 days, with a consistent difference of 0.5 pH between the light and dark bottles. There was no significant difference between pH in the oxic versus anoxic zones in the light bottles (paired t test p = 0.211). In the dark bottles, there was a significant difference (p = 0.0003), with the pH increasing by 0.5 down the profile.
Figure 9. The pH profiles in the beginning and end of the long-term laboratory incubations, measured on the first day of incubations and then in dark and light vessels on day 116
Discussion
Morphology impacts biology
The accumulation of cryoconite on the surface of the GrIS depends primarily on local ice morphology, ice-microbe interactions, and hydrology, termed biocryomorphology by Cook, Edwards, and Hubbard (Citation2015a) and supported by our findings here. These differences are expressed by the variety of shapes and depths of sediment and of melted holes, which further results in a range of in situ oxygen profiles. This provides evidence that physical properties of cryoconite holes can have an impact on the biological relationships between heterotrophic and autotrophic processes in these ecosystems. We also demonstrate that dramatically different microhabitats may form very rapidly after sediment disturbance, and can persist for prolonged periods. Sediment depth is the primary control of the location of anoxic zones (), which corroborates studies previously conducted on cryoconite holes in Svalbard (Telling et al. Citation2012b) and elsewhere in Greenland (Cook et al. Citation2010b). These demonstrated that NEP of bulk cryoconite was strongly controlled by sediment thickness, because net autotrophy was only detected when sediment was thinner than 4 mm, while net heterotrophy clearly developed in thicker sediments. Because chemotrophic processes (e.g., by chemoorganotrophs and chemolithotrophs) use up the oxygen available within sediment, we would expect sediments with net oxygen consumption to exhibit anoxic zones. We demonstrate, for the first time, that low oxygen and anoxic zones exist in laboratory, field experimental, and in situ cryoconite holes.
The presence of overlying water also influences the oxygen profile, because the water layer restricts diffusion of oxygen from the atmosphere into the sediment. Anoxic zones in thick sediment covered with water are present at a shallower depth than in the sediment that is directly exposed to the atmosphere (. In thin sediments composed of relatively large granules, we observe a decline in oxygen concentrations through the bulk sediment, but no anoxia until the granules themselves are penetrated by the microsensors ().
The cryoconite therefore hosts several niches for anaerobic bacteria: anoxic zones in thick cryoconite sediment and microniches within cryoconite granules (). The oxygen is quickly consumed within cryoconite granules and the interior becomes completely anoxic. This is supported by the detection of denitrification genes and transcripts in cryoconite granules in Central Asia (Segawa et al. Citation2014b), and from similar oxygen profiles with microniches have been shown in aerated activated sludge granules (flocs), with anoxic niches coinciding with denitrification (Schramm et al. Citation1999b). The presence of an anaerobic floc center depends on microbial activity and the size of the granule. Therefore, only the biggest granules are likely to serve as refugia for anaerobic bacteria in the long term (Ploug et al. Citation1997b).
The structure of the sediment (size of granules, thickness, depth of overlying water) and microbial activity (oxygen consumption) influence the oxygen profile, which consequently may impact the community structure, because the anoxic zones are niches for anaerobic activity. The potential for the development of distinct community and nutrients cycling within granules was recognized by Uetake et al. (Citation2016b), but more analyses are required to link specific sections of the oxygen profiles with the metabolic groups that thrive there, particularly to detect anaerobic processes that occur only in the absence of oxygen. Sulphate-reducing bacteria and methanogenic archaea have been detected in environments with fluctuating oxic/anoxic conditions, such as sandy littoral sediments and soils (Peters and Conrad Citation1995b; Sass, Cypionka, and Babenzien Citation1997b), where they become active as soon as oxygen is depleted. However, these habitats could be seeded by permanently anoxic sediments and soils in close proximity. Cryoconite holes are far more isolated, and whether processes occurring in other environments are relevant here requires further investigation.
Impacts of isolation and stability
An unexpected observation in this data set was the small increase in oxygen at the base of the profile in . The likely source of this oxygen is debatable. It could be from in situ photosynthesis in moderately shaded microhabitats, which would not occur in the thickest sediments (). It could also be from the release of trapped bubbles of air during downward melting of the cryoconite hole into glacial ice, which was proposed as a source of oxygen by Bagshaw et al. (Citation2011b). Nutrient flux estimates, including inorganic carbon, suggest that resupply of nutrients from the melting ice is crucial to maintain ecosystem productivity (Telling et al., in preparation). We suggest that this is one mechanism that prevents the build up of anoxia in granule-rich classic cryoconite holes: oxygen is delivered by bubble release and water flow in between the granules (), which limits anaerobic activity.
An increase in oxygen concentration at the sediment surface, compared to the water above, was only observed in the thickest sediment accumulations (). We suggest that the long residence time of thick sediment (the accumulation was present on the ice surface for at least more than fourteen days of the field campaign) allows the development of a well-structured microbial mat. Filamentous mats were previously observed by Bagshaw et al. (Citation2016a) in Antarctic cryoconite incubations and by Cook et al. (Citation2015b) in cryoconite from the GrIS (also near Kangerlussuaq). The development of a large mat and consequently high rates of photosynthesis are not often possible in hydrologically connected cryoconite holes, where the sediment is frequently redistributed (Irvine-Fynn, Bridge, and Hodson Citation2011b). Although our data demonstrate that the microbial community can rapidly self-organize and begin production very soon after redistribution (), the formation of mats, knitted together by cyanobacteria emitting extracellular polymeric substances (Langford et al. Citation2010b), requires sediment stability that is only possible in larger cryoconite accumulations. These generally form on the edge of supraglacial stream or hydrologically abandoned cryoconite holes, and as such are not submerged by meltwater ().
Biogeochemical conditions within the cryoconite change extremely rapidly after the sediment is disturbed (), but the system seems to quickly stabilize, as demonstrated by the stable oxygen profiles measured only two hours after perturbation. As the perturbation occurs on a daily basis on a glacier, because of melting and changes in local hydrology (Irvine-Fynn, Bridge, and Hodson Citation2011b), this suggests that microbes must be versatile. They need to respond quickly to oxygen changes in their environment, which would be highly selective for facultative anaerobes, because strictly anaerobic organisms must be able to tolerate exposure to oxygen, and strict aerobes must be able to survive sudden oxygen deprivation. Characterization of anaerobes in the Antarctic cryoconite community showed that only a small percentage were strict anaerobes (Zdanowski et al. Citation2016b). However, vertical migration of strictly anaerobic sulphate reducers along changing oxygen profiles to prevent prolonged oxygen exposure has been described (Sass et al. Citation2002b; Taylor, Zhulin, and Johnson Citation1999b), and observation of our samples under a phase contrast microscope showed an abundance of motile cells. In addition, anoxic enrichment cultures generally yielded facultative anaerobes growing usually even better in the presence of oxygen (data not shown). The cryoconite microbial community must therefore be extremely versatile and able to thrive under a range of both physical and biogeochemical conditions.
Controls on productivity
Our field incubations mimic the partly drained and accumulated type of cryoconite hole, with deeper sediments where oxygen rapidly decreases with depth (). The open incubations reached steady state, with a constant difference between light and dark bottles between day 6 and day 20, likely showing that heterotrophic and phototrophic activity rates are in equilibrium with diffusion rates. A similar situation is likely to be observed in situ, where thick accumulations persisting during a prolonged period of time develop a stable oxygen profile, and distinct communities thrive until perturbation occurs.
The prolonged (116 days) closed laboratory incubations aimed to mimic the thickest cryoconite sediment deposits, some of which are covered with meltwater and some in direct contact with the atmosphere (). They show smaller differences between light and dark incubations than do open incubations and do not reach a steady state within twenty days. Instead, the light vessels remain relatively stable, albeit with lower concentrations of oxygen than the open counterparts, and there is very little discernible difference between light and dark vessels. This could be because the heterotrophs in the dark, closed vessels, deprived of organic carbon input from phototrophs and input of nutrients from melting of the surrounding ice and/or flushing of meltwater, may be reaching a dormant state or are slowly dying. It may also relate to the lower PAR in the laboratory versus in the field (145 vs. a peak of 1,617 µmol m−2 s−1, see supplementary Figure S3). The peak of activity and the biggest difference between light and dark vessels was observed on day 40 (). Dark vessels become anoxic, or had very low concentrations of oxygen throughout the profile, and the light vessels were elevated compared to dark vessels (±140 µmol at the sediment surface). Some of this activity can be explained by the establishment of a stable community (Bagshaw et al. Citation2016b), but some may also be attributed to the disturbance of the sediment during the collection of microbial subsamples. Redistribution of sediment and the addition of Milli-Q water allowed for redistribution of nutrients and a temporary peak of activity (day 40). Surprisingly, later we observed a slight increase of oxygen in the dark incubations, reaching a similar state to light ones. This might be explained by nutrient limitation because the incubations remained completely isolated after day 40, and there was increasing importance of diffusion rates from the water above. The closed light vessels cannot maintain high activity rates (day 116), and instead decline to a steady state, similar to that observed in field incubations after twenty days. Overall, our results are different from other studies showing accumulation of oxygen over time in closed cryoconite sediment incubations (Bagshaw et al. Citation2016a, Citation2016b; Cook et al. Citation2010b; Telling et al. Citation2012b), and support those that show balance between light and dark bottles (Hodson et al. Citation2010b; Telling et al. Citation2012b). This may be because the incubated communities from Greenland are not well adapted to prolonged isolation, unlike their Antarctic counterparts (Bagshaw et al. Citation2016b).
The closed laboratory incubations imitate communities isolated by ice lid, which have restricted nutrient input, although the influx of nutrients and oxygen from meltwater flushing and ice melt below the hole is not simulated by bottle incubations. The importance of nutrients acquired from the supraglacial water in stimulating microbial communities in cryoconite holes is still under investigation, with a recent study (Cameron et al. Citation2016b) showing no effect of nitrogen additions on the community structure and cell abundance. However, Cameron et al. (Citation2016b) only demonstrated that there was no nitrate limitation on a short time scale, and did not test other nutrients, co-limitations, or long-term effects. Phosphate limitation of cryoconite microorganisms was suggested previously by Stibal et al. (Citation2009b). The possibility that isolation from supraglacial water and the ice below restricts the activity of microorganisms or even initiates their survival/dormant stage requires further investigation.
The pH was also at a steady state throughout the 116-day closed experiment, increasing from 5.6 (initial) to 6.0 (dark) or 6.4 (light) (). Unlike the oxygen concentration profile, there was little variation in pH with depth. The increase in pH in both dark and light vessels is attributed to the dissolution of minerals (Tranter et al. Citation2002b) and anaerobic mineralization (Hu and Cai Citation2011b). The elevated pH in the light vessels is most likely because of photosynthesis in a closed system, which forces OH− ions into solution (Tranter et al. Citation2004b). Nitrogen cycling, with net denitrification performed by anaerobes, could also be a source of alkalinity in the sediment (Hu and Cai Citation2011b), especially in the deeper layers. However, the pH is remarkably constant with depth.
Our results show that biological activity within cryoconite is extremely sensitive to morphological controls and perturbation, and hence is spatially heterogeneous. Oxygen profiles through cryoconite are able to demonstrate biological activity more effectively than bulk measurements of the water above the sediment and to reveal processes in cryoconite that is not water covered; for example, on supraglacial stream banks and in larger holes (Fountain et al. Citation2004b). Although the most common morphology of cryoconite deposit observed in this sector of the GrIS was the classic circular, water-filled structure, the large deposits (drained and accumulated) are home to comparatively large microbial habitats, much of which are anoxic. Our results contradict the belief that cryoconite holes should generally be regarded as aerobic environments (Zdanowski et al. Citation2016b), but support the view that the primary control on biological activity is the structure of the sediment (biocryomorphology). The degree of hydrological connectivity and consequent residence time of the cryoconite is also a strong control, first by allowing the build up of a stable community structure (Bagshaw et al. Citation2016a, Citation2016b), and second by supplying nutrients via meltwater (Hodson et al. Citation2005b; Stibal and Tranter Citation2007b). Closed laboratory incubations had much lower productivity levels than those that were open, but we suspect that these are not wholly representative of the real system, because inputs from the ice melt below could not be included. When the holes remain hydrologically isolated, the melt of underlying ice, demonstrated by the presence of oxygen bubbles, is a likely source of nutrients. This was somewhat simulated when subsampling of the sediment introduced a small amount of fresh water and caused a peak in activity (), but future attempts at laboratory simulation must capture this effect. The constant downward melt of the cryoconite holes during the summer ablation season is an important mechanism for driving circulation within the sediment layer. Cryoconite microbial communities are extremely tolerant to a wide range of biogeochemical conditions, including complete anoxia, and can rapidly adapt via motile or facultative mechanisms to maximize productivity during the short summer melt season.
Conclusions
Microscale measurement of oxygen and pH profiles in cryoconite from the Greenland Ice Sheet implies that the physical structure of the cryoconite controls the potential for biological activity. Anoxic zones are common within cryoconite, and can establish rapidly after perturbation of sediment. This means that anaerobic microorganisms, as well as more widely studied aerobic species, are likely important taxa in the cryoconite ecosystem, which contribute to biological production in the glacial biome. Production is dependent on the supply of gases and nutrients, from meltwater flushing, via diffusion, and from melting of the ice below the cryoconite sediment. The contribution of anoxic microorganisms, particularly those in deeper sediment deposits, should not be overlooked when assessing the productivity of ice-sheet surfaces.
Supplementary Materials
Download Zip (89.2 KB)Acknowledgments
The authors cite no conflict of interest. Data supporting our conclusions can be found within this manuscript. Details of the Black and Bloom Team can be found at http://blackandbloom.org. Two anonymous reviewers provided helpful suggestions, which improved the manuscript.
Supplementary material
Supplemental data for this article can be accessed here.
Additional information
Funding
References
- Anesio, A. M., A. J. Hodson, A. Fritz, R. Psenner, and B. Sattler. 2009b. High microbial activity on glaciers: Importance to the global carbon cycle. Global Change Biology 15 (4):1–14.
- Anesio, A. M., and J. Laybourn-Parry. 2012b. Glaciers and ice sheets as a biome. Trends in Ecology & Evolution 27 (4):219–25.
- Anesio, A. M., B. Sattler, C. Foreman, J. Telling, A. Hodson, M. Tranter, and R. Psenner. 2010b. Carbon fluxes through bacterial communities on glacier surfaces. Annals of Glaciology 51 (56):32–40.
- Bagshaw, E. A., M. Tranter, A. G. Fountain, K. A. Welch, H. Basagic, and W. B. Lyons. 2007. Biogeochemical evolution of cryoconite holes on Canada Glacier, Taylor Valley, Antarctica. Journal of Geophysical Research: Biogeosciences (2005–2012) 112:G4.
- Bagshaw, E. A., M. Tranter, J. L. Wadham, A. G. Fountain, A. Dubnick, and S. Fitzsimons. 2016a. Processes controlling carbon cycling in Antarctic glacier surface ecosystems. Geochemical Perspectives Letters 2: 44–54.
- Bagshaw, E. A., M. Tranter, J. L. Wadham, A. G. Fountain, and M. Mowlem. 2011b. High-resolution monitoring reveals dissolved oxygen dynamics in an Antarctic cryoconite hole. Hydrological Processes 25 (18):2868–77.
- Bagshaw, E. A., J. L. Wadham, M. Tranter, R. Perkins, A. Morgan, C. J. Williamson, A. G. Fountain, S. Fitzsimons, and A. Dubnick. 2016b. Response of Antarctic cryoconite microbial communities to light. FEMS Microbiology Ecology 92 (6):fiw076.
- Benning, L. G., A. M. Anesio, S. Lutz, and M. Tranter. 2014b. Biological impact on Greenland’s albedo. Nature Geoscience 7 (10):691.
- Boetius, A., A. M. Anesio, J. W. Deming, J. A. Mikucki, and J. Z. Rapp. 2015b. Microbial ecology of the cryosphere: Sea ice and glacial habitats. Nature Reviews Microbiology 13 (11):677–90.
- Bøggild, C. E., R. E. Brandt, K. J. Brown, and S. G. Warren. 2010b. The ablation zone in northeast Greenland: Ice types, albedos and impurities. Journal of Glaciology 56 (195):101–13.
- Cameron, K. A., A. J. Hodson, and A. M. Osborn. 2012b. Structure and diversity of bacterial, eukaryotic and archaeal communities in glacial cryoconite holes from the Arctic and the Antarctic. FEMS Microbiology Ecology 82 (2):254–67.
- Cameron, K. A., M. Stibal, N. Chrismas, J. Box, and C. S. Jacobsen. 2016b. Nitrate addition has minimal short‐term impacts on Greenland ice sheet supraglacial prokaryotes. Environmental Microbiology Reports 9 (2):144–50.
- Chen, J., C. Wilson, and B. Tapley. 2006b. Satellite gravity measurements confirm accelerated melting of Greenland ice sheet. Science 313 (5795):1958–60.
- Christner, B. C., B. H. Kvitko, and J. N. Reeve. 2003b. Molecular identification of bacteria and eukarya inhabiting an Antarctic cryoconite hole. Extremophiles 7 (3):177–83.
- Cook, J., A. Edwards, and A. Hubbard. 2015a. Biocryomorphology: Integrating microbial processes with ice surface hydrology, topography, and roughness. Frontiers in Earth Science 3:78.
- Cook, J., A. Edwards, N. Takeuchi, and T. Irvine-Fynn. 2015b. Cryoconite the dark biological secret of the cryosphere. Progress in Physical Geography 40 (1):66–111.
- Cook, J., A. Hodson, A. Anesio, E. Hanna, M. Yallop, M. Stibal, J. Telling, and P. Huybrechts. 2012b. An improved estimate of microbially mediated carbon fluxes from the Greenland ice sheet. Journal of Glaciology 58 (212):1098–108.
- Cook, J., A. Hodson, J. Telling, A. Anesio, T. Irvine-Fynn, and C. Bellas. 2010b. The mass–area relationship within cryoconite holes and its implications for primary production. Annals of Glaciology 51 (56):106–10.
- Edwards, A., L. A. J. Mur, S. E. Girdwood, A. M. Anesio, M. Stibal, S. M. E. Rassner, K. Hell, J. A. Pachebat, B. Post, J. S. Bussell, et al. 2014b. Coupled cryoconite ecosystem structure-function relationships are revealed by comparing bacterial communities in alpine and Arctic glaciers. FEMS Microbiology Ecology 89 (2):222–37.
- Edwards, A., J. A. Pachebat, M. Swain, M. Hegarty, A. J. Hodson, T. D. Irvine-Fynn, S. M. Rassner, and B. Sattler. 2013b. A metagenomic snapshot of taxonomic and functional diversity in an alpine glacier cryoconite ecosystem. Environmental Research Letters 8 (3):035003.
- Fountain, A. G., T. H. Nylen, M. Tranter, and E. Bagshaw. 2008b. Temporal variations in physical and chemical features of cryoconite holes on Canada Glacier, McMurdo Dry Valleys, Antarctica. Journal of Geophysical Research: Biogeosciences 113 (G1):G01S92.
- Fountain, A. G., M. Tranter, T. H. Nylen, K. J. Lewis, and D. R. Mueller. 2004b. Evolution of cryoconite holes and their contribution to meltwater runoff from glaciers in the McMurdo Dry Valleys, Antarctica. Journal of Glaciology 50 (168):35–45.
- Hanna, E., P. Huybrechts, K. Steffen, J. Cappelen, R. Huff, C. Shuman, T. Irvine-Fynn, S. Wise, and M. Griffiths. 2008b. Increased runoff from melt from the Greenland Ice Sheet: A response to global warming. Journal of Climate 21 (2):331–41.
- Hodson, A., B. Brock, D. Pearce, J. Laybourn-Parry, and M. Tranter. 2015b. Cryospheric ecosystems: A synthesis of snowpack and glacial research. Environmental Research Letters 10 (11):110201.
- Hodson, A., K. Cameron, C. Bøggild, T. Irvine-Fynn, H. Langford, D. Pearce, and S. Banwart. 2010b. The structure, biological activity and biogeochemistry of cryoconite aggregates upon an Arctic valley glacier: Longyearbreen, Svalbard. Journal of Glaciology 56 (196):349–62.
- Hodson, A., P. Mumford, J. Kohler, and P. M. Wynn. 2005b. The High Arctic glacial ecosystem: New insights from nutrient budgets. Biogeochemistry 72 (2):233–56.
- Hu, X., and W. J. Cai. 2011b. An assessment of ocean margin anaerobic processes on oceanic alkalinity budget. Global Biogeochemical Cycles 25 (3):GB3003.
- Irvine-Fynn, T. D., J. W. Bridge, and A. J. Hodson. 2011b. In situ quantification of supraglacial cryoconite morphodynamics using time-lapse imaging: An example from Svalbard. Journal of Glaciology 57 (204):651–57.
- Langford, H., A. Hodson, S. Banwart, and C. Bøggild. 2010b. The microstructure and biogeochemistry of Arctic cryoconite granules. Annals of Glaciology 51 (56):87–94.
- Maier, R. M., and I. L. Pepper. 2015b. Bacterial growth. In Environmental microbiology, ed. I. L. Pepper, C. P. Gerba and T. J. Gentry, 37–56. 3rd ed. San Diego: Academic Press.
- Margesin, R., P. Schumann, D.-C. Zhang, M. Redzic, Y.-G. Zhou, H.-C. Liu, and F. Schinner. 2012a. Arthrobacter cryoconiti sp. nov., a psychrophilic bacterium isolated from alpine glacier cryoconite. International Journal of Systematic and Evolutionary Microbiology 62 (2):397–402.
- Margesin, R., C. Spröer, P. Schumann, and F. Schinner. 2003b. Pedobacter cryoconitis sp. nov., a facultative psychrophile from alpine glacier cryoconite. International Journal of Systematic and Evolutionary Microbiology 53 (5):1291–96.
- Margesin, R., C. Spröer, D.-C. Zhang, and H.-J. Busse. 2012b. Polaromonasglacialis sp. nov. and Polaromonas cryoconiti sp. nov., isolated from alpine glacier cryoconite. International Journal of Systematic and Evolutionary Microbiology 62 (11):2662–68.
- Margesin, R., G. Zacke, and F. Schinner. 2002b. Characterization of heterotrophic microorganisms in alpine glacier cryoconite. Arctic, Antarctic, and Alpine Research 34 (1):88–93.
- Musilova, M., M. Tranter, S. A. Bennett, J. Wadham, and A. M. Anesio. 2015b. Stable microbial community composition on the Greenland Ice Sheet. Frontiers in Microbiology 6 (MAR):193.
- Peters, V., and R. Conrad. 1995b. Methanogenic and other strictly anaerobic bacteria in desert soil and other oxic soils. Applied and Environmental Microbiology 61 (4):1673–76.
- Ploug, H., M. Kühl, B. Buchholz-Cleven, and B. B. Jørgensen. 1997b. Anoxic aggregates: An ephemeral phenomenon in the pelagic environment? Aquatic Microbial Ecology 13 (3):285–94.
- Porazinska, D. L., A. G. Fountain, T. H. Nylen, M. Tranter, R. A. Virginia, and D. H. Wall. 2004b. The biodiversity and biogeochemistry of cryoconite holes from McMurdo Dry Valley glaciers, Antarctica. Arctic, Antarctic, and Alpine Research 36 (1):84–91.
- Rignot, E., I. Velicogna, M. van den Broeke, A. Monaghan, and J. Lenaerts. 2011b. Acceleration of the contribution of the Greenland and Antarctic ice sheets to sea level rise. Geophysical Research Letters 38 (5):L05503.
- Sass, A. M., A. Eschemann, M. Kühl, R. Thar, H. Sass, and H. Cypionka. 2002b. Growth and chemosensory behavior of sulfate-reducing bacteria in oxygen: Sulfide gradients. FEMS Microbiology Ecology 40 (1):47–54.
- Sass, H., H. Cypionka, and H.-D. Babenzien. 1997b. Vertical distribution of sulfate-reducing bacteria at the oxic-anoxic interface in sediments of the oligotrophic Lake Stechlin. FEMS Microbiology Ecology 22 (3):245–55.
- Schramm, A., C. M. Santegoeds, H. K. Nielsen, H. Ploug, M. Wagner, M. Pribyl, J. Wanner, R. Amann, and D. De Beer. 1999b. On the occurrence of anoxic microniches, denitrification, and sulfate reduction in aerated activated sludge. Applied and Environmental Microbiology 65 (9):4189–96.
- Segawa, T., S. Ishii, N. Ohte, A. Akiyoshi, A. Yamada, F. Maruyama, Z. Li, Y. Hongoh, and N. Takeuchi. 2014b. The nitrogen cycle in cryoconites: Naturally occurring nitrification‐denitrification granules on a glacier. Environmental Microbiology 16 (10):3250–62.
- Smeets, C. J. P. P, P. Kuipers Munneke, D. van As, M. R. van den Broeke, W Boot, J. Oerlemans, H. Snellen, C. H. Reijmer, and R. S. W. van de Wal. 2018. The K-transect in west Greenland: Automatic weather station data (1993–2016). Arctic, Antarctic, and Alpine Research. doi: https://doi.org/10.1080/15230430.2017.1420954.
- Stibal, M., A. Anesio, C. Blues, and M. Tranter. 2009b. Phosphatase activity and organic phosphorus turnover on a high Arctic glacier. Biogeosciences 6 (5):913–22.
- Stibal, M., M. Šabacká, and J. Žárský. 2012b. Biological processes on glacier and ice sheet surfaces. Nature Geoscience 5 (11):771–74.
- Stibal, M., and M. Tranter. 2007b. Laboratory investigation of inorganic carbon uptake by cryoconite debris from Werenskioldbreen, Svalbard. Journal of Geophysical Research: Biogeosciences 112:G04S33.
- Takeuchi, N., S. Kohshima, and K. Seko. 2001b. Structure, formation, and darkening process of albedo-reducing material (cryoconite) on a Himalayan glacier: A granular algal mat growing on the glacier. Arctic, Antarctic, and Alpine Research 33 (2):115–22.
- Taylor, B. L., I. B. Zhulin, and M. S. Johnson. 1999b. Aerotaxis and other energy-sensing behavior in bacteria. Annual Reviews in Microbiology 53 (1):103–28.
- Tedesco, M., S. Doherty, S. Warren, M. Tranter, J. Stroeve, X. Fettweis, and P. Alexander. 2015b. What darkens the Greenland Ice Sheet?. EOS: Transactions, American Geophysical Union (96).
- Tedesco, M., X. Fettweis, M. van den Broeke, R. van de Wal, C. Smeets, W. J. van de Berg, M. Serreze, and J. Box. 2011b. The role of albedo and accumulation in the 2010 melting record in Greenland. Environmental Research Letters 6 (1):014005.
- Telling, J., A. M. Anesio, M. Tranter, M. Stibal, J. Hawkings, T. Irvine‐Fynn, A. Hodson, C. Butler, M. Yallop, and J. Wadham. 2012b. Controls on the autochthonous production and respiration of organic matter in cryoconite holes on high Arctic glaciers. Journal of Geophysical Research: Biogeosciences (2005–2012) 117:G01017
- Tranter, M., A. G. Fountain, C. H. Fritsen, W. Berry Lyons, J. C. Priscu, P. J. Statham, and K. A. Welch. 2004b. Extreme hydrochemical conditions in natural microcosms entombed within Antarctic ice. Hydrological Processes 18 (2):379–87.
- Tranter, M., M. Sharp, H. Lamb, G. Brown, B. Hubbard, and I. Willis. 2002b. Geochemical weathering at the bed of Haut Glacier d’Arolla, Switzerland: A new model. Hydrological Processes 16 (5):959–93.
- Uetake, J., T. Naganuma, M. B. Hebsgaard, H. Kanda, and S. Kohshima. 2010b. Communities of algae and cyanobacteria on glaciers in west Greenland. Polar Science 4 (1):71–80.
- Uetake, J., S. Tanaka, T. Segawa, N. Takeuchi, N. Nagatsuka, H. Motoyama, and T. Aoki. 2016b. Microbial community variation in cryoconite granules on Qaanaaq Glacier, NW Greenland. FEMS Microbiology Ecology 92 (9):fiw127.
- Werner, U., P. Bird, C. Wild, T. Ferdelman, L. Polerecky, G. Eickert, R. Jonstone, O. Hoegh-Guldberg, and D. De Beer. 2006b. Spatial patterns of aerobic and anaerobic mineralization rates and oxygen penetration dynamics in coral reef sediments. Marine Ecology Progress Series 309:93–105.
- Yallop, M. L., A. M. Anesio, R. G. Perkins, J. Cook, J. Telling, D. Fagan, J. MacFarlane, M. Stibal, G. Barker, and C. Bellas. 2012b. Photophysiology and albedo-changing potential of the ice algal community on the surface of the Greenland ice sheet. The ISME Journal 6 (12):2302–13.
- Zdanowski, M. K., A. Bogdanowicz, J. Gawor, R. Gromadka, D. Wolicka, and J. Grzesiak. 2016b. Enrichment of cryoconite hole anaerobes: Implications for the subglacial microbiome. Microbial Ecology 2016:1–7.