
 ?Mathematical formulae have been encoded as MathML and are displayed in this HTML version using MathJax in order to improve their display. Uncheck the box to turn MathJax off. This feature requires Javascript. Click on a formula to zoom.
ABSTRACT
Ice thickness measurements near the margin of the Greenland Ice Sheet (GrIS) are relatively sparse, presenting issues for modeling ice-flow dynamics, ice-sheet change, and subglacial hydrology. We acquired near-margin ice thickness data at Leverett Glacier, west Greenland, using a highly portable, low power, ground-penetrating radar operating at 10–80 MHz. Ice-thickness measurements, to a maximum of 270 m, were incorporated into the BedMachine model of ice thickness, created using mass conservation methods. The new data significantly modified the modeled ice thickness, and hence bed elevation and routing of subglacial water, in both the Leverett and adjacent Russell Glacier. Although the revised modeled basal topography and subglacial hydrology are consistent with observations, our new data unrealistically reduced the overall size of the Leverett Glacier hydrological catchment. Additional ice-thickness measurements are therefore required to realistically constrain subglacial topography and subglacial hydrological routing in this area. Our work improves understanding of the basal topography and the subglacial hydrology of Leverett Glacier, with implications for glacier dynamics and assessments of water piracy between catchments in the marginal zone of the GrIS, and for the interpolation of ice-thickness grids using mass conservation methods.
Introduction
The evolution and character of the western terrestrial margin of the Greenland Ice Sheet (GrIS) has been comprehensively monitored and investigated using remote sensing (e.g., Pritchard et al. Citation2009; Thomas et al. Citation2009). In situ field investigations around the ice sheet margin (<15 km) are relatively uncommon and localized, however, with relatively few measurements of ice thickness from boreholes and ground-based geophysical surveys. This represents a significant data gap, because the small size of many of the outlet glaciers that drain this region (<5 km wide) require high-resolution ice thickness and bed elevation data sets to accurately model ice-flow dynamics, marginal change, and the local routing of subglacial water. Statistical and physical interpolation methods (e.g., BedMachine, see Morlighem et al. Citation2013) do provide complete ice-sheet coverage of ice thickness, but close to the margin (i.e., <15 km inland) they can be based on few observations, and their uncertainty is large in these zones.
One terrestrial outlet glacier of the GrIS that has been intensively studied throughout the past ten years is Leverett Glacier (; Bartholomew et al. Citation2010, Citation2011; Cowton et al. Citation2016, Citation2013; Sole et al. Citation2013; Tedstone et al. Citation2014). This exemplar land-terminating margin is the site of a major subglacial drainage portal, and detailed field data have revealed key insights into (1) channelized subglacial drainage (Cowton et al. Citation2013); (2) the evolution of subglacial hydrology during the course of a melt season, and its influence on ice velocity during seasonal (Bartholomew et al. Citation2010) and interannual (Sole et al. Citation2013; Tedstone et al. Citation2015, Citation2014) timescales; and (3) rates of subglacial erosion and sediment budgets (Cowton et al. Citation2012). Ground and airborne geophysical surveys of the wider approximately 600 km2 catchment of Leverett Glacier have resulted in a high spatial resolution (250–500 m) ice-thickness and bed-topography grid (Lindbäck et al. Citation2014; Morlighem et al. Citation2013), and there is seismic evidence that parts of the neighboring Russell Glacier are underlain by weak sediments (Dow et al. Citation2013). Existing models of subglacial water route meltwater to exit Leverett Glacier at its southern margin. However, this routing is sensitive to modeled basal water pressure (Tedstone et al. Citation2014) and does not always emerge at the observed meltwater portal (although, see of Lindbäck et al. Citation2015). The uncertainty in the modeled routing is most likely because of the sparsity of ice-thickness measurements across Leverett Glacier and the region immediately inland. There also remains uncertainty as to the nature of the subglacial environment (i.e., is the underlying substrate bedrock or sediment, or a patchy distribution of both?).
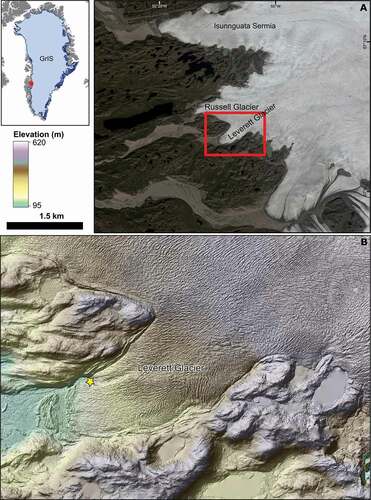
Figure 1. Location of Leverett Glacier. (A) Landsat image indicating the configuration of the Greenland Ice Sheet in the Leverett Glacier region (red box is panel B). (B) ArcticDEM, showing the elevation and structure of Leverett Glacier. The current location of the meltwater portal is indicated by a yellow star. Note the broad depression tracking northeast up-ice from the portal location
One way to address these uncertainties, and to improve our understanding of basal boundary conditions, is to acquire geophysical measurements of ice thickness and quantify subglacial topography, using a ground-penetrating radar. Although the application of airborne radio-echo sounding has revolutionized our understanding of the subglacial topography and basal environment of the GrIS in recent years (e.g., Gogineni et al. Citation2014; Morlighem et al. Citation2014), acquisition by fast-moving aircraft with high-frequency (e.g., 150 MHz) radars can result in poor quality data across thin land-terminating ice margins, resulting in few reliable ice-thickness measurements. Lower frequency (i.e., <5 MHz) airborne radars can help improve the quality of ice-thickness measurements to some degree (Mouginot et al. Citation2014), but for accurate and detailed ice-thickness measurements of individual outlet glaciers, ground-based low-frequency radar surveys (e.g., Lindbäck et al. Citation2014) are essential. However, relatively few surveys of this nature have been undertaken in the immediate vicinity (i.e., <15 km) of the Leverett Glacier ice margin, where the surface is rough and crevassed, because most of the commercial and bespoke radar systems available for such studies have been heavy, bulky, unwieldy, or unable to image through warm wet ice. To address these problems, low power, field-portable compact ice-penetrating radars that can acquire data across ice margins characterized by englacial and subglacial water are required. Ground-based surveys can be hampered by the difficulties in acquiring data over uneven and crevassed ice surfaces, however. One way to complement restricted or nonideal data acquisition is to combine ice-thickness observations with the mass conservation method for interpolating data (Morlighem et al. Citation2011). This approach can produce spatially consistent maps of ice thickness by combining spatially restricted radar-derived ice-thickness measurements and ice-surface velocity measurements.
We report reconnaissance ground-based ground-penetrating radar measurements of Leverett Glacier undertaken in spring 2015. We describe the commercial radar system used, because it is not widely known in the glaciological literature. We then describe the results of our ice-thickness soundings, potential insights into the subglacial environment, and the implications of our data for interpolating ice thickness and the modeling of subglacial water routing at Leverett Glacier. Our results demonstrate the sensitivity of mass conservation approaches to modeling ice thickness around the margin of the GrIS; we report that just a few limited measurements of thickness can significantly modify mass conservation ice-thickness and bed-elevation products, such as BedMachine, close to the ice margin, with implications for derived products such as subglacial hydrological pathways.
Study site
Leverett Glacier is located in west Greenland, some 15–20 km east from the town of Kangerlussuaq (). The glacier is a distributary of Russell Glacier, and while its tongue is only some 4 km long and 2 km wide, it has a large drainage basin (600 km2) that is thought to extend 80 km inland (Bartholomew et al. Citation2011). While the terminus itself is small, characterization of its terminus to approximately 15 km inland is important because of the volume of water that routes through the glacier and its meltwater portal (up to 800 m3 s−1 in summer; Tedstone et al. Citation2013). The ice-surface elevation declines from 1,500 m at the drainage basin divide of Leverett Glacier to 500 m at the up-ice edge of Leverett Glacier tongue, and to 250 m elevation at the glacier’s terminus. The glacier is characterized by a single large meltwater portal () that drains the glacier into the river Akuliarusiarsuup Kuua. A longitudinal surface depression approximately 20 m deep and 200 m across extends 2 km up-ice from the portal ( and ), suggesting the route of this major subglacial channel. There are few ice-thickness measurements within 20 km of the terminus of the glacier; where Operation IceBridge/CReSIS data have been acquired within this region, imaging of the bed of Leverett Glacier has been patchy (). During the period of our fieldwork at and around Leverett Glacier (April 1–8, 2015), the average daily air temperature recorded at the PROMICE KAN_B weather station varied between −17°C and −9°C. The average air temperature between August 2011 and July 2016 at KAN_B was approximately −4.9°C.
Figure 2. (A) Lightweight and highly portable Groundvue7 ground-penetrating radar, with operator fore of the radar. The radar transmitter, the dipole antenna enclosed within ruggedized tubing, and the glacier-travel safety rope are shown. Note the undulating nature of the ice surface (photo: Neil Ross, April 5, 2015). (B) Ice marginal meltwater portal at Leverett Glacier. Note the surface depression extending up-ice from the portal (photo: Andrew Sole, September 24, 2016)
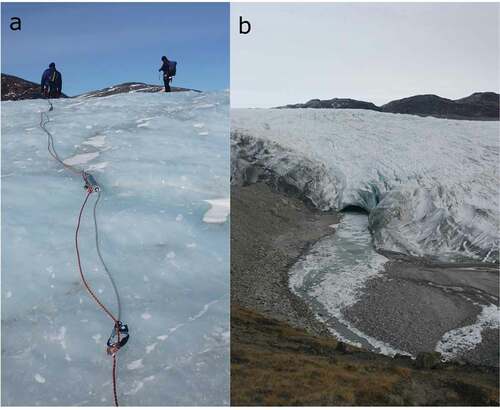
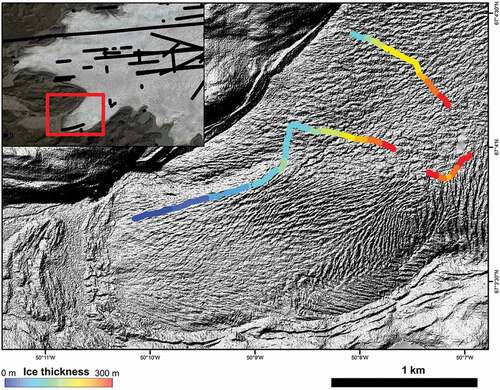
Figure 3. Location map of radar data acquisition, Leverett Glacier. Ice thickness shown as colored points, with hillshaded ArcticDEM to illustrate surface roughness and crevassing. Inset shows existing airborne ice-penetrating radar survey lines acquired by CReSIS/Operation IceBridge across the Russell and Leverett Glaciers. Red box shows extent of primary map
Methods
An Utsi Groundvue7 ground-penetrating radar system (Francke and Utsi Citation2009) was deployed at Leverett Glacier in early April 2015. The emitted bandwidth of the radar spans 10–80 MHz, centered on 40 MHz. It has a pulse-repetition frequency of 150 KHz, allowing real-time stacking of 7,500 traces at a rate of 2 Hz. Combined with a 14-bit analog digital converter, these parameters permit the acquisition of radar data with a greater dynamic range and therefore a high signal-to-noise ratio than other commercially available low-frequency ground-penetrating radars (Francke and Utsi Citation2009). Each stacked radar trace is comprised of 512 samples acquired at a sampling frequency of 160 MHz (i.e., one every 6.25 ns), and the system has a maximum fixed preset window length of 3,200 ns. Because the antennas of the system are resistively loaded wire dipoles housed within ruggedized tubing, and all data are transferred to a tablet by wireless network, the system is highly portable and light weight, and it can be carried in a rucksack to remote localities (). Because of a low output voltage (100 V), which results in low power consumption, the system has a battery life of 12–15 hrs, so data can be collected without interruption through the course of an entire field day, even in cold air temperatures.
Survey acquisition at Leverett Glacier was undertaken by a team of four, roped together for glacier travel, with two people fore of the radar and two aft. This allowed for control of the radar when traversing the heavily undulating glacier surface (). Combined with the presence of surface crevassing, the rugged ice surface made data acquisition in any regular grid-like pattern extremely difficult, so data were acquired opportunistically (). Because of the reconnaissance nature of the fieldwork, positional data were acquired by a GPS within an Algiz10 ruggedized tablet and, following equipment failure, by a handheld Garmin eTrex H GPS cabled to a laptop. All GPS data were recorded in the Groundvue7 software by logging an NMEA string of data from the GPS. During the period of our radar survey, air temperatures were still well below freezing, and the ice surface was relatively free of water, with the exception of a thin surface film melted by solar radiation on bare ice that included sediment debris.
Radar data were processed using the Sandmeier software REFLEXW. The following processing steps were undertaken: removal of traces acquired while the radar and survey team were stationary; band pass Butterworth filter (0–20 MHz); gain function; trace stacking (20 traces); mean filter (effectively, a low-pass filter that applied an average of more than five samples); and background removal (a mean trace was calculated for the entire profile, and the section below 1,000 ns was subtracted from all traces). The glacier bed was then picked manually along the length of the radar profile, and ice-thickness measurements were derived assuming a radio-wave velocity in ice of 0.168 m ns−1. This is a relatively fast velocity for Greenland ice, which means that our ice-thickness estimates are maximum values. No common-midpoint (CMP) surveys to measure radio wave velocity within the ice column were undertaken during this field campaign. Because of data-quality problems associated with a damaged and intermittently misfiring transmitter (damaged during earlier data acquisition in the proglacial environment), migration processing was not applied to the data.
Gridded bed digital elevation models (DEMs) were created using a mass conservation approach, which utilizes available ice-thickness data (typically derived from along-track ice- or ground-penetrating radar measurements) in combination with surface-ice velocity measurements to produce a spatially consistent ice-thickness dataset (Morlighem et al. Citation2013, Citation2011). Combining the mass conservation ice-thickness grid with the ArcticDEM ice-surface product (http://pgc.umn.edu/arcticdem), we created two bed DEMs: one using all available up-ice airborne and skidoo-based ice-thickness data (Lindbäck et al. Citation2014; Morlighem et al. Citation2013), and another with the addition of our new ground-based data from the Leverett Glacier tongue. It is important to be aware that if constraining measurements of ice thickness are few, then uncertainties in mass conservation–derived ice-thickness models for ice-marginal areas can be significant. The mass conservation technique was initially designed for fast flowing marine-terminating glaciers, and there are challenges with its application to slower-flowing land-terminating sectors of the ice sheet. This is because (1) errors in surface mass balance (SMB) and elevation changes accumulate quickly with slower-flowing ice (e.g., for ice flowing at 100 m yr−1 an SMB error of 2 m yr−1 will lead to an ice-thickness error of 20 m every km), and (2) along a flow line, the mass conservation method requires flux at the margin to be exactly 0 m yr−1, but this is difficult to achieve, because the integrated SMB is not necessarily zero. We have chosen the mass conservation approach to bed-elevation creation for two reasons: (1) it is the only option in an area with so few constraining ice-thickness measurements, and (2) we want to test how even a few, nonideally acquired, ice-thickness measurements can modify the mass conservation output.
The modeled bed DEMs and ice-thickness grids were used to calculate a hydropotential surface (Φ), which is a function of the elevation potential and the pressure potential from the overlying ice (Shreve Citation1972):
where ρw is the density of water, ρi is the density of ice, g is the acceleration due to gravity, h is the bed elevation, and H is the ice thickness. The flotation criterion, F, is the ratio of nonlocal subglacial water pressure to the ice-overburden pressure. Following previous subglacial hydrological studies (e.g., Livingstone et al. Citation2013), we assumed that the subglacial water pressure was equal to the ice-overburden pressure (F = 1). However, to investigate the sensitivity of the drainage system to the parameter F, we also used values of 0.8 and 0.9. Subglacial drainage pathways were calculated using a D-infinity approach, using the TauDEM toolbox in ArcMap (Tarboton Citation1997).
Results
Ground-penetrating radar
The ground-penetrating radar data () show a strong reflection identifiable from the uppermost part of the Leverett Glacier tongue to the ice margin. This is a reflection from the glacier bed, and defines the subglacial topography beneath Leverett Glacier. The bed reflector extends to depths that exceed the preset and fixed time window (3,200 ns) of the radar system used, with the reflection disappearing off the base of the center of the radargram, where the ice is thickest in the center of the valley. The ice is at least 270 m thick in this zone. The data show valley walls that dip toward the center of the glacier from the northwest margin. Because of surface crevassing ( and ), we were unable to acquire ground-based data across the entire valley, but thinner (~220 m) ice, which we assume then thins further toward the lateral margin, is apparent in the southeastern-most zone of our profile. Our data show that the deep central part of the glacier (i.e., where it is in excess of 270 m thick) continues for at least 400 m down-ice, but given zones of surface crevassing () we expect that the ice starts to thin again relatively quickly. At approximately 3,000 m along the profile, the ice is approximately 100 m thick, and surface crevassing suggests thinner ice to each side of this zone. From 3,000 m to 4,000 m along the profile, the ice thickness thins from 100 m to 0 m.
Figure 4. Ground-penetrating radar data from the marginal zone of Leverett Glacier. (A) Raw unprocessed data; (B) data after processing (bandpass filter [0–20 MHz], gain, trace stacking, mean filter, background removal); and (C) data after processing, with manual picking of the bed reflection in red. Red arrow shows location of bright subice bed reflection. The radargrams are 4 km long. Because of the large vertical uncertainties associated with the GPS systems used when logging the radar data, these radargrams are not presented with a vertical correction
![Figure 4. Ground-penetrating radar data from the marginal zone of Leverett Glacier. (A) Raw unprocessed data; (B) data after processing (bandpass filter [0–20 MHz], gain, trace stacking, mean filter, background removal); and (C) data after processing, with manual picking of the bed reflection in red. Red arrow shows location of bright subice bed reflection. The radargrams are 4 km long. Because of the large vertical uncertainties associated with the GPS systems used when logging the radar data, these radargrams are not presented with a vertical correction](/cms/asset/b6af4628-9629-4dd3-944c-1d71583fe1c7/uaar_a_1420949_f0004_oc.jpg)
The qualitative character of the bed reflection is fairly consistent throughout the radar profile, with no obvious zones of localized enhanced reflectivity, except, in accordance with attenuation increasing with ice thickness, where the ice is thinner. Between 3,600 m and 3,900 m along the profile, where the ice is less than 60 m thick, at least one strong reflection is apparent below the inferred bed reflection (), implying potential penetration of energy into the underlying substrate, and reflection from a sub-ice interface. A similar reflection was observed in a closely spaced parallel radar line.
Gridded ice thickness
shows the BedMachine mass conservation DEM before the inclusion of our new ice-thickness data (Morlighem et al. Citation2013). The original BedMachine is characterized by both thick (>300 m) ice inland of the Leverett and Russell Glacier tongues and a broad area of intermediate ice thickness (~150 m) that extends to within 1 km of the Russell Glacier ice margin, but thinner, typically ice less than 100 m thick, beneath Leverett Glacier. It is clear, however, that because of the paucity of ice-thickness measurements close to the margin, the thickness of the Leverett Glacier tongue is poorly constrained, with the ice being much thinner than our new measurements demonstrate ().
Figure 5. BedMachine ice thickness product (A) without and (B) with our ice-thickness measurements derived from ground-based GPR data. The colored dots are the radar-derived ice thicknesses at the same color scale for comparison
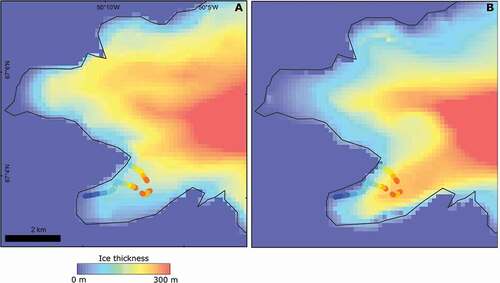
The inclusion of our ice-thickness measurements into BedMachine () substantially thickens (i.e., approximately doubles) the ice in the Leverett Glacier distributary, with a much more extensive zone of thicker ice extending from the upstream end of the model domain. The revised BedMachine DEM is therefore more consistent with our ice-thickness observations from Leverett Glacier than the original version. It is interesting to note that the new data from Leverett Glacier also modified the ice thickness and the spatial distribution of thicker ice in Russell Glacier, making the ice thinner closer to the margin and in the middle sections of the domain, constraining laterally the thicker ice much more than the original version of BedMachine did. This modification of an adjacent catchment is a significant, although not necessarily surprising, outcome of the inclusion of our new data in the process of bed-elevation DEM production using mass conservation methods. It is important to note that the ice thickness of Russell Glacier is poorly constrained by observations, however, and this lack of constraint may be the reason for the marked thickness change between and .
Hydrological potential
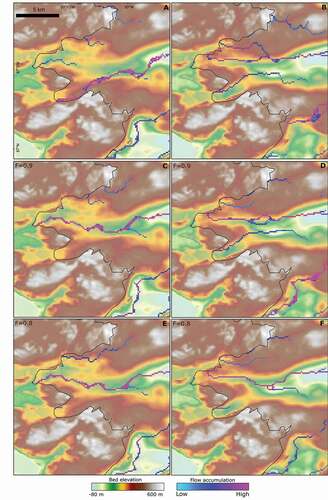
The subglacial drainage pathways beneath Leverett Glacier vary sensitively depending on whether our new ice-thickness data are incorporated into BedMachine (). For F = 1, the original BedMachine DEM generates a large subglacial drainage catchment that routes water through Leverett Glacier rather than Russell Glacier (). However, the emergence of the predicted drainage pathway at the terminus of Leverett Glacier does not correspond to the location of the meltwater portal. By incorporating the new ice-thickness data into BedMachine we are able to route subglacial water to the meltwater portal (), but the area of Leverett Glacier’s subglacial catchment shrinks with most of the water instead routed toward Russell Glacier. At 90 percent subglacial water pressure relative to ice-overburden pressure (F = 0.9), drainage switches toward Russell Glacier using the original bed DEM (). Conversely, the updated BedMachine produces a much more stable drainage configuration, with water flow draining down both Russell and Leverett Glaciers for both F = 1 and F = 0.9 (). At 80 percent subglacial water pressure relative to ice-overburden pressure (F = 0.8), the majority of water is routed down the Russell Glacier both in the original and updated DEMs.
Figure 6. Hydropotential routing of subglacial water based on BedMachine ice thickness product (A) without and (B) with our ice-thickness measurements incorporated for F = 1; (C) without and (D) with our ice-thickness measurements incorporated for F = 0.9; and (E) without and (F) with our ice-thickness measurements incorporated for F = 0.8
Discussion
Ice thickness and basal conditions of Leverett Glacier
Our low-powered ground-penetrating radar imaged the bed of Leverett Glacier successfully to the fixed limits of the radar system’s time window of 3,200 ns. Our observations demonstrate that, within 3 km of its margin, Leverett Glacier is much thicker than previously modeled. Maximum observed thicknesses were approximately 270 m; but, given the profile of the bed imaged, thicknesses in the order of 300 m are plausible.
The form of the glacier bed imaged is typical of the surrounding subaerial topography, with relatively smooth and undulating low hills with exposed bedrock or thin sedimentary drapes. On the basis of our data, we cannot determine whether the bed of Leverett Glacier is composed of rock or sediment. We expect that a mixture of bedrock along the sides of the subglacial valley, and sediment draping the valley floor (much like the proglacial topography in this region), is likely. High subglacial erosion rates (Cowton et al. Citation2012) may indicate that the bed of Leverett Glacier is unconsolidated, providing a ready supply of sediment for erosion and transport; but, on the basis of our current data we cannot ascertain whether this is the case. The observation that a strong sub-bed reflection is apparent near the margin of Leverett Glacier (), where the ice is thin, however, is of particular note here. Based on the geometry of the reflection, it is not a multiple reflection from the ice bed. There are two possibilities that can explain this reflection: (1) the radar energy is penetrating into the underlying sediments and imaging either an intrasediment boundary or a sediment-bedrock interface, or (2) the radar is imaging a unit of debris-rich basal ice, similar to that documented at the adjacent Russell Glacier margin (Sugden et al. Citation1987). On the basis of our current observations, either scenario is plausible, and testing of these ideas must await further geophysical or borehole investigations.
Modeled ice thickness and subglacial hydrological routing
The inclusion of our ice-thickness measurements into the bed-elevation DEM BedMachine resulted in significant changes to ice thickness not just beneath Leverett Glacier but also elsewhere in the mass conservation domain (i.e., Russell Glacier). This demonstrates the knock-on impacts of poorly constrained ice thicknesses for adjacent catchments, particularly if those catchments’ flows are slowing and lack ice-thickness observations. If there is a need (e.g., for numerical modeling purposes) to improve ice-thickness measurements in one particular catchment for development of a bed-elevation DEM from mass conservation approaches, consideration also needs to be given to additional acquisition of ice-thickness data in adjacent glaciers.
Our new bed-elevation product for the Leverett-Russell Glacier domain led to significant modifications to the modeled routing of subglacial water (). The new DEM routed water ( and ) to the location of the large meltwater portal at the margin of Leverett Glacier, and in reasonably close proximity to the linear surface depression assumed to correspond to the location of a subglacial channel. At the same time, however, it substantively reduced the size of the subglacial hydrological catchment draining into Leverett Glacier and the volume of water flowing through the Leverett Glacier distributary (e.g., compare to . Given the volume of water that typically discharges through the Leverett Glacier meltwater portal in summer (Tedstone et al. Citation2013), we believe that this reduction in subglacial catchment size is artificial, and is likely to be a function of the relative paucity of ice-thickness measurements in the middle parts of the BedMachine domain used within this study. Further up-ice (i.e., >15 km from the margin) there are numerous ground and airborne measurements of ice thickness (Lindbäck et al. Citation2014), but there remains a data-sparse region between our new data and existing measurements. This region would be an excellent target for future ground-based geophysical surveys of ice thickness, surface crevassing permitting.
Subglacial hydrological routing through Leverett and Russell Glaciers is strongly influenced by variations in subglacial water pressure (F). For F = 1 water is routed from Russell Glacier into the Leverett Glacier distributary irrespective of which bed DEM is used ( and ). However, as subglacial water pressure is lowered (e.g., F = 0.9 and F = 0.8), as might be expected in more ice-marginal settings (Fountain and Walder Citation1998), the influence of bed topography becomes relatively more important. Thus, while the updated DEM is still able to drive water from Russell Glacier into the Leverett Glacier distributary when F = 0.9, the region of high topography just upstream of our new measurements (see earlier) acts as a barrier preventing water from diverting into Leverett Glacier when F = 0.8, using the updated DEM, and for F = 0.9 and F = 0.8, using the old DEM. This highlights the importance of deriving and using accurate bed DEMs when applying simple hydrological routing techniques. Subglacial hydrological routing analyses that use F values less than 1 are particularly sensitive to uncertainties in the bed DEM, and this is likely to be most relevant in ice-marginal areas where large variations in water pressure occur (Lindbäck et al. Citation2015).
The results of the modified BedMachine bed-elevation DEM and the resultant hydrological pathways have broader implications for articles investigating water piracy between adjacent Greenlandic outlet glaciers (e.g., Chu, Creyts, and Bell Citation2016; Lindbäck et al. Citation2015). Considerable uncertainties in such studies will persist where there is a lack of ice-marginal ice-thickness data (e.g., Chu, Creyts, and Bell Citation2016). As our study has shown, even just a few measurements of ice thickness near the margin of a slow-flowing outlet glacier can significantly modify bed-elevation DEMs derived using mass conservation approaches, and hence subglacial water routing.
Conclusions
We have demonstrated that:
The lowermost 2 km of Leverett Glacier is, in places, more than 270 m thick. This is much thicker than modeled bed-elevation products have previously suggested.
No obvious basal channel feature that links to the meltwater portal at the ice margin was imaged in our GPR data; although, one could exist in zones of thicker ice where the fixed time window of the radar meant that the bed of the glacier could not be imaged, or a channel is present but is smaller than the resolution of our radar.
Inclusion of our ice-thickness data into the BedMachine ice-thickness product significantly alters modeled bed elevation across the Leverett and Russell Glacier domain, illustrating the inherent sensitivity and uncertainties of the mass conservation method at slow-flowing land-terminating ice margins.
Changes to the mass conservation–derived bed-elevation DEM (1) alter the modeled routing of subglacial water beneath Leverett Glacier so that the routing is more consistent with the location of the meltwater portal and the linear zone of ice-surface drawdown assumed to be associated with the flow of subglacial meltwater, and (2) reduce the catchment size and volume of subglacial discharge flowing through and out of the Leverett Glacier, although this could be explained as the result of poorly constrained bed elevation just up-ice of the Leverett and Russell Glacier tongues.
When modeled subglacial water pressures are lowered (e.g., F = 0.8), the influence of bed topography is greater. Where ice thickness, and hence bed elevation, are poorly constrained (e.g., in the upper parts of Leverett Glacier) the modeled routing of subglacial water may not reflect reality.
To determine hydrological routing using the simple Shreve approach, it is essential to constrain the bed with accurate observations. This is particularly important for the slower-flowing land-terminating margins of Greenland, where mass conservation approaches to modeling basal topography may perform poorly.
Future work should build on that described here by the systematic acquisition of ground-based, or perhaps helicopter-borne (e.g., Blindow, Salat, and Casassa Citation2012; Rutishauser, Maurer, and Bauder Citation2016), ice-penetrating radar across Leverett Glacier and similar land-terminating margins in west Greenland. The acquisition of a detailed 3-D grid of the lowermost parts of Leverett Glacier to image and characterize possible subglacial sediments and/or debris-rich basal ice should also be considered.
Acknowledgments
NR acknowledges a Royal Society Research Grant and Newcastle University for financial support that facilitated this research. SL, AS, and AI acknowledge financial support from the University of Sheffield, and a White Rose University Consortium Collaboration Fund grant awarded to AS and SL. In addition, we would like to thank the Kangerlussuaq International Science Support (KISS) facility, Professor Pete Nienow (University of Edinburgh) for loan of a satellite phone, and Matt Guy (Geomatrix) and Vincent Utsi (Utsi Electronics) for remote support with the radar system during fieldwork.
Related Research Data
References
- Bartholomew, I., P. Nienow, D. Mair, A. Hubbard, M. A. King, and A. Sole. 2010. Seasonal evolution of subglacial drainage and acceleration in a Greenland outlet glacier. Nature Geoscience 3:1–11.
- Bartholomew, I., P. Nienow, A. Sole, D. Mair, T. Cowton, and M. A. King. 2011. Seasonal variations in Greenland ice sheet motion: Inland extent and behaviour at higher elevations. Earth and Planetary Science Letters 307:271–78.
- Blindow, N., C. Salat, and G. Casassa. 2012. Airborne GPR sounding of deep temperate glaciers: Examples from the Northern Patagonian icefield. In the 2012 14th International Conference on Ground Penetrating Radar (GPR), Shanghai, China. pp. 664–69.
- Chu, W., T. T. Creyts, and R. E. Bell. 2016. Rerouting of subglacial water flow between neighbouring glaciers in West Greenland. Journal of Geophysical Research: Earth Surface 121:925–38.
- Cowton, T., P. Nienow, I. Bartholomew, A. Sole, and D. Mair. 2012. Rapid erosion beneath the Greenland Ice Sheet. Geology 40:343–46.
- Cowton, T., P. Nienow, A. Sole, I. Bartholomew, and D. Mair. 2016. Variability in ice motion at a land-terminating Greenlandic outlet glacier: The role of channelized and distributed drainage systems. Journal of Glaciology 62:451–66.
- Cowton, T., P. Nienow, A. Sole, J. Wadham, G. Lis, I. Bartholomew, and D. Mair. 2013. Evolution of drainage system morphology at a land‐terminating Greenlandic outlet glacier. Journal of Geophysical Research 118:1–13.
- Dow, C. F., A. Hubbard, A. D. Booth, S. H. Doyle, A. Gusmeroli, and B. Kulessa. 2013. Seismic evidence of mechanically weak sediments underlying Russell Glacier, West Greenland. Annals of Glaciology 54:135–41.
- Fountain, A. G., and J. S. Walder. 1998. Water flow through temperature glaciers. Reviews of Geophysics 36:299–328.
- Francke, J., and V. Utsi. 2009. Advances in long-range GPR systems and their applications to mineral exploration, geotechnical and static correction problems. First Break 27:85–93.
- Gogineni, S., J.-B. Yan, J. Paden, C. Leuschen, J. Li, F. Rodriguez-Morales, D. Braaten, K. Purdon, Z. Wang, W. Liu, et al. 2014. Bed topography of Jakobshavn Isbræ, Greenland, and Byrd Glacier, Antarctica. Journal of Glaciology 60:813–33.
- Lindbäck, K., R. Petterson, S. H. Doyle, C. Helanow, P. Jansson, S. S. Kristensen, L. Stenseng, R. Forsberg, and A. L. Hubbard. 2014. High-resolution ice thickness and bed topography of a land-terminating section of the Greenland ice sheet. Earth System Science Data 6:331–38.
- Lindbäck, K., R. Pettersson, A. L. Hubbard, S. H. Doyle, D. van As, A. B. Mikkelsen, and A. A. Fitzpatrick. 2015. Subglacial water drainage, storage and piracy beneath the Greenland ice sheet. Geophysical Research Letters 42:7606–14.
- Livingstone, S. J., C. D. Clark, J. Woodward, and J. Kingslake. 2013. Potential subglacial lake locations and meltwater drainage pathways beneath the Antarctic and Greenland ice sheets. Cryosphere 7:1721–40.
- Morlighem, M., E. Rignot, J. Mouginot, H. Seroussi, and E. Larour. 2014. Deeply incised submarine glacial valleys beneath the Greenland ice sheet. Nature Geoscience 7:418–22.
- Morlighem, M., E. Rignot, J. Mouginot, X. Wu, H. Seroussi, E. Larour, and J. Paden. 2013. High-resolution bed topography mapping of Russell Glacier, Greenland, inferred from operation icebridge data. Journal of Glaciology 59:1015–23.
- Morlighem, M., E. Rignot, H. Seroussi, E. Larour, H. Ben Dhia, and D. Aubry. 2011. A mass conservation approach for mapping glacier ice thickness. Geophysical Research Letters 38:L19503. doi:https://doi.org/10.1029/2011GL048659.
- Mouginot, J., E. Rignot, Y. Gim, D. Kirchner, and E. Le Meur. 2014. Low-frequency radar sounding of ice in East Antarctica and southern Greenland. Annals of Glaciology 55:138–46.
- Pritchard, H. D., R. J. Arthern, D. G. Vaughan, and L. A. Edwards. 2009. Extensive dynamic thinning on the margins of the Greenland and Antarctic ice sheets. Nature 461:971–75.
- Rutishauser, A., H. Maurer, and A. Bauder. 2016. Helicopter-borne ground-penetrating radar investigations on temperate alpine glaciers: A comparison of different systems and their abilities for bedrock mapping. Geophysics 81:WA119–29.
- Shreve, R. L. 1972. Movement of water in glaciers. Journal of Glaciology 11:205–14.
- Sole, A., P. Nienow, I. Bartholomew, D. Mair, T. Cowton, and M. A. King. 2013. Winter motion mediates dynamic response of the Greenland ice sheet to warmer summers. Geophysical Research Letters 40:3940–44.
- Sugden, D. E., P. G. Knight, N. Livesey, R. D. Lorrain, R. A. Souchez, J. L. Tison, and J. Jouzel. 1987. Evidence for two zones of debris entrainment beneath the Greenland ice sheet. Nature 328:238–41.
- Tarboton, D. G. 1997. A new method for the determination of flow directions and contributing areas in grid digital elevation models. Water Resources Research 33:309–19.
- Tedstone, A. J., P. Nienow, N. Gourmelen, A. Dehecq, D. Goldberg, and E. Hanna. 2015. Decadal slowdown of a land-terminating sector of the Greenland ice sheet despite warming. Nature 526:692–95.
- Tedstone, A. J., P. Nienow, N. Gourmelen, and A. J. Sole. 2014. Greenland ice sheet annual motion insensitive to spatial variations in subglacial hydraulic structure. Geophysical Research Letters 24 (41):8910–17.
- Tedstone, A. J., P. Nienow, A. J. Sole, D. W. F. Mair, T. R. Cowton, I. D. Bartholomew, and M. A. King. 2013. Greenland ice sheet motion insensitive to exceptional meltwater forcing. Proceedings of the National Academy of Sciences 110 (49):19719–24. doi:https://doi.org/10.1073/pnas.1315843110
- Thomas, R., E. Frederick, W. Krabill, S. Manizade, and C. Martin. 2009. Recent changes on Greenland outlet glaciers. Journal of Glaciology 55:147–62.